2 2 NORMAL DISTRIBUTION NORMAL DISTRIBUTION Normal Distributions

2. 2 NORMAL DISTRIBUTION

NORMAL DISTRIBUTION Normal Distributions are called “normal” because they reflect the distribution of real data SAT scores, biological characteristics: Height, weight, length A Normal distribution is centered at the mean and has a bell shaped curve Most data can be standardized into a normal distribution that can be used to calculate the percentile of any observation “Standard Normal Distribution” N(0, 1) [µ = 0; σ = 1] Ball Dropping Applet

PROPERTIES OF NORMAL DISTRIBUTIONS A continuous, symmetric, bell-shaped distribution of a variable Symmetric about the center Mean, median, and mode are in the middle at the peak The total area under the curve is equal to 1. So 100% of all continuous random variables fall under the curve The two tails continue in both directions, never touching the X-axis The std dev. (σ) determines the width of the curve y x 0 2 4

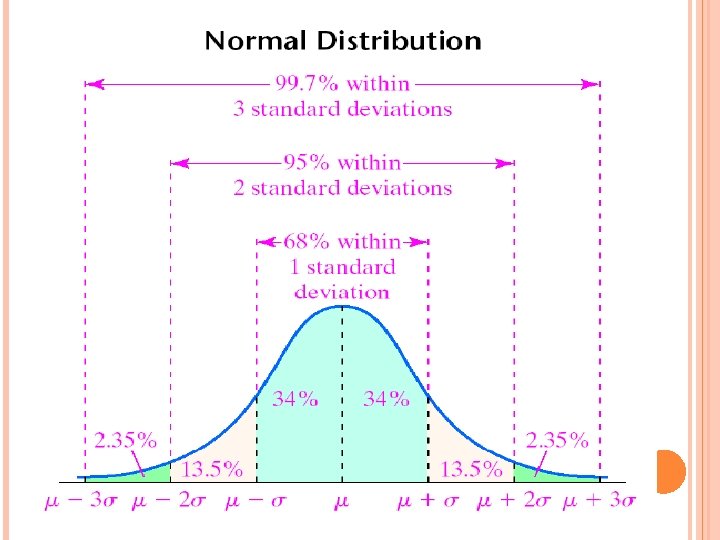
68 -95 -99. 7 RULE A normal distribution with a mean of µ and a standard deviation σ will have the following properties Within 1σ of the mean, you will have 68% of observations Within 2σ of the mean, you will have 95% of observations Within 3σ of the mean, you will have 99. 7% of observations y 0. 3% of observations will be outside of 3σ of the mean x 0

PRACTICE: FIND THE AREAS OF THE SHADED REGION: y y 0 x x y y 0 0 x
,")
Z-SCORES AND NORMALLY DISTRIBUTED If your variables ‘x’ are normally distributed with N(µ, σ), convert it to a standard normal distribution N(0, 1) Standardize any observation ‘x’ to find the Z-scores are used to locate how many standard deviations an observation ‘x’ is from the mean The Standard Normal Table (Table A) gives only the LEFT area of the curve for any Z-score y x Z-score Table 0

EX: FIND THE PROPORTIONS OF OBSERVATIONS FROM A NORMAL STANDARD DISTRIBUTION THAT FALL WITHIN EACH REGION. i) Use Table A iii) Normalcdf(a, b, µ, σ) ii) Shade. Norm(a, b, µ, σ) Z-score Table

EX: FOR EACH STANDARD NORMAL DISTRIBUTION, FIND THE Z-SCORE WITH THE GIVEN AREA y 0 x y x 0 Z-score Table
THE LENGTH OF HUMAN PREGNANCIES FROM CONCEPTION TO BIRTH RESEMBLES")
EX: (P 147 #2. 33)THE LENGTH OF HUMAN PREGNANCIES FROM CONCEPTION TO BIRTH RESEMBLES A NORMAL DISTRIBUTION WITH A MEAN OF 266 DAYS AND A STANDARD DEVIATION OF 16 DAYS. FIND THE FOLLOWING: a) What percent of pregnancies last less than 240 days b) What percent of pregnancies last between 240 to 270 days? c) How long do the longest 20% of pregnancies last? a) Solution: Find the z-score for 240 days Use (Table A) to find the left area for a Z-score of -1. 63 Conclusion: About 5. 2% of pregnancies will last less than 240 days Z-score Table Alternative Solution: Shade. Norm
 Find the Z-score of both observations 240 & 270 Use Table A to")
b) Find the Z-score of both observations 240 & 270 Use Table A to find the left area of each Z-score Subtract the area to find the area in between: Conclusion: About 55% of pregnancies will last between 240 to 270 days Z-score Table Alternative Solution: If you use Shade. Norm, make you the previous diagram is cleared
 We are looking for the top 20% of pregnancies, then the right area")
c) We are looking for the top 20% of pregnancies, then the right area will be 20% and the left area will be 80%. Use Table A to find the Zscore with the Left area from 80%. to 100% Alternative Solution: Use Table A to find the Z-scores Use Inverse Norm to find the value of the observation for 80% to 100% Use the Z-scores to find the values of the observations Conclusion: The longest 20% of pregnancies will last between 279 to 342 days Conclusion: The longest 20% of pregnancies will last between 279 to 320 days Z-score Table
, FIND THE FOLLOWING:")
PRACTICE: SUPPOSE THE DISTRIBUTION OF SAT MATH SCORES IS N(870, 35), FIND THE FOLLOWING: i) What proportion of SAT Test scores is less than 850? ii) What proportion of SAT Test scores is between 800 and 900? iii) What proportion of SAT Test scores is greater than 890? iv) Find the score in the 60 th percentile. Z-score Table

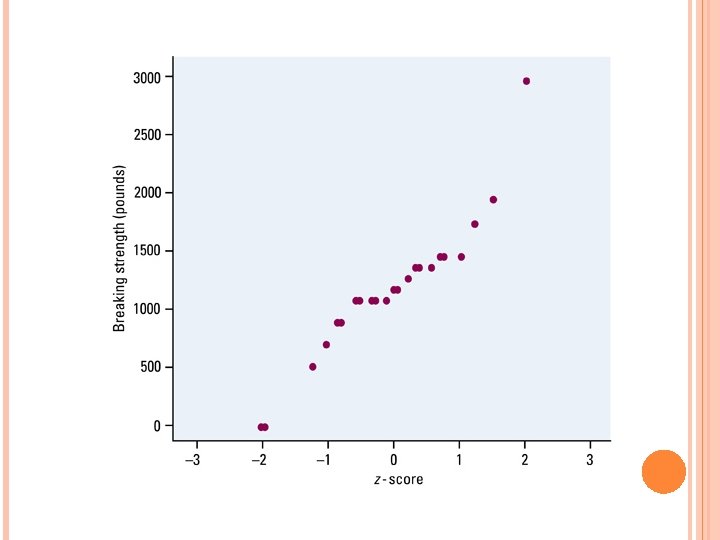
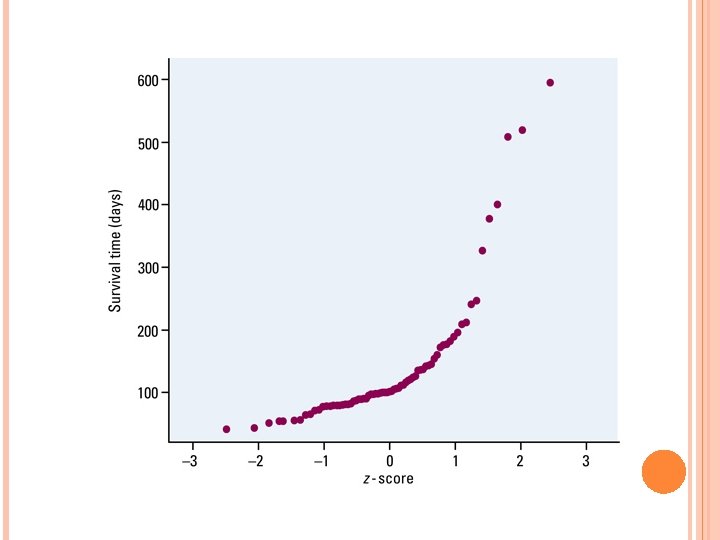
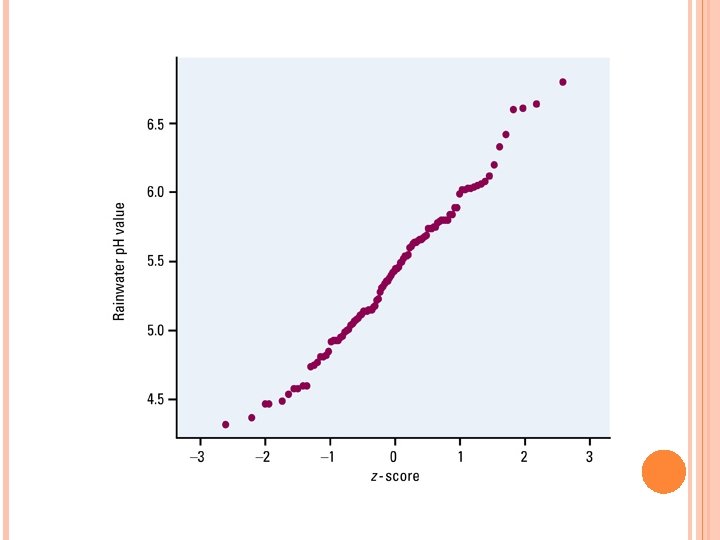
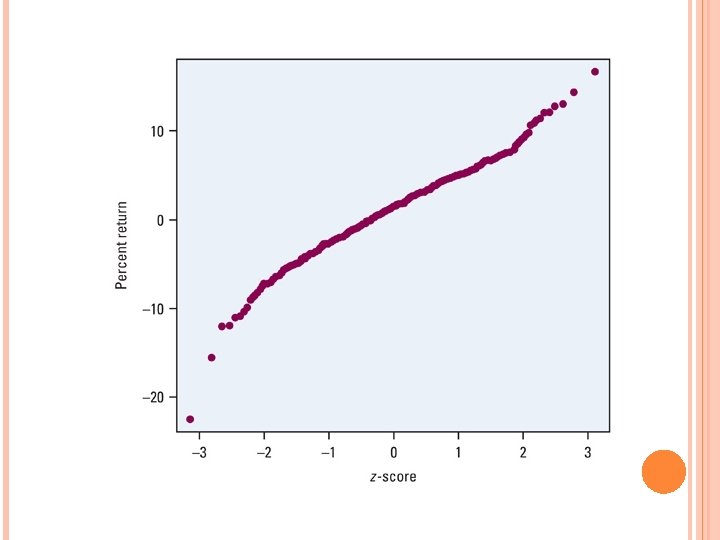
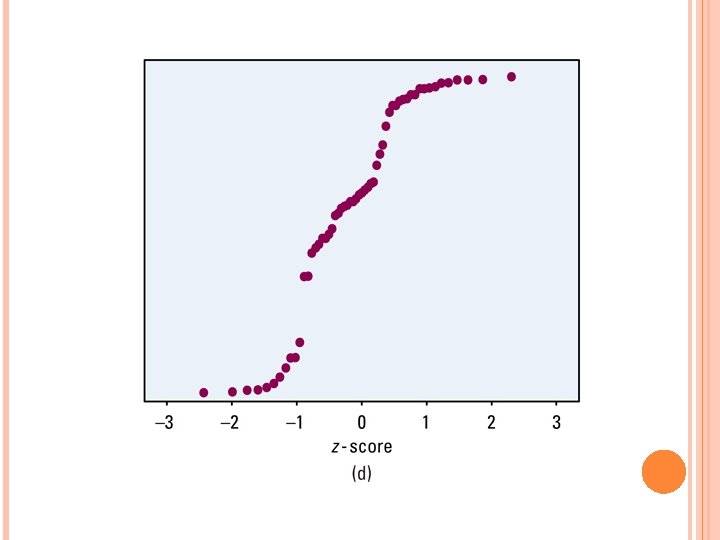
ASSESSING NORMALITY: 2 ways to determine whether if a data set has a normal distribution: Method 1: Draw a histogram bell-shaped, 68 -95 -99. 7 Method 2: Draw a “Normal Probability Plot” (p 149) Arrange the observed data from small big Find the percentile of each observation and then use Table A for the Zscores Plot each observation ‘x’ with it’s Z-score Making Normal Probability Plots on Ti-83 p 153 -154 If the points on a Normal Probability Plot lie close to a straight line, the plot indicates that the data is normal Deviations from a straight line non Normal distribution Outliers will appear from the overall pattern

WHAT IS A NORMAL PROBABILITY PLOT?

HW: 2. 36, 2. 37, 2. 38, 2. 39, 2. 50
- Slides: 21