2 1 Frequency distribution Ogive Example page 44

2. 1 Frequency distribution Ogive

Example: page 44, problem 25 max 60 67 64 71 67 65 69 73 62 72 68 63 61 58 61 min 63 65 50 65 63 66 62 67 69

- range = 73 – 50 = 23 - c. w. = 23 ÷ 6 = 3. 8 → 4 - we will start the setup of the class limits with the minimum data value (50), to which we will add the class width (c. w. ) - these are the lower limits (where each class begins)

Class limits 50 – 54 – 58 – 62 – 66 – 70 – Tally f Class boundary Cumulative freq.
 by subtracting")
- Next we determine the first class’ upper limit (where it ends) by subtracting 1 from the second class’ lower limit - 54 – 1= 53 - then we add again the class width (4) to the upper class’ limits - tally

Class limits Tally f 50 – 53 / 1 54 – 57 0 58 – 61 //// 4 62 – 65 //// 9 //// 66 – 69 //// // 7 70 – 73 /// 3 Class boundary Cumulative freq.

- To find the class boundary we will subtract a half a unit (usually. 5) from the lower class limits and add a half a unit (usually. 5) to the upper class limits

Class limits 50 – 53 Tally f / 54 – 57 58 – 61 Class boundary 1 49. 5 – 53. 5 0 53. 5 – 57. 5 //// 4 57. 5 – 61. 5 62 – 65 //// 9 61. 5 – 65. 5 //// 66 – 69 //// // 7 65. 5 – 69. 5 70 – 73 /// 3 69. 5 – 73. 5 Cumulative freq.

- We obtain the cumulative frequency by adding to the class’ frequency the frequencies of the classes above

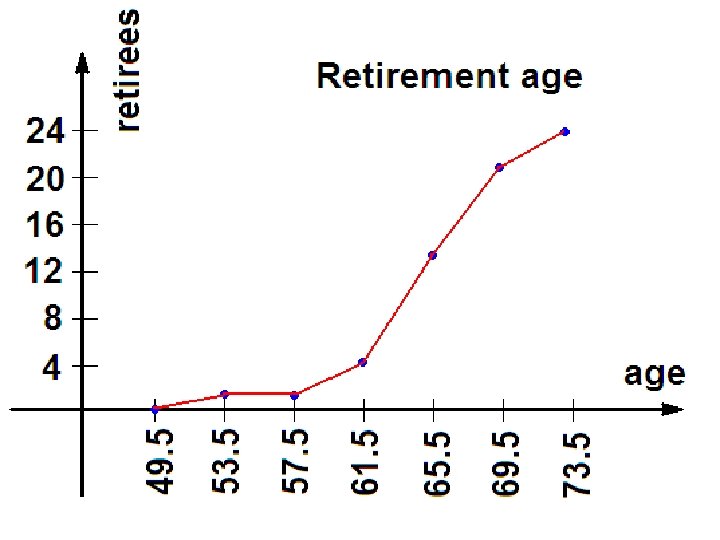
Class limits 50 – 53 Tally f / 54 – 57 58 – 61 //// Class boundary Cumulative freq. 1 49. 5 – 53. 5 1 0 53. 5 – 57. 5 0+1=1 4 57. 5 – 61. 5 4+1=5 62 – 65 //// 9 61. 5 – 65. 5 9 + 5 = 14 //// 66 – 69 //// // 7 65. 5 – 69. 5 7 + 14 = 21 70 – 73 /// 3 69. 5 – 73. 5 3 + 21 = 24
")
OGIVE - Is an open line - Always rises (at least it is horizontal) - On the x-axis: class boundary - On the y-axis: cumulative frequency - Important: label the axis, name your graph
- Slides: 12