1960 1995 Boom Bust and Boom Again The

1960 - 1995

Boom, Bust, and Boom Again

The Golden Years of the 1960 s

US Economy Grows 2%-2. 5% per Year on Average • 6. 1% in 1962 • 4. 4% in 1963 • 5. 8% in 1964 • 6. 4% in 1965 • 6. 5% in 1966

Almost an Entire Decade


Other Economic Factors in the 60 s • Unemployment • Inflation

Dismal Decade of the 1970 s • Recession – December 1969 – November 1970 – November 1973 – March 1975 – January 1980 – June 1980 – July 1981 – November 1982

Unemployment through the Recessions
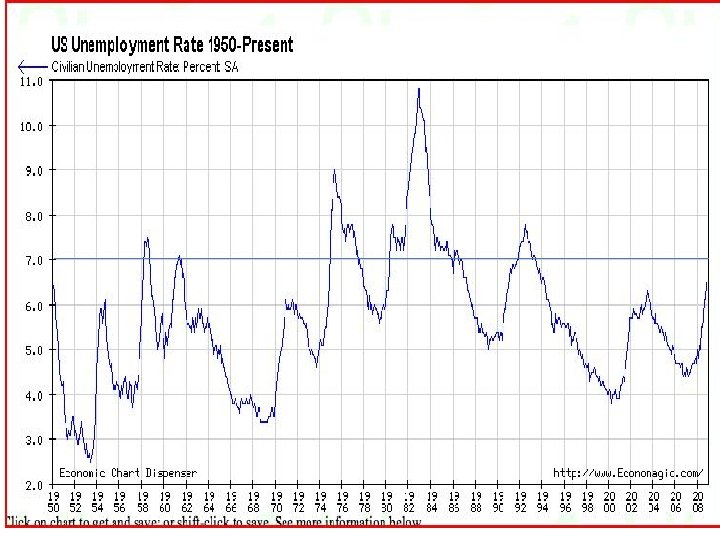

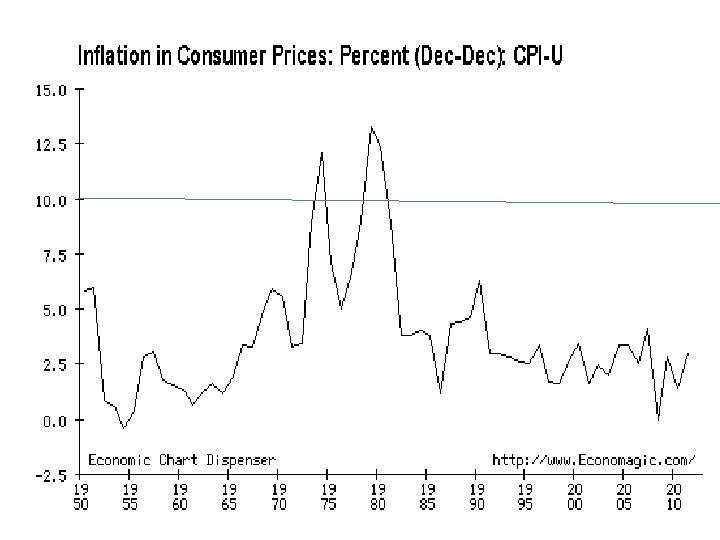
Inflation through the Recessions

Price Controls

Inflation after Price Control

News vs. Economists

Globalization

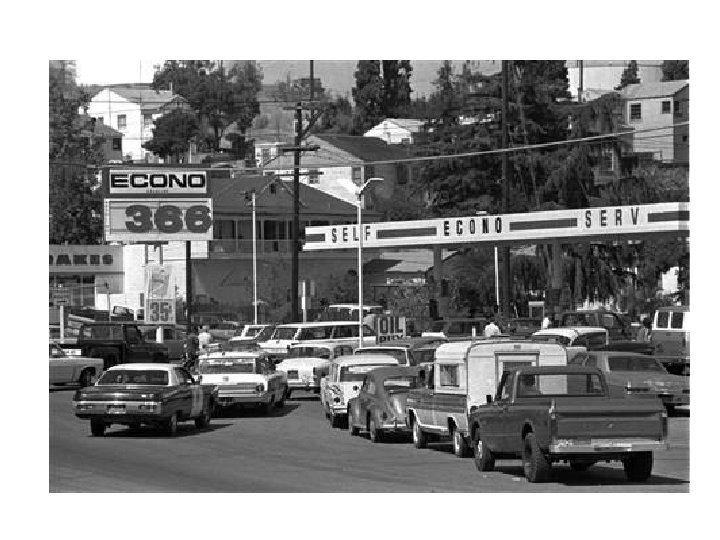
OPEC Oil Embargo

Results of Oil Embargo

Back to the Story

Imports
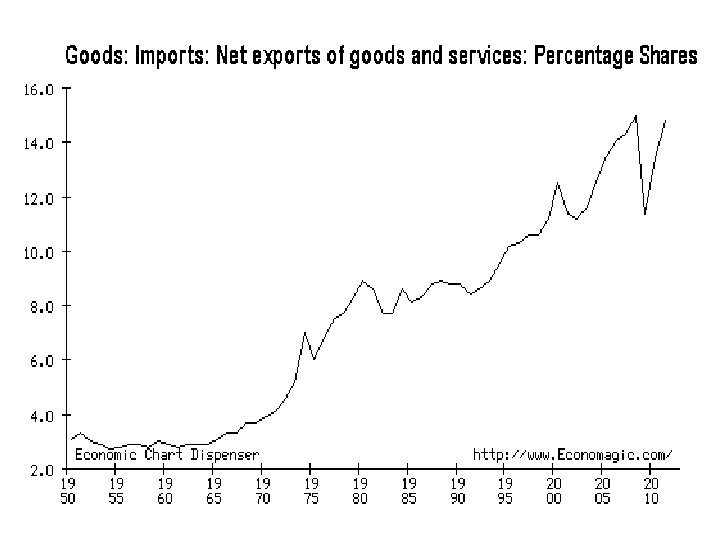

Imports

Worst Problem Productivity Slowdown

Productivity
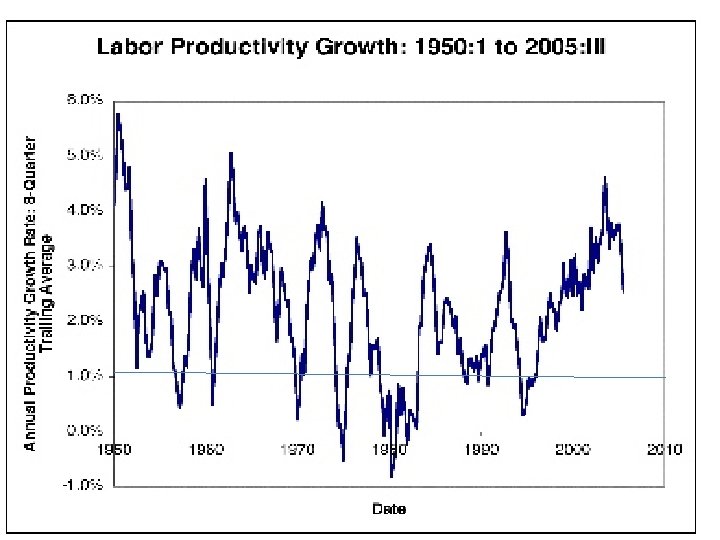

Productivity

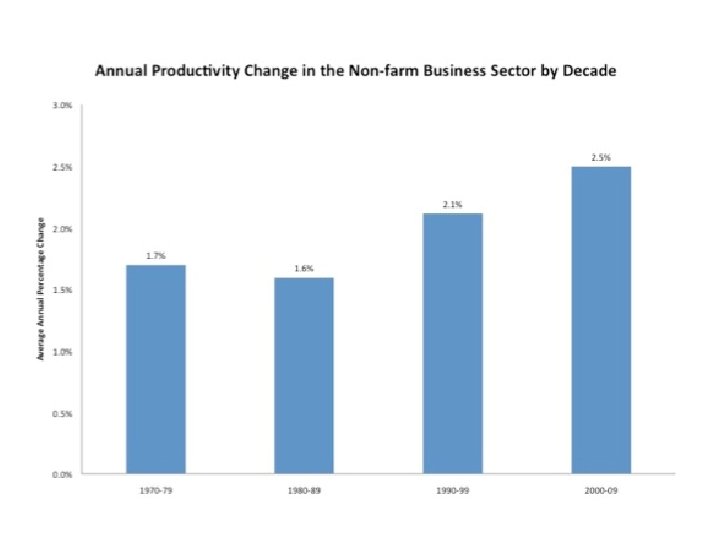
Productivity • 1960 -1964—productivity growth about 3% per year • 1965 -1969—productivity growth slowed to about 2. 4% per year • 1970 -1974—productivity growth slowed to about 2. 0% per year • This continued down until the mid-1980 s and remained low until at least the 1990 s

Productivity • .

Why Did All of This Happen?

What went wrong in the 1970 s • Guns and Butter Story

Here is another one

What went wrong in the 1970 s • Guns and butter story • Oil Prices did it story

What went wrong in the 1970 s • Guns and butter story • Oil Prices did it story • Stop-Go Monetary Policy Story


What went wrong in the 1970 s

What went wrong in the 1970 s

What went wrong in the 1970 s

New Challenges for the 1980 s

New Challenges for the 1980 s

New Challenges for the 1980 s

New Challenges for the 1980 s

New Challenges for the 1980 s and Beyond

Ronald Reagan

Budget Deficits

Budget Deficits

Debt / GDP

Worries in the mid-1980 s

Globalization Continued to be a Fear
- Slides: 52