160 00 Brent Crude Oil Price 140 00


160. 00 Brent Crude Oil Price 140. 00 120. 00 $/barrel 100. 00 80. 00 Nominal Price Real Price 60. 00 40. 00 20. 00 1972 1977 1982 1987 Year 1992 1997 2002 2007

8


Crude Oil Proved reserves of Oil At end 1986 At end 1996 At end 2005 2006 Thousand 1 2 3 4 5 6 7 Saudi Arabia Iran Iraq Kuwait United Arab Emirates Venezuela Russian Federation 8 Libya 9 Kazakhstan 10 Nigeria TOTAL WORLD Canadian oil sands • Proved reserves and oil sands million barrels 169. 7 92. 9 72. 0 94. 5 97. 2 55. 5 n/a million barrels 261. 4 92. 6 112. 0 96. 5 97. 8 72. 7 n/a million barrels 264. 2 137. 5 115. 0 101. 5 97. 8 80. 0 79. 1 million Share barrels of total 264. 3 21. 9% 137. 5 11. 4% 115. 0 9. 5% 101. 5 8. 4% 97. 8 8. 1% 80. 0 6. 6% 79. 5 6. 6% R/P ratio 66. 7 86. 7 * * 90. 2 77. 6 22. 3 22. 8 n/a 16. 1 877. 4 n/a 29. 5 n/a 20. 8 1049. 0 n/a 41. 5 39. 8 36. 2 1209. 5 163. 5 1373. 0 41. 5 3. 4% 39. 8 3. 3% 36. 2 3. 0% 1208. 2 100. 0% 163. 5 1371. 7 61. 9 76. 5 40. 3 40. 5 14

Crude Oil 15

Crude Oil 16

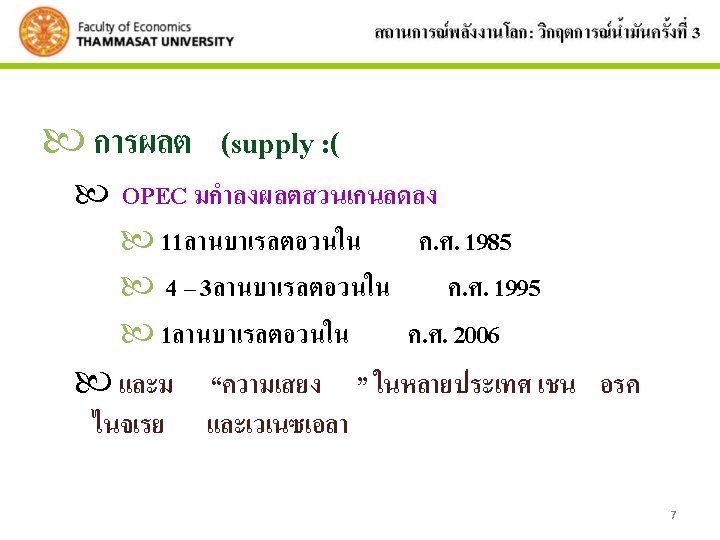
Crude Oil Production Thousand barrels daily 1 Saudi Arabia 2 Russian Federation 3 USA 4 Iran 5 China 6 Mexico 7 Canada 8 United Arab Emirates 9 Venezuela 10 Norway TOTAL WORLD of whi European Union ch: 25 OECD OPEC Non-OPEC‡ Former Soviet Union 2001 2002 2003 2004 2005 9, 209 8, 928 10, 164 10, 638 11, 114 7, 056 7, 698 8, 544 9, 287 9, 552 7, 669 7, 626 7, 400 7, 228 6, 895 3, 794 3, 543 4, 183 4, 248 4, 268 3, 306 3, 346 3, 401 3, 481 3, 627 3, 560 3, 585 3, 789 3, 824 3, 760 2, 677 2, 858 3, 004 3, 085 3, 041 2, 534 2, 324 2, 611 2, 656 2, 751 3, 142 2, 895 2, 554 2, 907 2, 937 3, 418 3, 333 3, 264 3, 188 2, 969 74, 932 74, 496 77, 056 80, 244 81, 250 Change 2006 over share 2006 2005 of total 10, 859 – 2. 3% 13. 1% 9, 769 2. 2% 12. 3% 6, 871 – 0. 5% 8. 0% 4, 343 1. 2% 5. 4% 3, 684 1. 6% 4. 7% 3, 683 – 2. 1% 4. 7% 3, 147 4. 4% 3. 9% 2, 969 7. 3% 3. 5% 2, 824 – 3. 9% 3. 7% 2, 778 – 6. 9% 3. 3% 81, 663 0. 4% 100. 0% 3, 147 3, 203 2, 995 2, 774 2, 535 2, 306 21, 297 21, 422 21, 156 20, 716 19, 825 19, 398 30, 857 29, 031 30, 884 33, 175 34, 068 34, 202 35, 415 35, 933 35, 673 35, 661 35, 343 35, 162 8, 660 9, 533 10, 499 11, 407 11, 840 12, 299 – 9. 0% – 2. 2% 0. 2% – 0. 5% 2. 8% 23. 3% 41. 7% 43. 0% 3. 9% 15. 3%

Crude Oil 18

Natural Gas Proved reserves of Natural Gas 1 Russian Federation 2 Iran 3 Qatar 4 Saudi Arabia 5 United Arab Emirates 6 USA 7 Nigeria 8 Algeria 9 Venezuela 10 Iraq TOTAL WORLD *More than 100 years. †Less than 0. 05. ♦Less than 0. 05%. n/a not available. At end 1986 At end 1996 At end 2005 At end 2006 Trillion cubic metres n/a 47. 66 47. 65 13. 96 23. 00 27. 58 28. 13 4. 44 8. 50 25. 36 4. 02 5. 69 6. 82 7. 07 5. 41 5. 78 6. 07 6. 06 5. 36 4. 66 5. 79 5. 93 2. 40 3. 48 5. 15 5. 21 3. 26 3. 70 4. 50 2. 62 4. 05 4. 32 0. 82 3. 36 3. 17 107. 67 147. 89 180. 20 181. 46 Share of total 26. 3% 15. 5% 14. 0% 3. 9% 3. 3% 2. 9% 2. 5% 2. 4% 1. 7% 100. 0% R/P ratio 77. 8 * * 96. 0 * 11. 3 * 53. 3 * * 63. 3 19

Natural Gas 20

Natural Gas 21

Natural Gas Production Natural Gas Change 2006 over share 2001 2002 2003 2004 2005 2006 2005 of total 1 Billion cubic metres Russian Federation 542. 4 555. 4 578. 6 591. 0 598. 0 612. 1 2. 4% 21. 3% 2 USA 555. 5 536. 0 540. 8 526. 4 511. 8 524. 1 2. 3% 18. 5% 3 Canada 186. 8 187. 8 182. 7 183. 6 185. 9 187. 0 0. 6% 6. 5% 4 Iran 66. 0 75. 0 81. 5 91. 8 100. 9 105. 0 4. 1% 3. 7% 5 Norway 53. 9 65. 5 73. 1 78. 5 85. 0 87. 6 3. 1% 3. 0% 6 Algeria 78. 2 80. 4 82. 8 82. 0 88. 2 84. 5 – 4. 3% 2. 9% 7 United Kingdom 105. 9 103. 6 102. 9 96. 0 87. 5 80. 0 – 8. 6% 2. 8% 8 Indonesia 66. 3 70. 4 72. 8 73. 3 73. 8 74. 0 0. 3% 2. 6% 9 Saudi Arabia 53. 7 56. 7 60. 1 65. 7 71. 2 73. 7 3. 5% 2. 6% 10 Turkmenistan 47. 9 49. 9 55. 1 54. 4 58. 8 62. 2 5. 9% 2. 2% TOTAL WORLD 2482. 1 2524. 6 2614. 3 2703. 1 2779. 8 2865. 3 3. 0% 100. 0%

Natural Gas 23

Coal Proved reserves of coal at end 2006 Million tonnes 1 USA Sub bituminou s and bituminou s and lignite Share Total of total R/P ratio 111, 338 135, 305 246, 643 27. 1% 234 2 Russian Federation 49, 088 107, 922 157, 010 17. 3% * 3 China 62, 200 52, 300 114, 500 12. 6% 48 4 India 90, 085 2, 360 92, 445 10. 2% 207 5 Australia 38, 600 39, 900 78, 500 8. 6% 210 6 South Africa 48, 750 – 48, 750 5. 4% 190 7 Ukraine 16, 274 17, 879 34, 153 3. 8% 424 8 Kazakhstan 28, 151 3, 128 31, 279 3. 4% 325 9 Poland 14, 000 – 14, 000 1. 5% 90 – 10, 113 1. 1% * 478, 771 430, 293 909, 064 100. 0% 147 10 Brazil TOTAL WORLD * Anthracite More than 500 years. ♦Less than 0. 05%. 24

Coal 25

Coal Production Million tonnes oil equivalent 2005 2006 over share 2001 2002 2003 1 China 697. 6 733. 6 871. 9 1012. 1 1119. 8 1212. 3 8. 3% 39. 4% 2 USA 590. 3 570. 1 553. 6 572. 4 580. 2 595. 1 2. 6% 19. 3% 3 India 160. 3 168. 1 175. 9 191. 0 200. 7 209. 7 4. 5% 6. 8% 4 Australia 179. 9 184. 5 190. 1 198. 8 206. 5 203. 1 – 1. 6% 6. 6% 5 South Africa 126. 1 124. 1 137. 2 137. 7 144. 8 5. 1% 4. 7% 6 Russian Federation 122. 6 117. 3 127. 1 131. 7 139. 5 144. 5 3. 6% 4. 7% 7 Indonesia 56. 5 63. 6 70. 3 81. 4 90. 4 119. 9 32. 7% 3. 9% 8 Poland 71. 7 71. 3 71. 4 70. 5 68. 7 67. 0 – 2. 5% 2. 2% 9 Germany 54. 1 55. 0 54. 1 54. 7 53. 2 50. 3 – 5. 5% 1. 6% 10 Kazakhstan 40. 7 37. 8 43. 3 44. 4 44. 2 49. 2 11. 3% 1. 6% TOTAL WORLD 2004 Change 2373. 4 2387. 2 2555. 8 2765. 8 2916. 7 3079. 7 2005 of total 5. 6% 100. 0%

Coal 27

World Energy Consumption 28


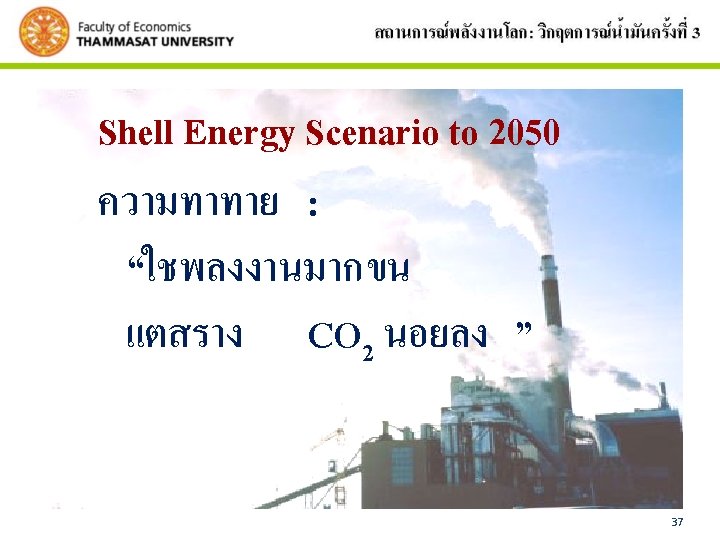


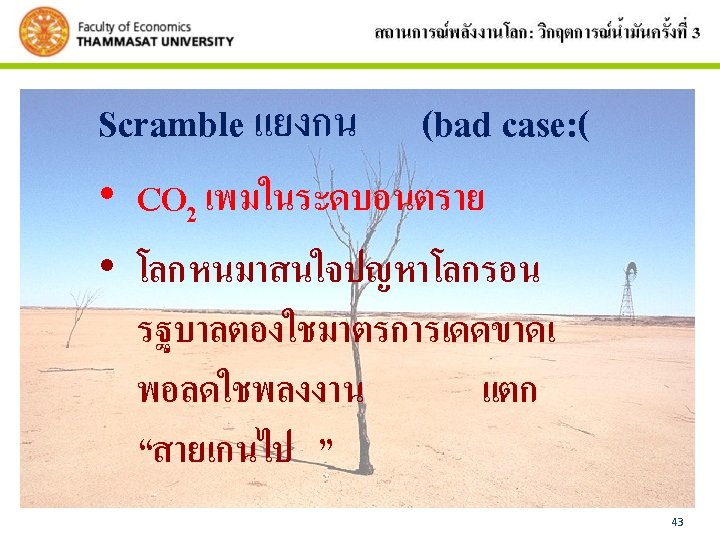
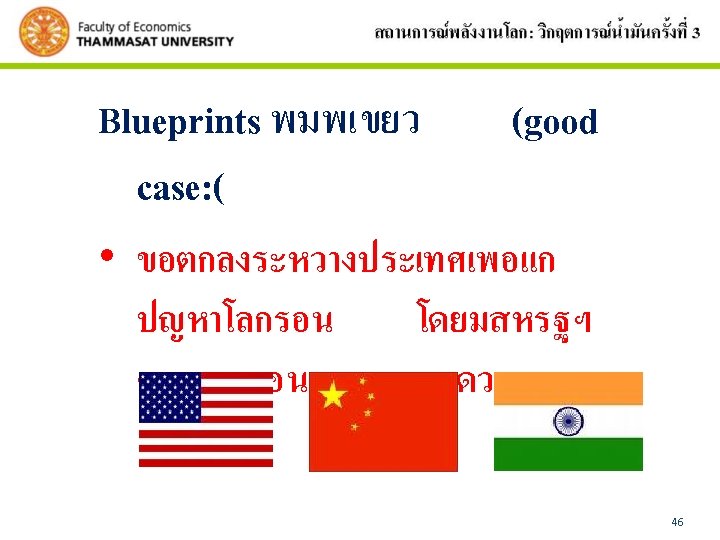
Shell Energy Scenario to 2050 Scenario 2 ชด : • Scramble แยงกน หรอมว (bad case( • Blueprints พมพเขยว วางแผน (good case( 41


Unit: EJ 2000 2020 2050 Scramble Blueprints Oil 147 186 191 141 157 Gas 88 133 139 108 122 Coal 97 199 172 263 208 Nuclear 28 34 30 43 50 Biomass 44 59 52 131 57 Solar 0 2 7 94 74 Wind 0 9 9 36 39 Other Renewables 13 28 29 65 62 Total primary energy 417 650 629 881 769 48

2000 2020 2050 Scramble Blueprints Oil 35% 29% 30% 16% 20% Gas 21% 20% 22% 16% Coal 23% 31% 27% 30% 27% Nuclear 7% 5% 5% 5% 7% Biomass 11% 9% 8% 15% 7% Solar 0% 0% 1% 10% Wind 0% 1% 1% 4% 5% Other Renewables 3% 4% 5% 7% 8% 100% 100%49 Total primary energy

- Slides: 50