
15000 14000 13000 12000 90 of global demand







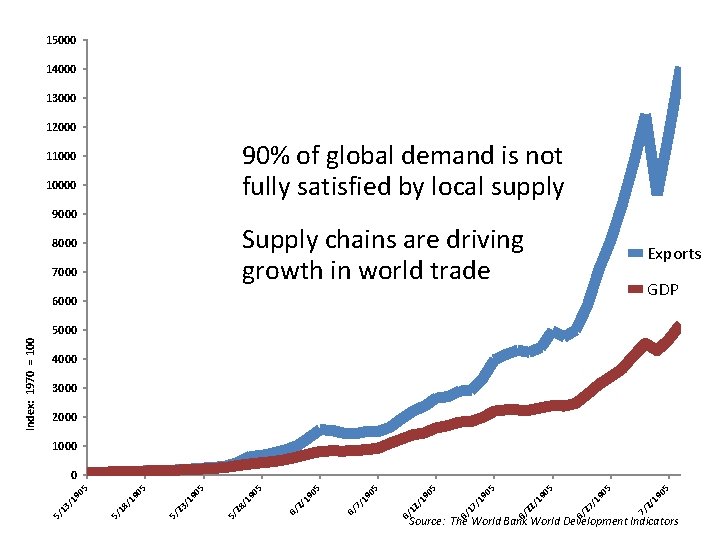
15000 14000 13000 12000 90% of global demand is not fully satisfied by local supply 110000 9000 Supply chains are driving growth in world trade 8000 7000 Exports GDP 6000 4000 3000 2000 19 05 2/ 90 27 /1 6/ 7/ 5 5 6/ 22 /1 90 5 6/ 17 /1 90 5 90 12 /1 6/ 19 05 7/ 6/ 19 05 2/ 6/ 5 5/ 28 /1 90 5 5/ 23 /1 90 90 18 /1 5/ 13 /1 90 5 5 0 5/ Index: 1970 = 100 5000 Source: The World Bank World Development Indicators
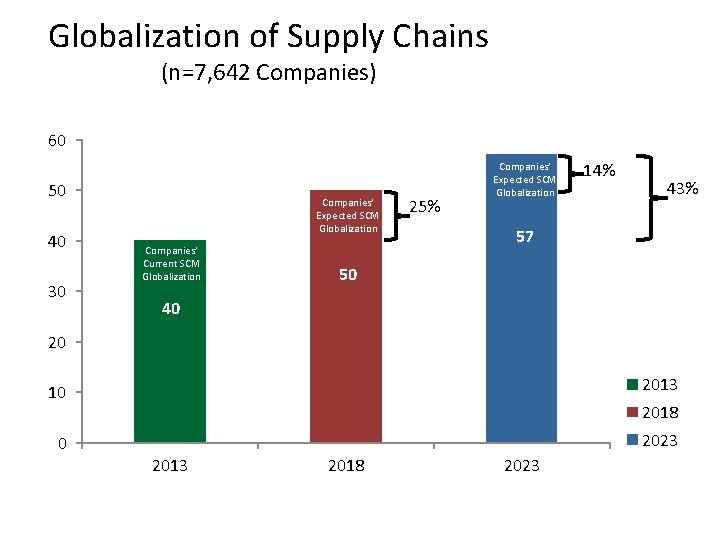
Globalization of Supply Chains (n=7, 642 Companies) 60 50 40 30 Companies’ Expected SCM Globalization Companies’ Current SCM Globalization 25% Companies’ Expected SCM Globalization 14% 43% 57 50 40 20 10 2013 0 2023 2018 2013 2018 2023
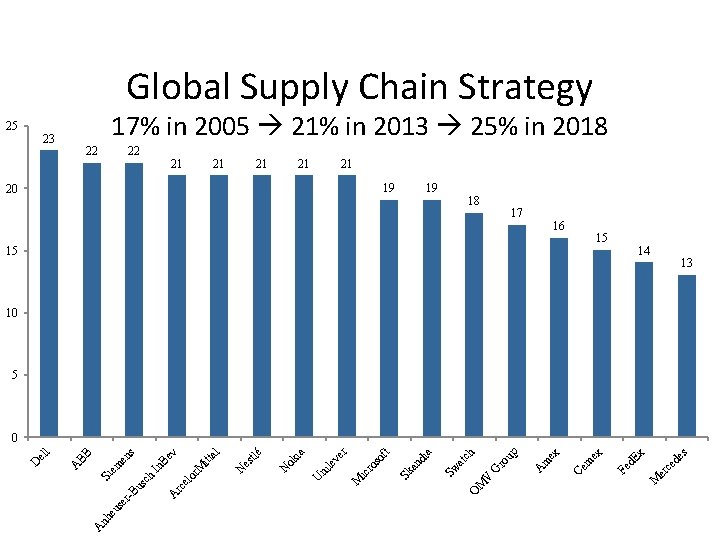
s de ce x 15 M er 15 d. E 16 Fe ex 17 m ex m 18 A up ro G ch at 19 Ce V M O 19 Sw di a an 20 Sk t of os ic r 21 M er le v ni 21 U ia ok 21 N tlé es 21 N l v itt a M or el Be In s 22 rc ch en Si em 22 A us r-B se eu 23 A nh BB 25 A el l D Global Supply Chain Strategy 17% in 2005 21% in 2013 25% in 2018 21 14 13 10 5 0
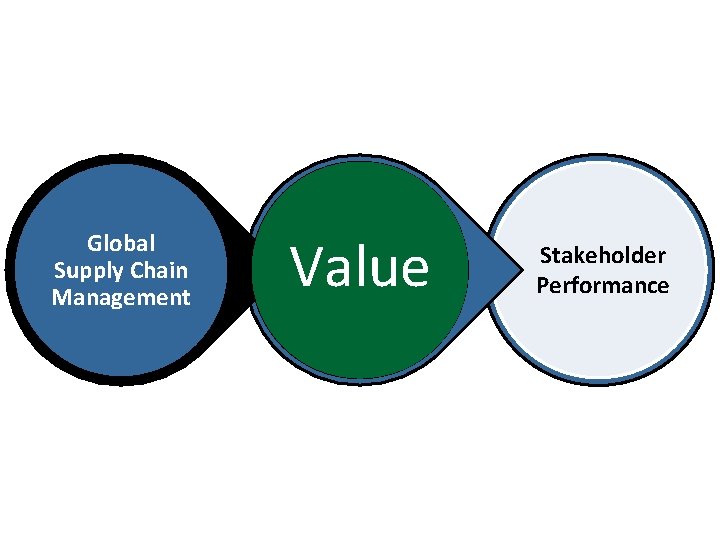
Global Supply Chain Management Conversion (Firm and SBU Activities, Behaviors) Value Stakeholder Performance


Goals of Global SCM Develop and maintain strategic and operational aspects of global supply chains Identify and leverage industry globalization drivers that affect global supply chains Have knowledge of and leverage the worldwide infrastructure for global supply chains Manage coordination and integration of global supply chains
But most importantly, identify leverage points for • Identify leverage points for: – Global logistics in global supply chains – Global purchasing in global supply chains – Global operations in global supply chains – Global market channels in global supply chains
How global is the industry? How global should the firm’s strategy be? How global should the supply chains be?
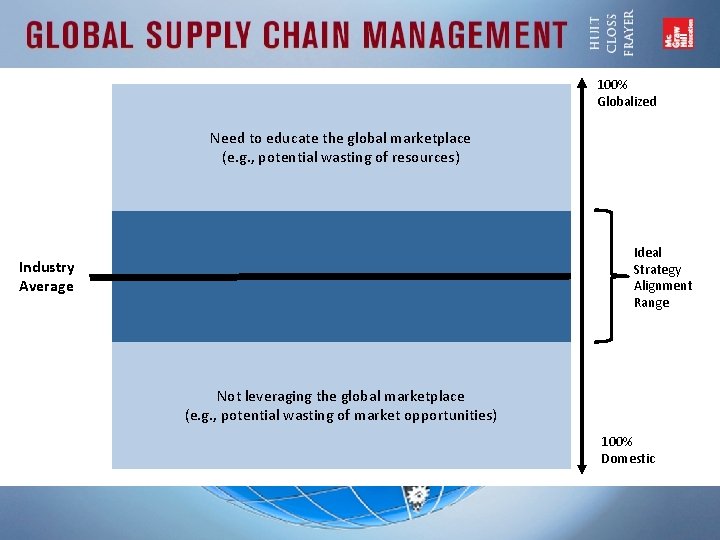
100% Globalized Need to educate the global marketplace (e. g. , potential wasting of resources) Ideal Strategy Alignment Range Industry Average Not leveraging the global marketplace (e. g. , potential wasting of market opportunities) 100% Domestic
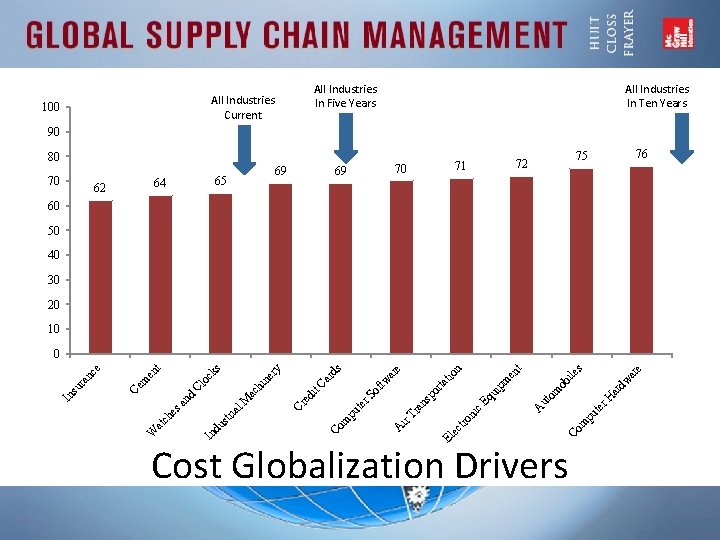
All Industries In Five Years All Industries Current 100 All Industries In Ten Years 90 80 70 62 69 65 64 70 69 76 75 72 71 60 50 40 30 20 10 e s ar ar dw ob r. H om ut pu te A qu c. E m Co El ec tro ni ile en t ip m rta po ns A ir T ra te pu m Co tio tw ar r. S of Ca it ed Cr n e rd s ry ia str du In W at ch es a l. M nd ac hi Cl oc ne ks t en m Ce In su ra nc e 0 Cost Globalization Drivers
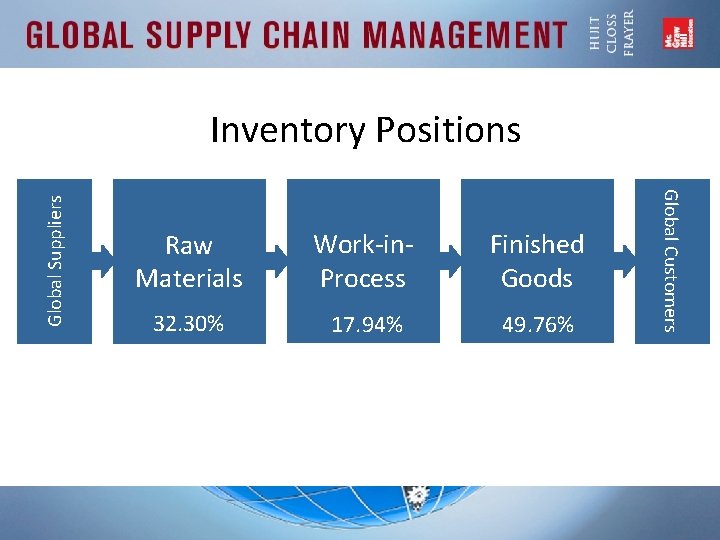
Raw Materials Work-in. Process Finished Goods 32. 30% 17. 94% 49. 76% Global Customers Global Suppliers Inventory Positions
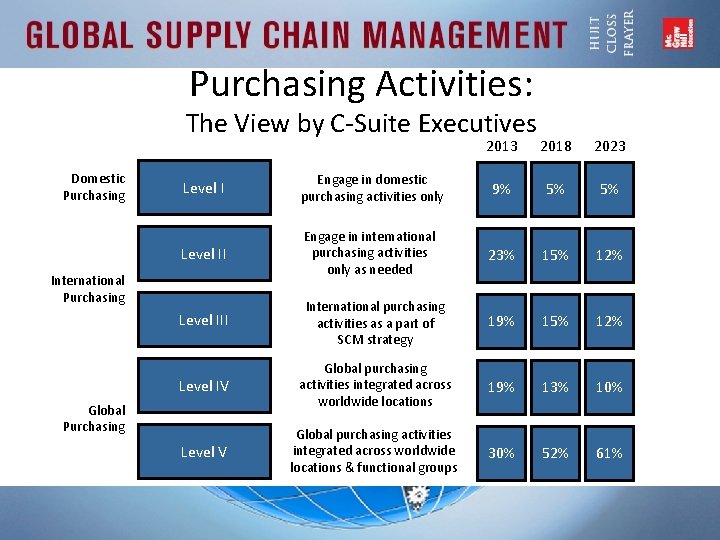
Purchasing Activities: The View by C-Suite Executives Domestic Purchasing 2013 2018 2023 Level I Engage in domestic purchasing activities only 9% 5% 5% Level II Engage in international purchasing activities only as needed 23% 15% 12% Level III International purchasing activities as a part of SCM strategy 19% 15% 12% Level IV Global purchasing activities integrated across worldwide locations 19% 13% 10% Level V Global purchasing activities integrated across worldwide locations & functional groups 30% 52% 61% International Purchasing Global Purchasing
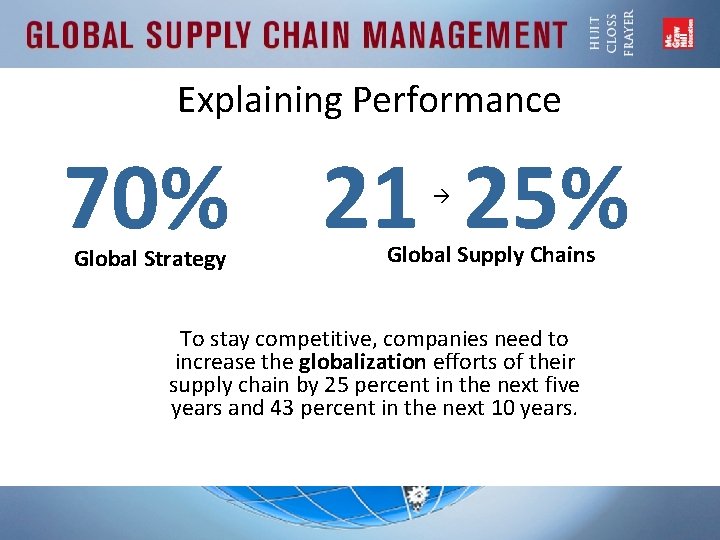
Explaining Performance 70% 21 25% Global Strategy Global Supply Chains To stay competitive, companies need to increase the globalization efforts of their supply chain by 25 percent in the next five years and 43 percent in the next 10 years.
Total Cost Analysis Chain Coordination Strategic Alignment Human Resources

- Slides: 26