150 th New England Electricity Restructuring Roundtable May

150 th New England Electricity Restructuring Roundtable May 18 th, 2016 Thoughts from the MIT’s Utility of the Future Study Prof. Ignacio J. Pérez-Arriaga CEEPR Center for Energy & Environment Policy Research, MIT Institute for Research in Technology, Comillas University

The MIT Utility of the Future Study INFORMATION NOT FOR PUBLIC DISTRIBUTION – CONTAINS PRELIMINARY, UNPUBLISHED RESEARCH RESULTS May 18 th, 2016

This is what Prof. Fred Schweppe anticipated in 1978

What does the MIT study say about how to price renewables? This is a question that a journalist asked me recently. My answer was: “nothing” 4
 if we are technology")
We want to understand what happens (& examine the consequences) if we are technology neutral

Reality requires a change of mentality. . . 6
 & wind (18 GW) covered")
Sunday, August 23 rd, 2015, solar PV (24 GW) & wind (18 GW) covered 42 GW out of the 55 GW of peak demand in Germany, thus more than 75% of demand was covered by intermittent renewables

https: //www. energy-charts. de/power. htm

The presence of DERs is forcing us to abandon the customary “electricity trickling down” mind set…

… & replace it by one where DERs could be on an equal footing with centralized resources in providing services…

… with immediate implications • A new world opens at distribution level • The border meshed/radial becomes most meaningful than T/D • From LMPs to DLMPs? Just DLMPs? • Network-wide cost allocation? & many more issues & questions 11

New technologies are emerging, driven by policy intervention… Market-based mechanisms (auctions, certificates, RPS, etc. ) Feed-in tariffs/ premiums Mixed Auctions or tenders Source: Michael Liebreich, In search of the miracles, Bloomberg 12 New Energy Finance Summit

New technologies are emerging, driven by policy intervention… AND innovation! • Deployment and innovation have created a virtuous cycle that has driven massive cost reductions Source: U. S. DOE, Revolution… Now: The Future Arrives for Five 13 Clean Energy Technologies – 2015 Update

And industry is responding… in BIG ways… Major utility restructurings Major acquisitions and investments Billion dollar companies and bankruptcies 14

… and with countless business models 15

Some say that these changes are massively beneficial… • Solar. City believes distributed solar provides a $1. 4 B per year net benefit to California $1. 4 B in net benefits? Source: Solar. City, A Pathway to the Distributed Grid 16

While others say that these changes are massively detrimental… • The Brattle Group believes distributed solar costs a net $800 M per year to Colorado $800 M in net costs? Source: The Brattle Group, Comparative Generation Costs of Utility- Scale and Residential-Scale PV in Xcel Energy Colorado’ s Service Area 17

Policy and regulation are attempting to respond, but slowly so far… • 42 of 50 U. S. states are taking policy or regulatory action on DERs Source: The 50 States of Solar: A Quarterly Look at America’s Fast-Evolving Distributed Solar Policy Conversation, North Carolina Clean Technology Center 18

… & regulatory action is taking place on both sides of the Atlantic & also everywhere 19

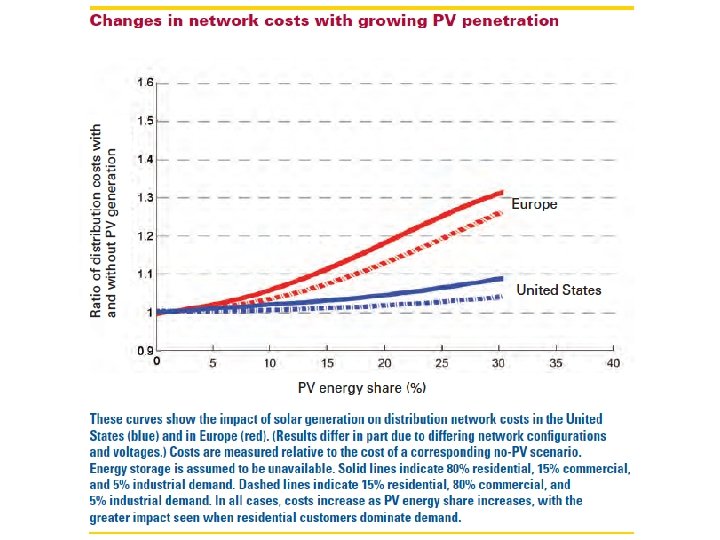
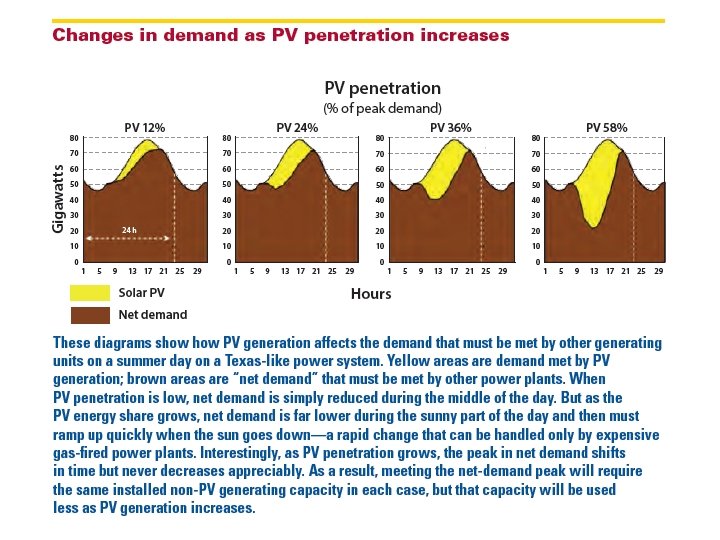
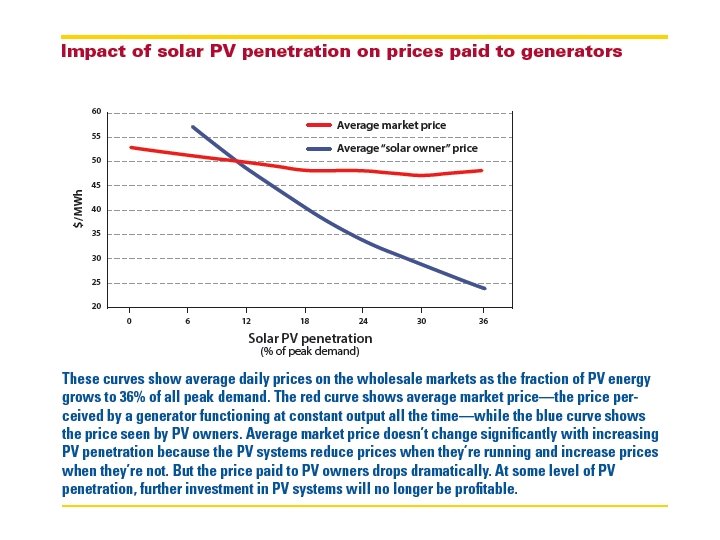
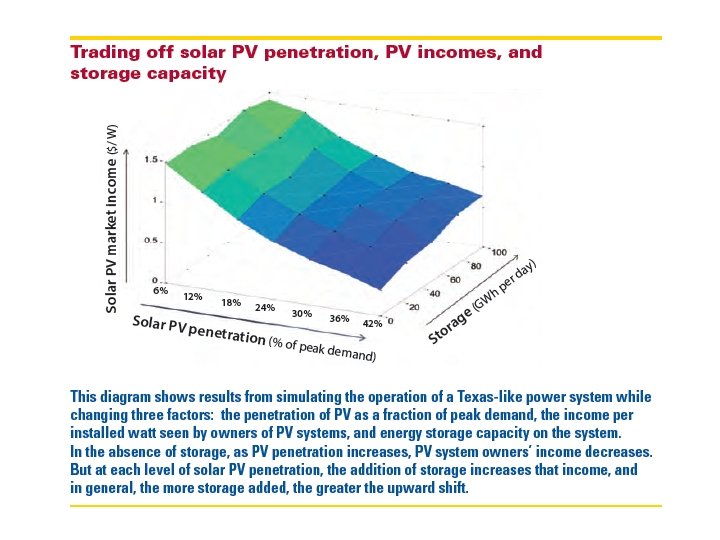
In the MIT Future of Solar study we evaluated the impact of solar PV at bulk & distribution system levels… 20
 Model RNM developed by")
Reference Network Model 3% Penetration Source: MIT Solar Study (*) Model RNM developed by IIT-Comillas University 21

Reference Network Model 8% Penetration Source: MIT Solar Study 22

Reference Network Model 11% Penetration Source: MIT Solar Study

Reference Network Model 14 % Penetration Source: MIT Solar Study 24

Reference Network Model 17% Penetration Source: MIT Solar Study

Reference Network Model 17 Distribution % penetration network reinforcements &their associated costs can be significant Source: MIT Solar Study 26

In the MIT Utility of the Future study we go beyond “impact” & explore “living with a strong presence” of DERs at bulk & distribution system levels… The MIT Utility of the Future Study 31

Examining the DERs – grid interaction

The MIT Utility of the Future study 33
")
Why this MIT study? • There is ample evidence that distributed energy resources (DER) must be taken seriously • There is very high penetration in some systems now, • the power sector believes in & experiences changes • & the regulators promote & are getting ready for these changes 34

Why this MIT study? … but it is uncertain • the economic viability of DER • the extent of their future relevance, • how the power sector would be structured & would function with a large presence of DER • & the regulation that would be needed in a future with DER 35

Implications • Future power systems with DERs may behave differently & have a different mix of technologies • Future electricity services might be provided differently, by new agents with new business models the structure of the power sector may change • Present regulation of markets & networks seems inadequate to deal with a system with DERs • • Barriers impede the full participation of DERs in the provision of services DERs do not receive the right economic signals that allow them to participate efficiently 36
 DERs make economic sense? Any other sense? How")
Questions • Do (any of the) DERs make economic sense? Any other sense? How much penetration of the diverse DERs is economically viable? • What happens in a power system (at distribution & bulk levels) with lots of DERs? • What future mix of centralized & decentralized resources makes economic sense? • How should the regulation of markets & networks be adapted to guide in this situation? 37

Our approach • First, in-depth understanding of the fundamentals… • • Services, prices & charges, trading platforms, evaluation of technologies & business models … while being aware of the present situation of the power sector, under different regulatory frameworks, its shortcomings & any existing trends • Formulation of questions & hypotheses • Then, use computer models to test some of our hypotheses • And finally produce some findings & recommendations 38

The computer models that we have used • Portfolio of models covering the entire power system • • • DR DRE & DER-CAM (price-taker DER optimization) & PEV AG (electric vehicles): Operational RNM (Distribution network planning): Operational D-Sim (Distribution network simulation for DLMP calculation): Development ROM+ (UC & ED with network representation): Operational PSO (UC & ED with network representation): Operational Gen. X (capacity expansion with DERs): Development In development Level of detail of the physical system DR DRE DERCAM PEV AG D-SIM Complete RNM DER ROM+ Dist. PSO Gen. X Trans. 39

Findings & recommendations • Reduce the barriers that impede an efficient & effective DER participation • • • In the remuneration of distribution networks In the wholesale market rules In the structure of the power sector • All resources (including DERs) should be exposed to correct economic signals (prices & charges) • • For the DERs to respond to system conditions For system conditions to depend on DERs response For efficient siting of DERs To prevent inefficient grid defection … & we have proposals on how to do it 40

The barriers 41

DERs participation at distribution level Upgrade regulation of networks to account for new cost drivers & innovation opportunities, & allow DERs to provide network-related services • Make use of state-of-the-art regulatory instruments to remunerate distribution & to promote innovation • Make sure that network charges reflect network reinforcement needs • Facilitate the efficient provision of network services by DERs 42

The primary electricity services Primary Services Energy. Related Network. Related Energy Network Connection Operating Reserves Voltage Control Firm Capacity Constraint Management Black-start Loss Reduction Power Quality

DERs participation in wholesale markets Existing barriers to the participation of DERs in wholesale markets should be removed • Get the time & location prices right • Allow adjustments in market positions while getting closer to real time • Make sure that scarcity situations are duly reflected in prices 44

The power sector structure matters There is much to be learned from the past experience of restructuring at bulk power system level, while being aware of the significant differences between the transmission & distribution worlds • The difficulties & maybe inconvenience in introducing structural changes are acknowledged • There advantages for DERs integration in a structure based on a Distribution Network Owner that is also Distribution System Operator & is fully (i. e. ownership) unbundled from downstream retail & upstream generation market. 45

Technology barriers? How much should the toaster know? Is it worth sending prices & charges to it?

TSO PEX OPERATING RESERVES BLACK START VOLTAGE CONTROL CONGESTION MANAGEMENT ENERGY LOSS REDUCTION FIRM CAPACITY (CRM) ? DSO NETWORK CONNECTION VOLTAGE CONTROL CONGESTION MANAGEMENT ENERGY LOSS REDUCTION ? ? ELECTRIC ENERGY PRICE How to make use of the potential of DERs? METER + ENERGY BOX EMERGENCY LIMIT
 of aggregation?")
What is the value (if any) of aggregation?

Values of aggregation System Value Fundamental Aggregation • Economies of scale • Economies of scope • Risk management • Competition and innovation Transitory Aggregation • Management of complexity • Closing information gaps • Engaging power system agents • Coordinating agents for system operations Opportunistic Aggregation Private Value • Inadequate regulations for procurement of balancing services • Flaws in the allocation of balancing costs • Inefficient locational prices & network charges Today’s regulations Advanced regulations Today’s technology Advanced technology 49

Cyber Security & Resilience Summary No “magic bullet” stops all cyber attacks or incidents or cyber vulnerabilities in Distributed Energy Resources (DERs) Cyber Security Risks are Real and Complex Cyber Standards for Distribution/DERs are needed Information Sharing and Response Plans are needed 50

The economic signals 51

Improve design of prices & charges The design & the level of time & locational differentiation of electricity prices & charges have a substantial impact on the efficiency of DERs response & their impact on networks & centralized generation This also applies to the volume & format of allocation of policy charges in electricity tariffs, which can be a contributing factor to grid defection • Any cost-reflective component of prices & charges should be exclusively based on the individual injection & withdrawal profiles at the network connection point • 52

Improve design of prices & charges All economic consequences for the power system agents must be derived from the individual profile of injections & withdrawals at their connection point (no matter what is behind the meter) 53

Improve design of prices & charges How far to go in time & location differentiation will depend on the tradeoff between loss of efficiency & implementation cost 54

Model #1 to examine tariff design impacts 55

Model #2 to examine tariff design impacts
 Incremental")
Distribution network charges • Network charges DLMP Surplus Total Remaining Network Cost (TRNC) Incremental Network Cost (INC) Residual Network Cost (RNC) DLMPs are used to price energy consumption/ injection at each node. The surplus is used to partially recover part of the network costs. (implicit in energy charge €/k. Wh) Allocate to network users following cost-causality principle €/ k. W (at critical hours) Allocate as a common good (some “Ramsey-like” approach) €/ Network User 57

Policy costs Avoid interference of policy charges on energy & market signals We need to remove them from tariffs &/or be “very creative” Wholesale Networks Other costs Taxes 100% 90% 80% % of electricity bill 70% 60% 50% 40% 30% 20% 10% 0% Brasil Australia Canada -Ontario Texas New York New Jersey Massachussets Maine Connecticut California-Sce UK Spain Netherlands Italy Germany France Belgium Breakdown of residential electricity bills in different jurisdictions in 2014 -2015

Grid defection? Policy & networks costs outweigh energy costs in many countries Wholesale Networks Other costs Taxes 100% 90% 80% % of electricity bill 70% 60% 50% 40% 30% 20% 10% 0% Brasil Australia Canada -Ontario Texas New York New Jersey Massachussets Maine Connecticut California-Sce UK Spain Netherlands Italy Germany France Belgium How these costs are allocated can significantly impact grid defection decisions

Grid defection: The consumers viewpoint Cost / benefit analysis 60

Grid defection: Adding an exit charge Cost / benefit analysis to promote efficient grid defection from the system point of view An exit charge must include the fixed system costs which are not reduced by grid defection 61

Why distributed? • Is there any advantage in being connected in a given voltage level? Even within the same technology? How to evaluate the “locational advantages” versus the economies of sclae? HV MV LV 62

DERs provide locational benefits Locational Power system benefits Other public benefits Non-locational Network capacity Energy Constraint mitigation Firm capacity Loss reduction Operating reserves Voltage control Price suppression Power quality Price hedging Reliability and resiliency Land use Emissions mitigation Employment Energy security 63

Economies of scale in solar PV Trends in the Median Costs of U. S. Solar PV Installations $9, 0 Median Cost in 2014 USD/W-DC $8, 0 $7, 0 $6, 0 $5, 0 $4, 0 $3, 0 $2, 0 $1, 0 $0, 0 2009 2012 Utility scale Large distributed (>500 k. W) 2014 Small distributed (<500 k. W) Sources: MIT Analysis; Barbose et al. (2015). “Tracking the Sun VIII: The Installed Price of Residential and Non-Residential Photovoltaic Systems in the United States. ” LBNL (August, 2015). Bolinger & Seel (2015). “Utility Scale Solar 2014: An Empirical Analysis of Project Cost, Performance, and Pricing Trends in the United States. ” LBNL (September, 2015).

Economies of scale in storage Economies of Scale for Li-Ion Storage Technologies $ 4 500 2013 Cost ($/k. Wh) $ 4 000 $ 3 500 $ 3 000 $ 2 500 $ 2 000 $ 1 500 $ 1 000 $ 500 $- 25 1000 Energy Capacity (k. Wh) Sources: MIT Analysis; Akhil et al. “DOE/EPRI 2013 Electricity Storage Handbook in Collaboration with NRECA”, 2013. 3000

Economic trade-offs in decentralization analysis Locational advantages in the provision of electricity services by DERs in general do not presently outweigh, & are not expected to outweigh with current technologies, the cost reduction brought by economies of scale of more centralized options when they exist (e. g. solar PV or storage) • This fact should be acknowledged by policymakers & the public in general when factoring other considerations in the design of support schemes or in making individual choices of technology adoption 66

In summary… 67

Exploring & using the potential of DERs in buildings, vehicles or as devices connected to the grid, being there for whatever reason, & enabled by ICT, have a wide range of possibilities of providing electricity services in multiple new forms, & should be given the opportunity of doing so The recommendations on prices, charges, network regulation, market rules & sector structure should create the necessary level playing field • But note that the markets for some electricity services may have a small volume & low liquidity • 68

Predicting the future? Rather a tool-kit The Study will provide a toolkit of policy & regulatory measures to facilitate an effective & efficient incorporation of DERs to the future functioning of the power sector, where they can reveal their actual value • Computer simulation & optimization models will be most useful when employed to evaluate the significance & robustness of hypotheses, rather than trying to predict the future under very specific conditions 69

Thank you for your attention 70
- Slides: 70