
150 Remco Chang UCL 16 Big Data Visual
1/50 Remco Chang – UCL 16 Big Data Visual Analytics: A User-Centric Approach Remco Chang Assistant Professor Computer Science Tufts University
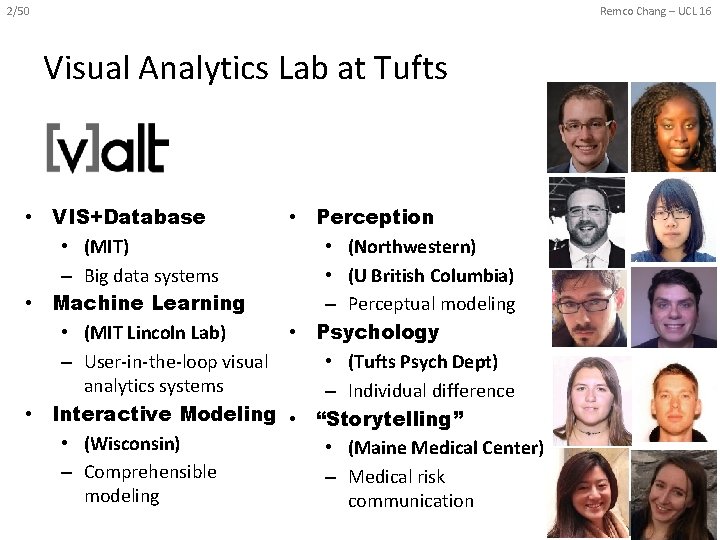
2/50 Remco Chang – UCL 16 Visual Analytics Lab at Tufts • VIS+Database • Perception • (MIT) • (Northwestern) – Big data systems • (U British Columbia) – Perceptual modeling • Machine Learning • (MIT Lincoln Lab) • Psychology – User-in-the-loop visual • (Tufts Psych Dept) analytics systems – Individual difference • Interactive Modeling • “Storytelling” • (Wisconsin) • (Maine Medical Center) – Comprehensible – Medical risk modeling communication

3/50 Remco Chang – UCL 16 Financial Fraud – A Case Study for Visual Analytics
4/50 Remco Chang – UCL 16 Example: What Does (Wire) Fraud Look Like? • Financial Institutions like Bank of America have legal responsibilities to report all suspicious wire transaction activities (money laundering, supporting terrorist activities, etc) • Data size: approximately 200, 000 transactions per day (73 million transactions per year) • Problems: – Automated approach can only detect known patterns – Bad guys are smart: patterns are constantly changing – Data is messy: lack of international standards resulting in ambiguous data • Previous methods: – 10 analysts monitoring and analyzing all transactions – Using SQL queries and spreadsheet-like interfaces – Limited time scale (2 weeks)
5/50 Remco Chang – UCL 16 Wire. Vis: Financial Fraud Analysis • In collaboration with Bank of America – Develop a visual analytical tool (Wire. Vis) – Visualizes 7 million transactions over 1 year • A great problem for visual analytics: – Ill-defined problem (how does one define fraud? ) – Limited or no training data (patterns keep changing) – Requires human judgment in the end (involves law enforcement agencies) R. Chang et al. , Scalable and interactive visual analysis of financial wire transactions for fraud detection. Information Visualization, 2008. R. Chang et al. , Wirevis: Visualization of categorical, time-varying data from financial transactions. IEEE VAST, 2007.
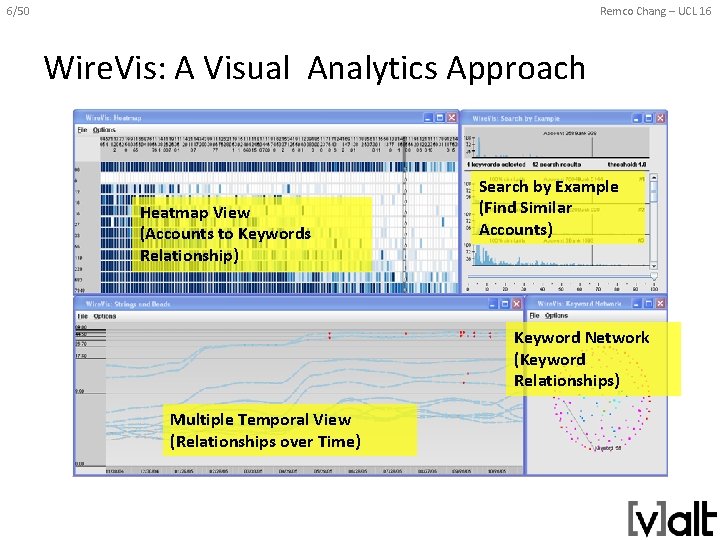
6/50 Remco Chang – UCL 16 Wire. Vis: A Visual Analytics Approach Heatmap View (Accounts to Keywords Relationship) Search by Example (Find Similar Accounts) Keyword Network (Keyword Relationships) Multiple Temporal View (Relationships over Time)
7/50 Remco Chang – UCL 16 Evaluation • Challenging – lack of ground truth • Two types of evaluations: – Grounded Evaluation: real fraud analysts, real data • Find transactions that existing techniques can find • Find new transactions that appear suspicious – Controlled Evaluation: real financial analysts, synthetic data • Find all injected threat scenarios • Adoption and Deployment
8/50 Remco Chang – UCL 16 Good Lessons Learned • Similar to what Profs Blake and Hand mentioned: – 90% of time on Exploratory Data Analysis (EDA) – 10% on confirmation (CDA) • Big data analysis == fast hypothesis testing • High Interactivity is key – Users can wait to find the exact answer
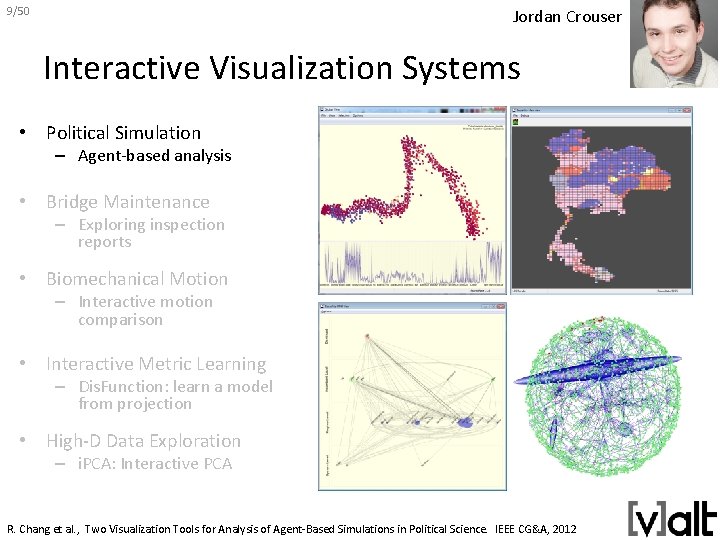
9/50 Remco Chang – UCL 16 Jordan Crouser Interactive Visualization Systems • Political Simulation – Agent-based analysis • Bridge Maintenance – Exploring inspection reports • Biomechanical Motion – Interactive motion comparison • Interactive Metric Learning – Dis. Function: learn a model from projection • High-D Data Exploration – i. PCA: Interactive PCA R. Chang et al. , Two Visualization Tools for Analysis of Agent-Based Simulations in Political Science. IEEE CG&A, 2012
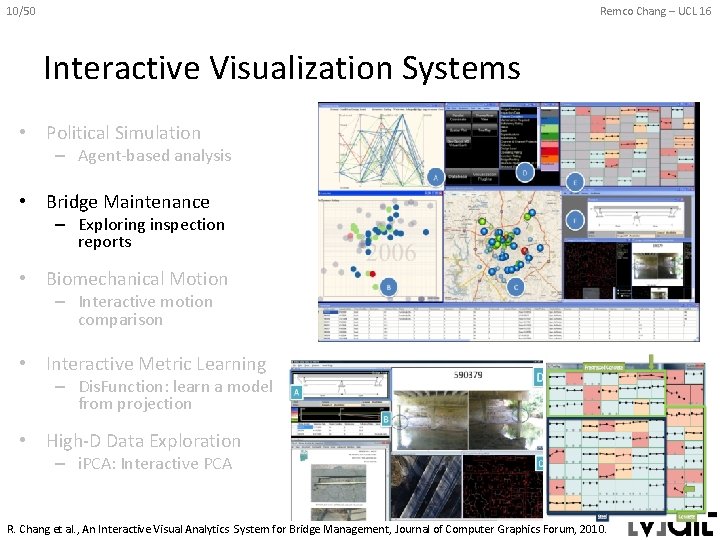
10/50 Remco Chang – UCL 16 Interactive Visualization Systems • Political Simulation – Agent-based analysis • Bridge Maintenance – Exploring inspection reports • Biomechanical Motion – Interactive motion comparison • Interactive Metric Learning – Dis. Function: learn a model from projection • High-D Data Exploration – i. PCA: Interactive PCA R. Chang et al. , An Interactive Visual Analytics System for Bridge Management, Journal of Computer Graphics Forum, 2010.
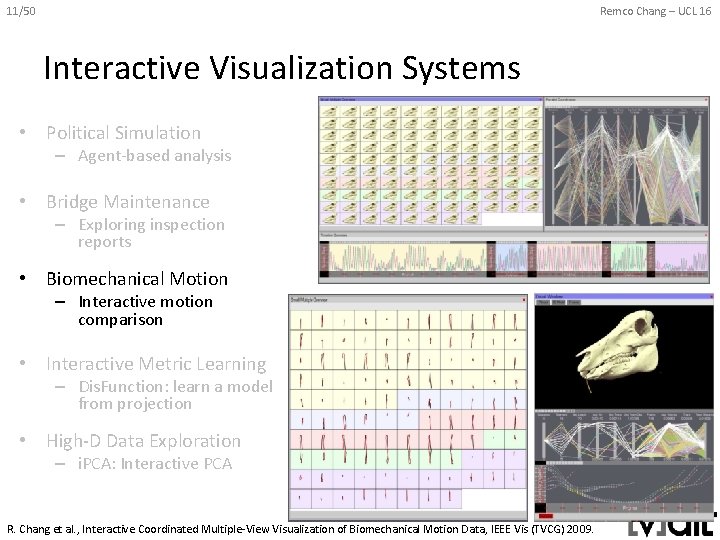
11/50 Remco Chang – UCL 16 Interactive Visualization Systems • Political Simulation – Agent-based analysis • Bridge Maintenance – Exploring inspection reports • Biomechanical Motion – Interactive motion comparison • Interactive Metric Learning – Dis. Function: learn a model from projection • High-D Data Exploration – i. PCA: Interactive PCA R. Chang et al. , Interactive Coordinated Multiple-View Visualization of Biomechanical Motion Data, IEEE Vis (TVCG) 2009.
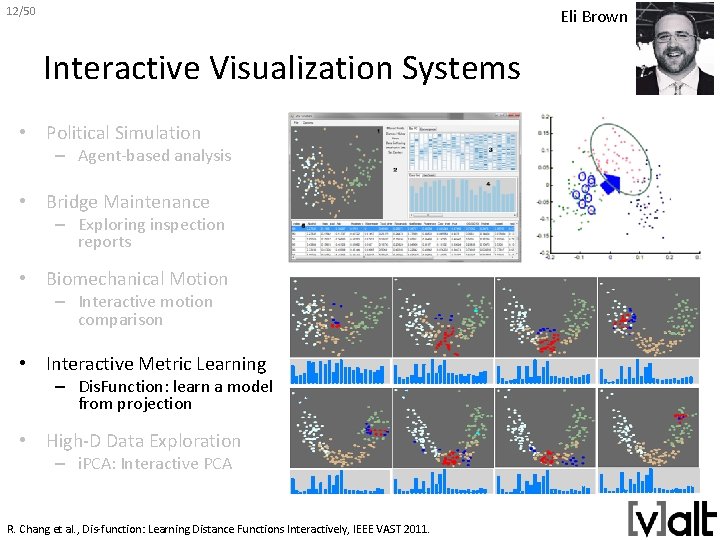
12/50 Remco Chang – UCL 16 Eli Brown Interactive Visualization Systems • Political Simulation – Agent-based analysis • Bridge Maintenance – Exploring inspection reports • Biomechanical Motion – Interactive motion comparison • Interactive Metric Learning – Dis. Function: learn a model from projection • High-D Data Exploration – i. PCA: Interactive PCA R. Chang et al. , Dis-function: Learning Distance Functions Interactively, IEEE VAST 2011.
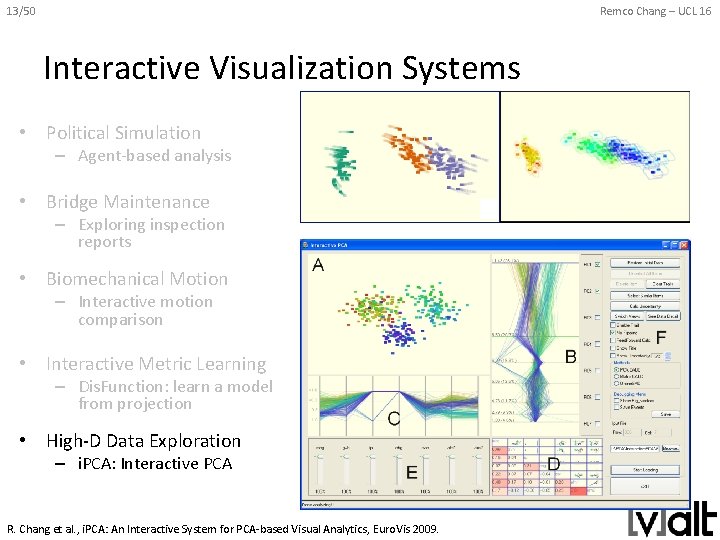
13/50 Remco Chang – UCL 16 Interactive Visualization Systems • Political Simulation – Agent-based analysis • Bridge Maintenance – Exploring inspection reports • Biomechanical Motion – Interactive motion comparison • Interactive Metric Learning – Dis. Function: learn a model from projection • High-D Data Exploration – i. PCA: Interactive PCA R. Chang et al. , i. PCA: An Interactive System for PCA-based Visual Analytics, Euro. Vis 2009.
14/50 Remco Chang – UCL 16
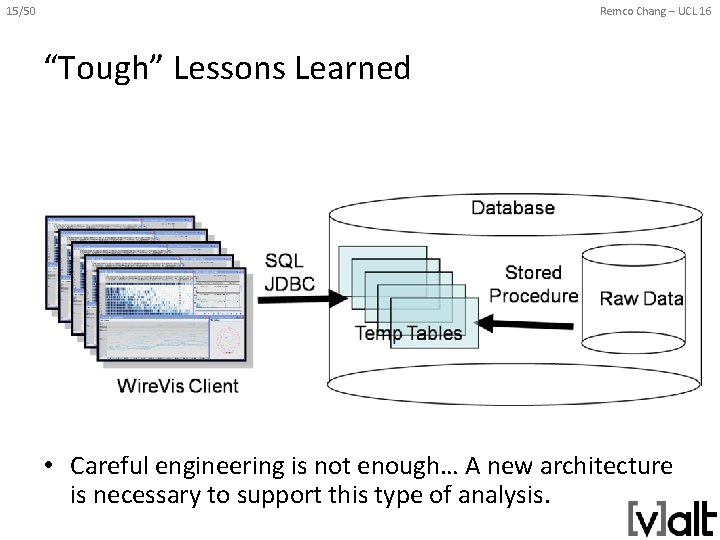
15/50 Remco Chang – UCL 16 “Tough” Lessons Learned • Careful engineering is not enough… A new architecture is necessary to support this type of analysis.
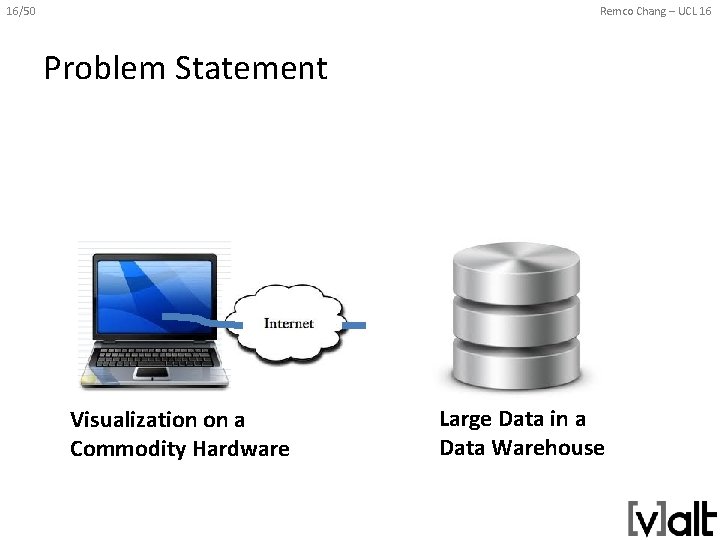
16/50 Remco Chang – UCL 16 Problem Statement Visualization on a Commodity Hardware Large Data in a Data Warehouse
17/50 Remco Chang – UCL 16 Related Work (see the DISA workshop proceeding) • Specialized Pull-based Databases – Tableau, Spotfire • Pre-compiled Data Cubes – Nanocube (Scheidegger), im. Mens** (Liu, Heer), Map-D** (Mostak) • Sampling – Blink. DB (Agrawal, Berkeley), DICE (Kamat, Nandi) • Pre-Fetching – Xmdv (Doshi, Ward), Time-series (Chan, Hanrahan), Query prediction (Cetintemel, Zdonik) • Others – Streaming (Fisher), Optimization (Wu) ** GPU-accelerated
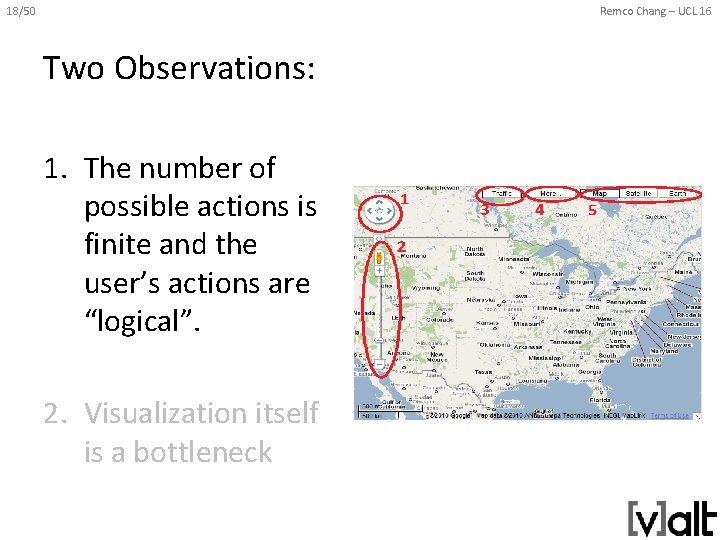
18/50 Remco Chang – UCL 16 Two Observations: 1. The number of possible actions is finite and the user’s actions are “logical”. 2. Visualization itself is a bottleneck
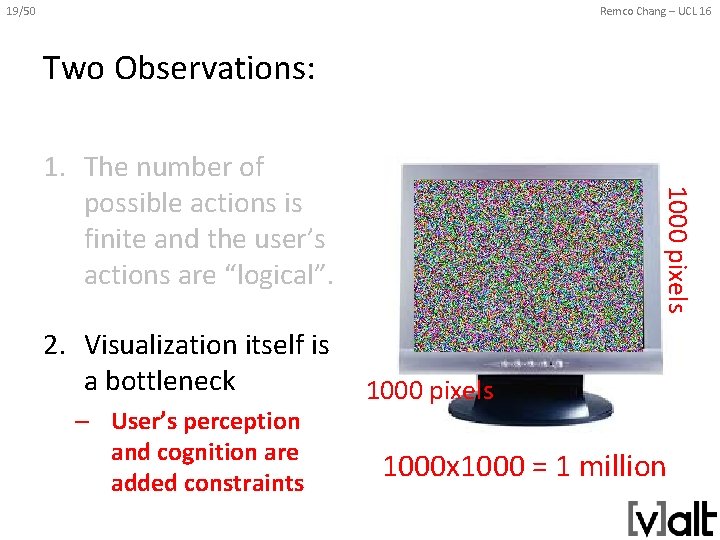
19/50 Remco Chang – UCL 16 Two Observations: 2. Visualization itself is a bottleneck – User’s perception and cognition are added constraints 1000 pixels 1. The number of possible actions is finite and the user’s actions are “logical”. 1000 pixels 1000 x 1000 = 1 million
20/50 Remco Chang – UCL 16 Problem Statement • Problem: Data is too big to fit into the memory of the personal computer – Note: Ignoring various database technologies (OLAP, Column-Store, No-SQL, Array-Based, etc) • Goal: Guarantee a result set to a user’s query within X number of seconds. – Based on HCI research, the upperbound for X is 10 seconds – Ideally, we would like to get it down to 1 second or less • Method: trading accuracy and storage (caching), optimize on minimizing latency (user wait time).
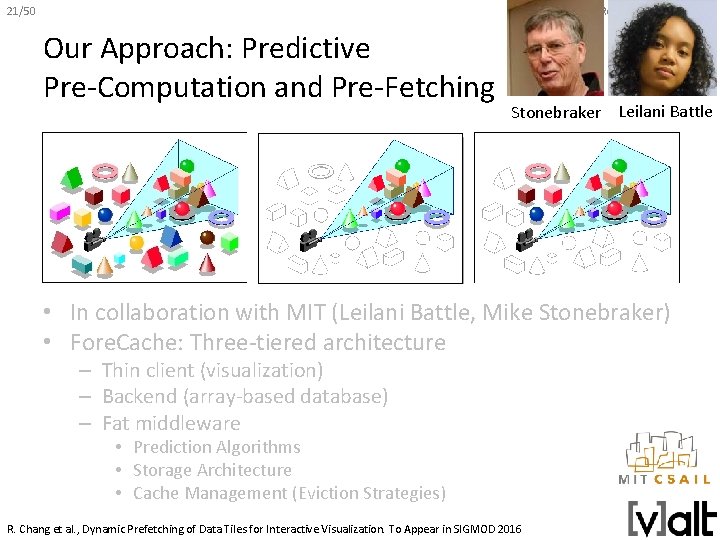
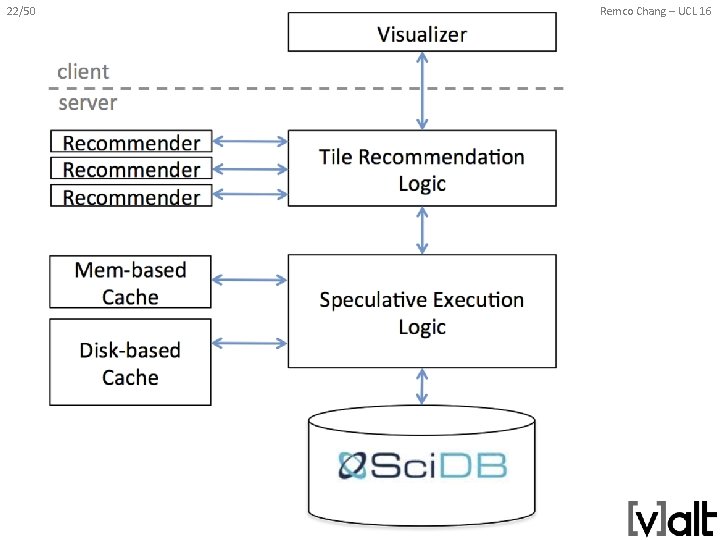
21/50 Remco Chang – UCL 16 Our Approach: Predictive Pre-Computation and Pre-Fetching Stonebraker Leilani Battle • In collaboration with MIT (Leilani Battle, Mike Stonebraker) • Fore. Cache: Three-tiered architecture – Thin client (visualization) – Backend (array-based database) – Fat middleware • Prediction Algorithms • Storage Architecture • Cache Management (Eviction Strategies) R. Chang et al. , Dynamic Prefetching of Data Tiles for Interactive Visualization. To Appear in SIGMOD 2016
22/50 Remco Chang – UCL 16
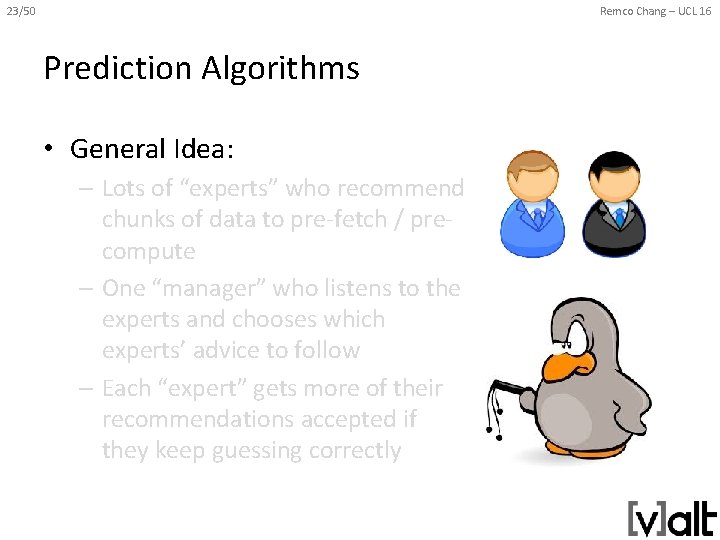
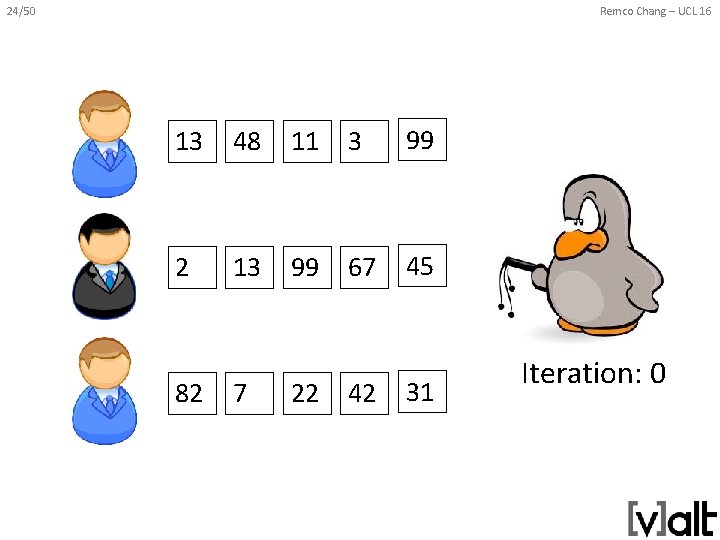
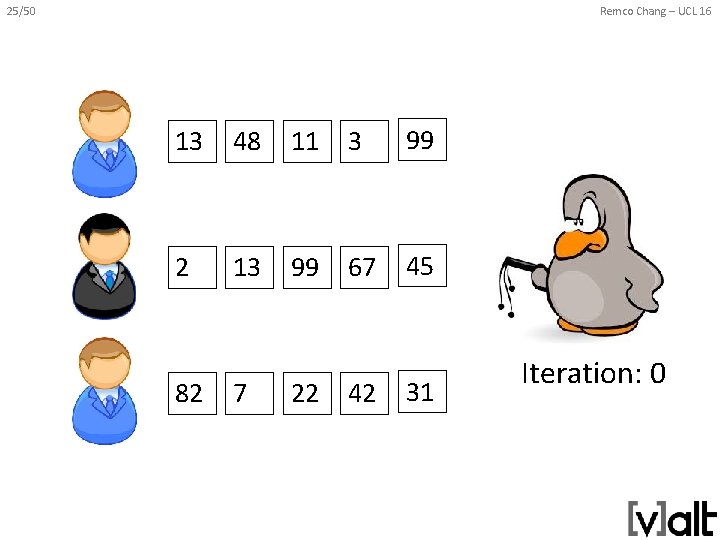
23/50 Remco Chang – UCL 16 Prediction Algorithms • General Idea: – Lots of “experts” who recommend chunks of data to pre-fetch / precompute – One “manager” who listens to the experts and chooses which experts’ advice to follow – Each “expert” gets more of their recommendations accepted if they keep guessing correctly
24/50 Remco Chang – UCL 16 13 48 11 3 99 2 13 99 67 45 82 7 22 42 31 Iteration: 0
25/50 Remco Chang – UCL 16 13 48 11 3 99 2 13 99 67 45 82 7 22 42 31 Iteration: 0
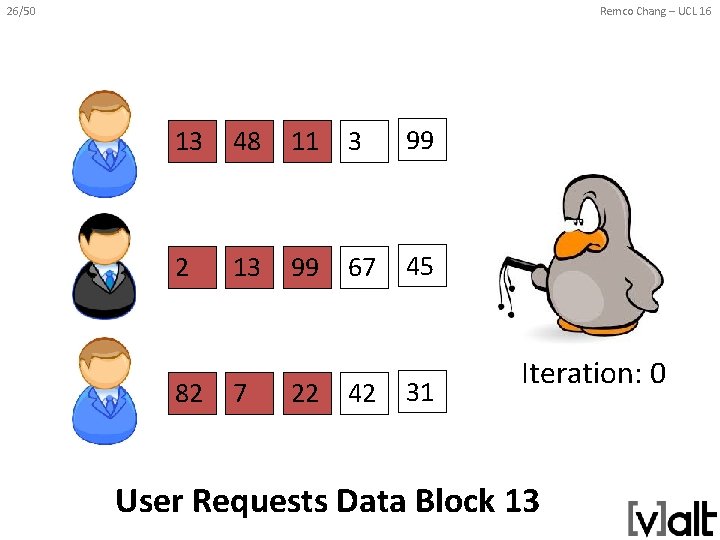
26/50 Remco Chang – UCL 16 13 48 11 3 99 2 13 99 67 45 82 7 22 42 31 Iteration: 0 User Requests Data Block 13
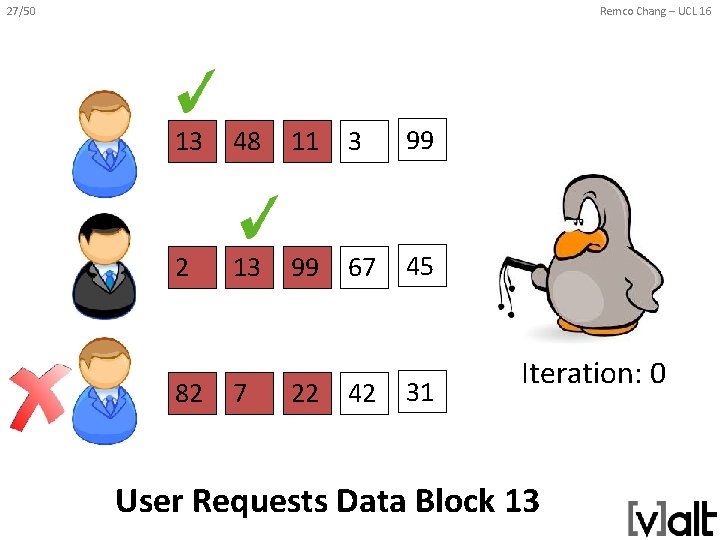
27/50 Remco Chang – UCL 16 13 48 11 3 99 2 13 99 67 45 82 7 22 42 31 Iteration: 0 User Requests Data Block 13
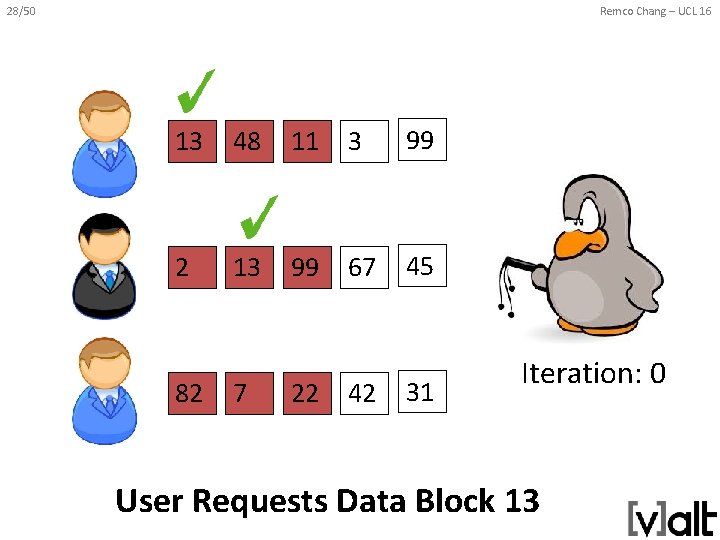
28/50 Remco Chang – UCL 16 13 48 11 3 99 2 13 99 67 45 82 7 22 42 31 Iteration: 0 User Requests Data Block 13
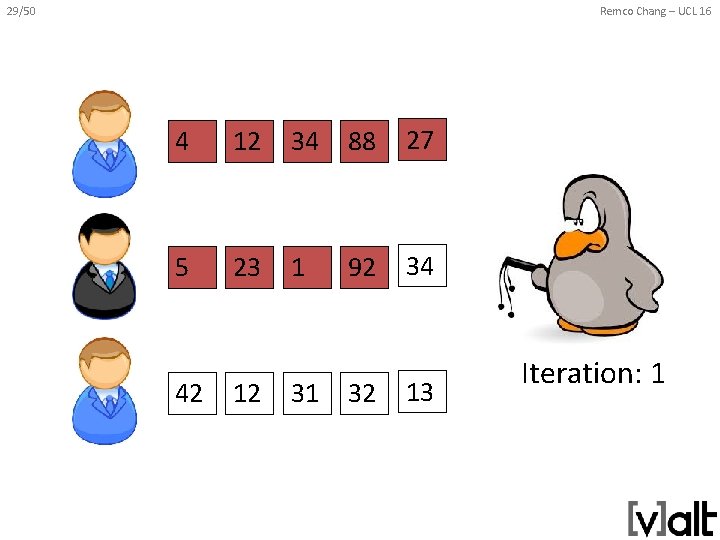
29/50 Remco Chang – UCL 16 4 12 34 88 27 5 23 1 92 34 42 12 31 32 13 Iteration: 1
30/50 Remco Chang – UCL 16 Training and Determining “Experts” • Instead of training the manager in real-time, this process can be done offline – Using past user interaction logs • On choosing Experts, some obvious ones include: – – Momentum-based Data similarity-based Frequency (hot-spot)-based Past action sequence-based • Generally speaking, given the “manager” approach, we want as many different types of “experts” as possible
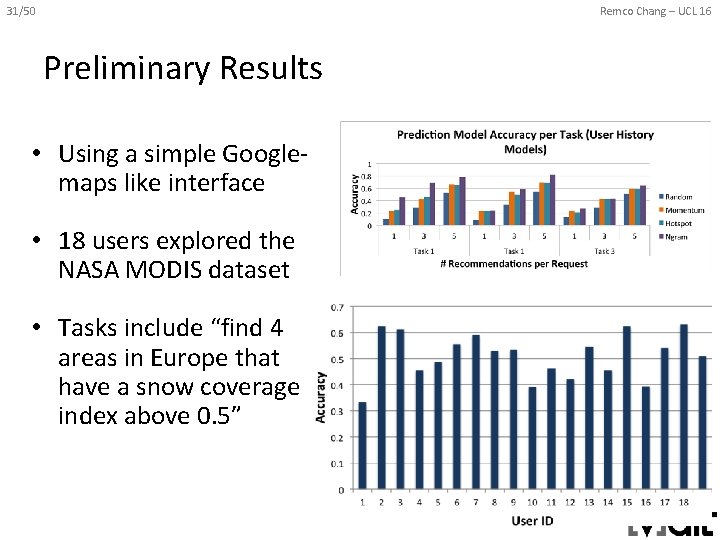
31/50 Remco Chang – UCL 16 Preliminary Results • Using a simple Googlemaps like interface • 18 users explored the NASA MODIS dataset • Tasks include “find 4 areas in Europe that have a snow coverage index above 0. 5”
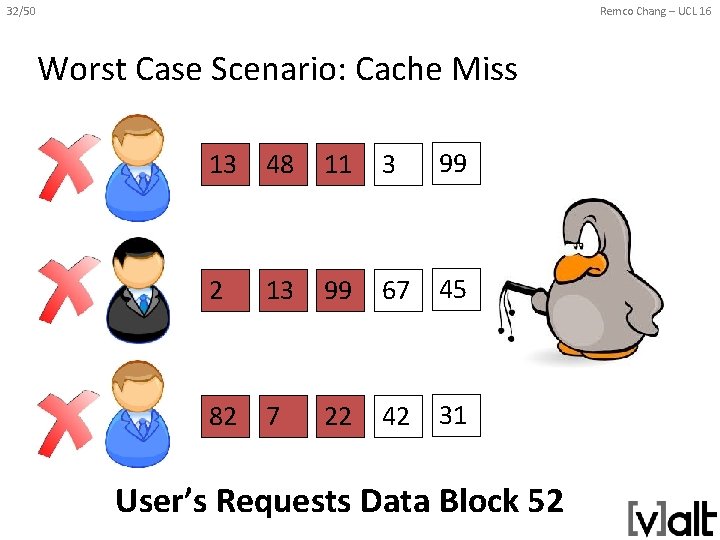
32/50 Remco Chang – UCL 16 Worst Case Scenario: Cache Miss 13 48 11 3 99 2 13 99 67 45 82 7 22 42 31 User’s Requests Data Block 52
33/50 Remco Chang – UCL 16 Cache Miss Stonebraker Leilani Battle • How to guarantee response time when there’s a cache miss? • Trick: the ‘EXPLAIN’ command • Usage: explain select * from my. Table; • Middleware “intercepts” a query from the client, and first asks for an “explain” – If “ok” with explain result, execute the original query – If “not ok”, modify the query dynamically R. Chang et al. , Dynamic Reduction of Result Sets for Interactive Visualization, IEEE Big Data Workshop on Visualization, 2013.
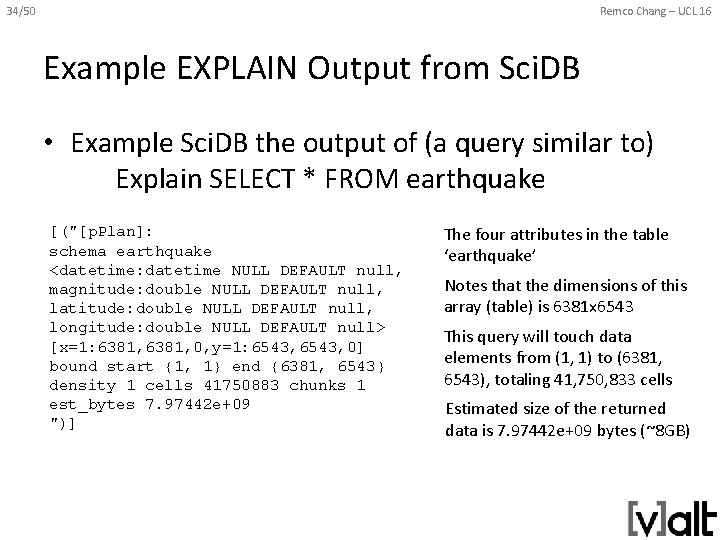
34/50 Remco Chang – UCL 16 Example EXPLAIN Output from Sci. DB • Example Sci. DB the output of (a query similar to) Explain SELECT * FROM earthquake [("[p. Plan]: schema earthquake <datetime: datetime NULL DEFAULT null, magnitude: double NULL DEFAULT null, latitude: double NULL DEFAULT null, longitude: double NULL DEFAULT null> [x=1: 6381, 0, y=1: 6543, 0] bound start {1, 1} end {6381, 6543} density 1 cells 41750883 chunks 1 est_bytes 7. 97442 e+09 ")] The four attributes in the table ‘earthquake’ Notes that the dimensions of this array (table) is 6381 x 6543 This query will touch data elements from (1, 1) to (6381, 6543), totaling 41, 750, 833 cells Estimated size of the returned data is 7. 97442 e+09 bytes (~8 GB)
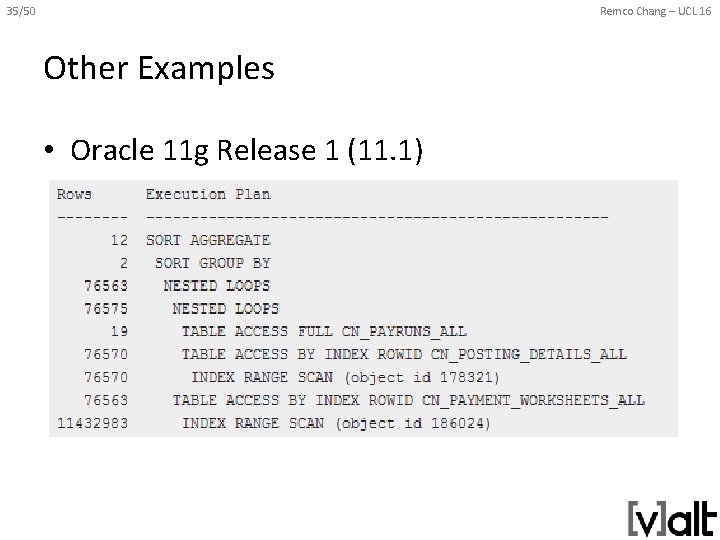
35/50 Remco Chang – UCL 16 Other Examples • Oracle 11 g Release 1 (11. 1)
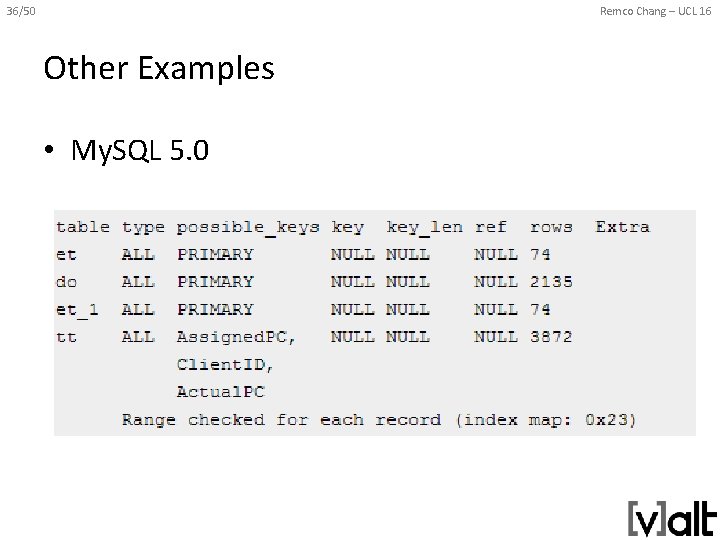
36/50 Remco Chang – UCL 16 Other Examples • My. SQL 5. 0
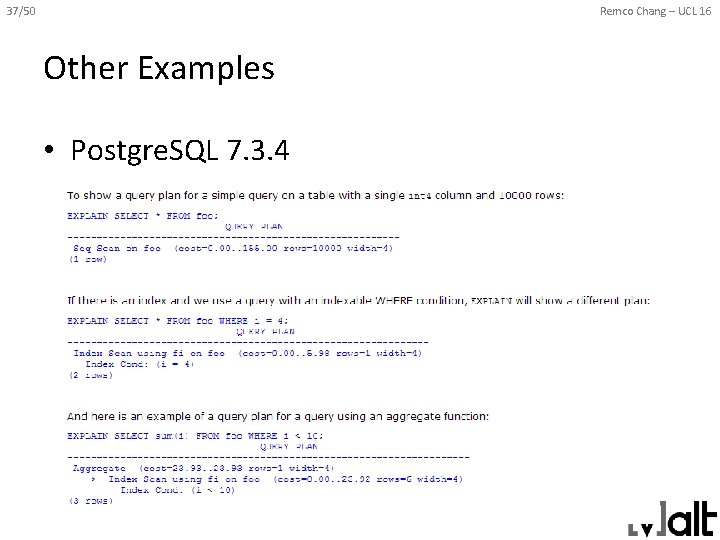
37/50 Remco Chang – UCL 16 Other Examples • Postgre. SQL 7. 3. 4
38/50 Remco Chang – UCL 16 Reduction Strategies • If the query result is estimated to be too large, we can dynamically “modify” the query: – Aggregation: • In Sci. DB, this operation is carried out as regrid (scale_factor. X, scale_factor. Y) – Sampling • In Sci. DB, uniform sampling is carried out as bernoulli (query, percentage, randseed) – Filtering • Currently, the filtering criteria is user specified where (clause)
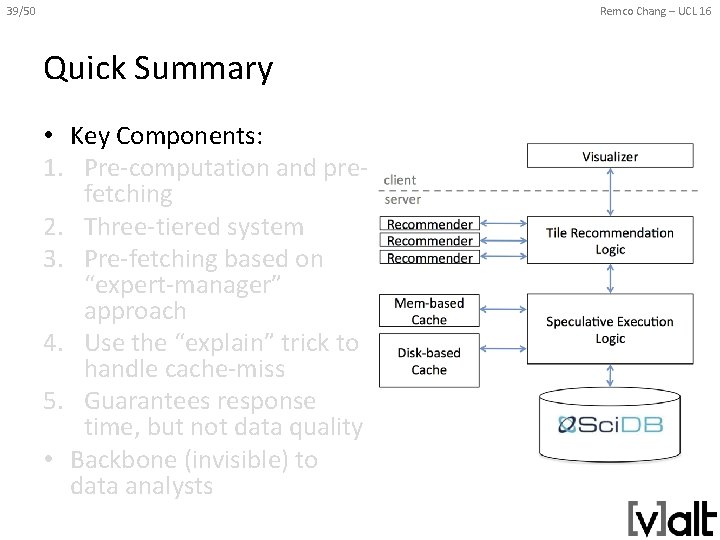
39/50 Remco Chang – UCL 16 Quick Summary • Key Components: 1. Pre-computation and prefetching 2. Three-tiered system 3. Pre-fetching based on “expert-manager” approach 4. Use the “explain” trick to handle cache-miss 5. Guarantees response time, but not data quality • Backbone (invisible) to data analysts
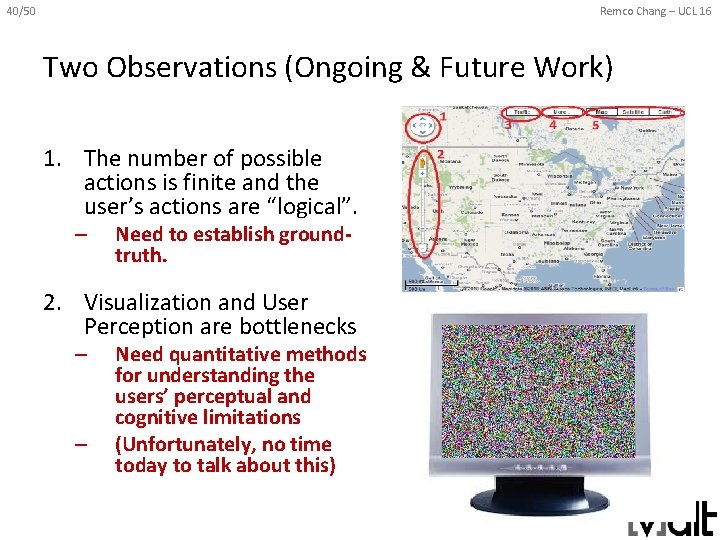
40/50 Remco Chang – UCL 16 Two Observations (Ongoing & Future Work) 1. The number of possible actions is finite and the user’s actions are “logical”. – Need to establish groundtruth. 2. Visualization and User Perception are bottlenecks – – Need quantitative methods for understanding the users’ perceptual and cognitive limitations (Unfortunately, no time today to talk about this)
41/50 Remco Chang – UCL 16 Analyzing a User’s Interactions Alvitta Eli Brown Ottley How are the user’s interactions predictable?
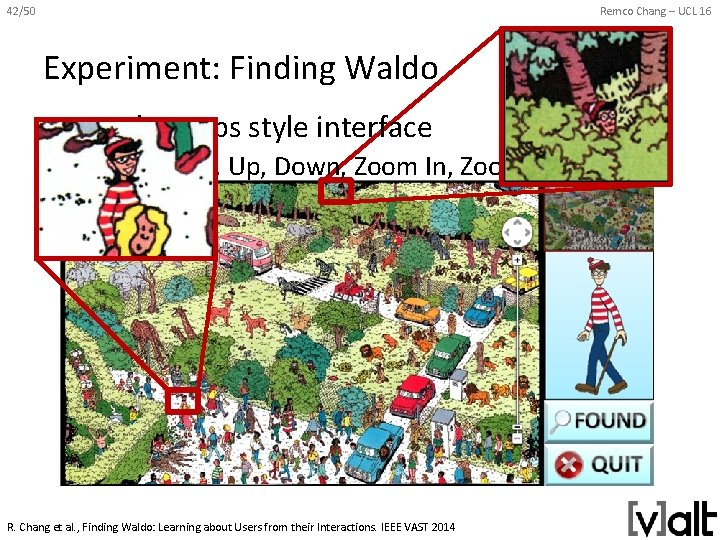
42/50 Remco Chang – UCL 16 Experiment: Finding Waldo • Google-Maps style interface – Left, Right, Up, Down, Zoom In, Zoom Out, Found R. Chang et al. , Finding Waldo: Learning about Users from their Interactions. IEEE VAST 2014
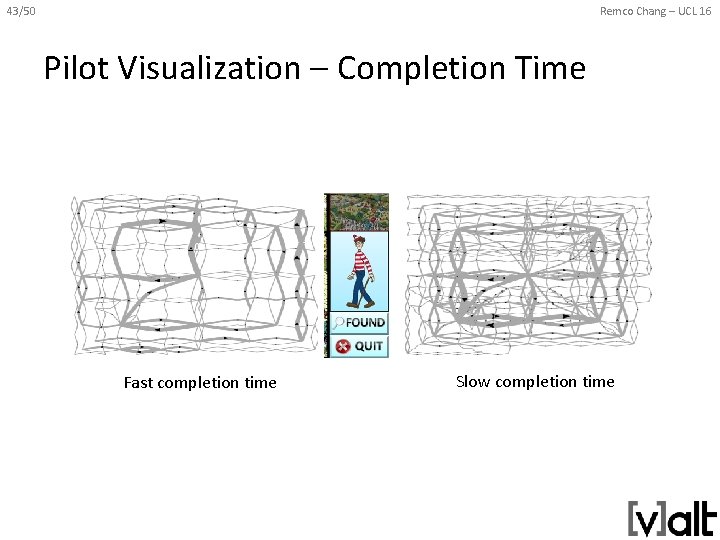
43/50 Remco Chang – UCL 16 Pilot Visualization – Completion Time Fast completion time Slow completion time
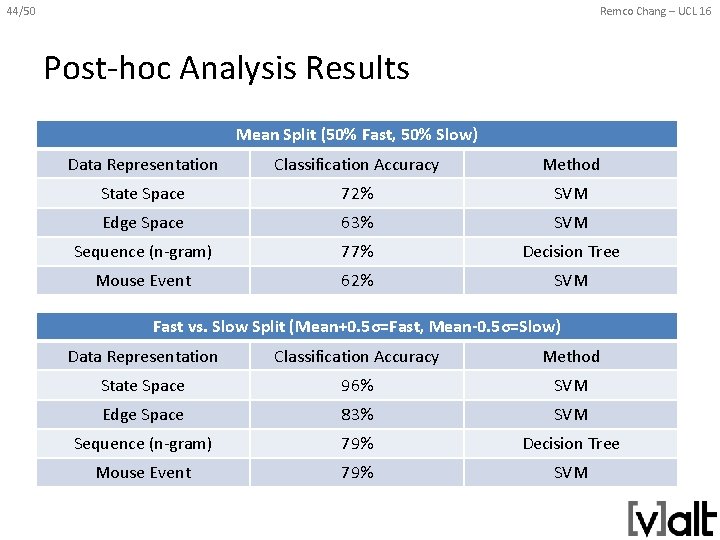
44/50 Remco Chang – UCL 16 Post-hoc Analysis Results Mean Split (50% Fast, 50% Slow) Data Representation Classification Accuracy Method State Space 72% SVM Edge Space 63% SVM Sequence (n-gram) 77% Decision Tree Mouse Event 62% SVM Fast vs. Slow Split (Mean+0. 5σ=Fast, Mean-0. 5σ=Slow) Data Representation Classification Accuracy Method State Space 96% SVM Edge Space 83% SVM Sequence (n-gram) 79% Decision Tree Mouse Event 79% SVM
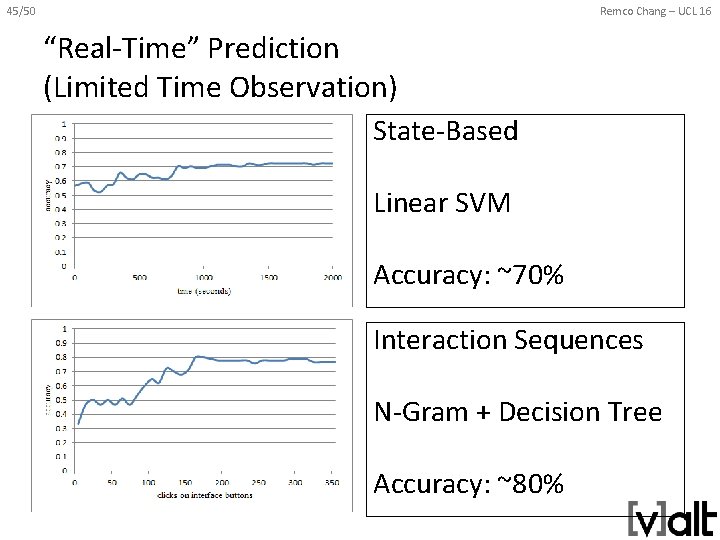
45/50 Remco Chang – UCL 16 “Real-Time” Prediction (Limited Time Observation) State-Based Linear SVM Accuracy: ~70% Interaction Sequences N-Gram + Decision Tree Accuracy: ~80%
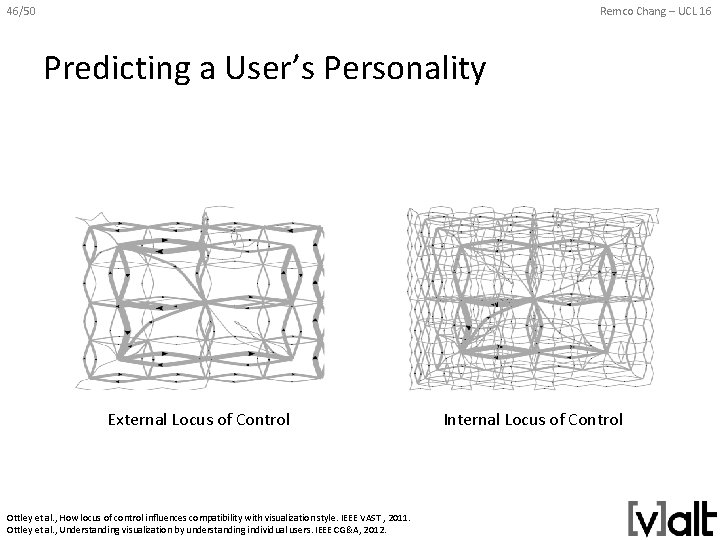
46/50 Remco Chang – UCL 16 Predicting a User’s Personality External Locus of Control Ottley et al. , How locus of control influences compatibility with visualization style. IEEE VAST , 2011. Ottley et al. , Understanding visualization by understanding individual users. IEEE CG&A, 2012. Internal Locus of Control
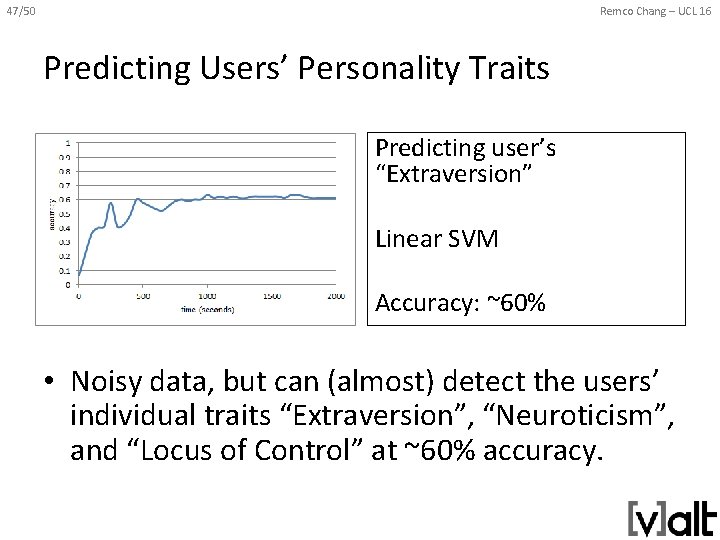
47/50 Remco Chang – UCL 16 Predicting Users’ Personality Traits Predicting user’s “Extraversion” Linear SVM Accuracy: ~60% • Noisy data, but can (almost) detect the users’ individual traits “Extraversion”, “Neuroticism”, and “Locus of Control” at ~60% accuracy.
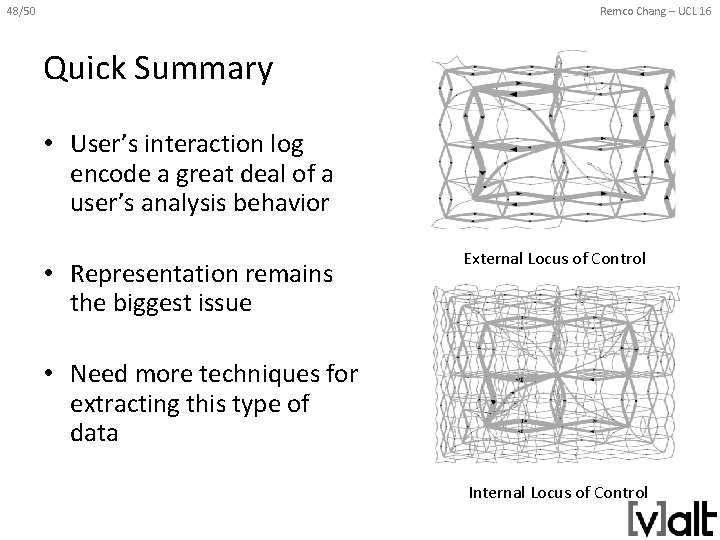
48/50 Remco Chang – UCL 16 Quick Summary • User’s interaction log encode a great deal of a user’s analysis behavior • Representation remains the biggest issue External Locus of Control • Need more techniques for extracting this type of data Internal Locus of Control
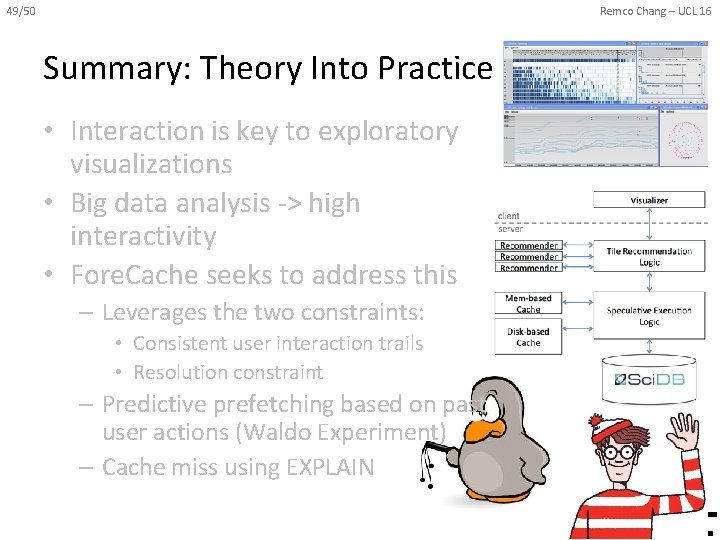
49/50 Remco Chang – UCL 16 Summary: Theory Into Practice • Interaction is key to exploratory visualizations • Big data analysis -> high interactivity • Fore. Cache seeks to address this – Leverages the two constraints: • Consistent user interaction trails • Resolution constraint – Predictive prefetching based on past user actions (Waldo Experiment) – Cache miss using EXPLAIN
50/50 Remco Chang – UCL 16 Questions? remco@cs. tufts. edu
- Slides: 50