13 Model Performance Dave Eargle CU Boulder Models

13 – Model Performance Dave Eargle – CU Boulder

Models can have varying complexity • … but what complexity is best? • Over-fitting the data • Finding chance occurrences in data that look like interesting patterns, but which do not generalize, is called over-fitting the data • We want models to apply not just to the exact training set but to the general population from which the training data came • Generalization

Over-fitting • Overfitting is: the tendency of DM procedures to tailor models to the training data, at the expense of generalization to previously unseen data points. • All data mining procedures have the tendency to over-fit to some extent • Some more than others. • “If you torture the data long enough, it will confess” • There is no single choice or procedure that will eliminate over-fitting • recognize over-fitting and manage complexity in a principled way.

How to evaluate your models? • Option 1 – use the data to train a model, and then test its performance on the same data What’s wrong with this approach? Use to induce… Test performance on… Model

How to evaluate your models? • Option 2 – “holdout” a sample of your data to use as a “test” set. Use to induce… Train Holdout Test performance on… Model Holdout

Fitting Graph

Over-fitting in tree induction

A note about decision tree complexity… • Complexity is only good up to a point • We can get an idea of when added complexity is no longer beneficial by splitting our “labeled” data into two datasets: “training” data and “testing” data • Train your model on the training data, measure accuracy • Then run your model on the test data, measure accuracy again • Compare over a range of complexity

Tree Complexity and Over-fitting

Tree Accuracy on a Churn dataset “Unpruned” tree had higher accuracy against training data, but worse accuracy on testing data, compared to a “pruned” decision tree

Pruning • Pruning simplifies a decision tree to prevent over-fitting to noise in the data • Post-pruning: • takes a fully-grown decision tree and discards unreliable parts • Pre-pruning: • stops growing a branch when information becomes unreliable • Post-pruning preferred in practice

Post-pruning a tree

Over-fitting in linear discriminants Increasing Complexity • The more parameters we add, the more complex our model becomes. More complexity = more able to fit patterns More complexity = more likelihood of overfitting

Example: Classifying Flowers

Example: Classifying Flowers

Example: Classifying Flowers

Example: Classifying Flowers

Need for holdout evaluation Under-fitting Good Over-fitting • In-sample evaluation is in favor or “memorizing” • On the training data the right model would be best • But on new data it would be bad

Over-fitting Under-fitting Over-fitting Good Fit • Over-fitting: Model “memorizes” the properties of the particular training set rather than learning the underlying concept or phenomenon

Holdout validation • We are interested in generalization • The performance on data not used for training • Given only one data set, we hold out some data for evaluation • Holdout set for final evaluation is called the test set • Accuracy on training data is sometimes called “in-sample” accuracy, vs. “out-of-sample” accuracy on test data

Evaluation option 2 revisited What’s wrong with • Option 2 – “holdout” a sample of your data to use as a “test” set. this approach? Use to induce… Train Holdout Test performance on… Model Holdout
: an alternative to holdout testing")
Third option… cross-validation (x-val): an alternative to holdout testing

Cross-Validation: Establishing Modeling Performance Repeat this whole process for multiple modeling approaches. Compare “test sample performance” measures. This tells you which modeling approach is best.

From Holdout Evaluation to Cross-Validation • Not only a simple estimate of the generalization performance, but also some statistics on the estimated performance, • such as the mean and variance • Better use of a limited dataset • Cross-validation computes its estimates over all the data

Let’s focus back in on actually mining the data. . Which customers should Tel. Co target with a special offer, prior to contract expiration?

Mega. Tel. Co

Learning Curves

Comparing learning curves is essential Which model do you think will be best as the training sample size gets bigger?

Comparing learning curves is essential YOU WERE WRONG

Choice of algorithm is not trivial!

Logistic Regression vs Tree Induction • For smaller training-set sizes, logistic regression yields better generalization accuracy than tree induction • For smaller data, tree induction will tend to over-fit more • Classification trees are a more flexible model representation than linear logistic regression • Flexibility of tree induction can be an advantage with larger training sets: • Trees can represent substantially nonlinear relationships between the features and the target

Learning curves vs Fitting graphs • A learning curve shows the generalization performance plotted against the amount of training data used • Can help answer the question, “should we pay to obtain more data”? • Data. Robot shows learning curves (let’s look) • A fitting graph shows the generalization performance as well as the performance on the training data, but plotted against model complexity • Fitting graphs generally are shown for a fixed amount of training data
 that maximize the value")
Regularization • We’re interested in the set of weights (w) that maximize the value on the right Calculate how well a set of weights (w) fit the actual values (x), but penalize the fit statistic by the size of the weights (w)

Nested Cross-Validation: 3 -level Split your data into “folds”. Hold out one fold for testing. Combine all other folds and send them down to the next level. Inception! Use average results from the lower Split this data into “folds”. Hold level to train. Then, hold out a out fold for testing. Combine all different fold for testing, and send other folds and send them down the rest to the next level. down to the next level. Repeat until all folds have been forfrom testing. Use average used results the lower train. Then, Hold hold out a Split thislevel datatointo “folds”. different fold for testing, out one fold for testing. Train and send down the rest to the next level. on al other folds. Repeat until all folds have been used forfor testing. Hold out a different fold testing. Repeat training. Repeat until all folds have been used for testing.

How many training sessions would that be? 30 Training Sessions for 2 -level nested CV

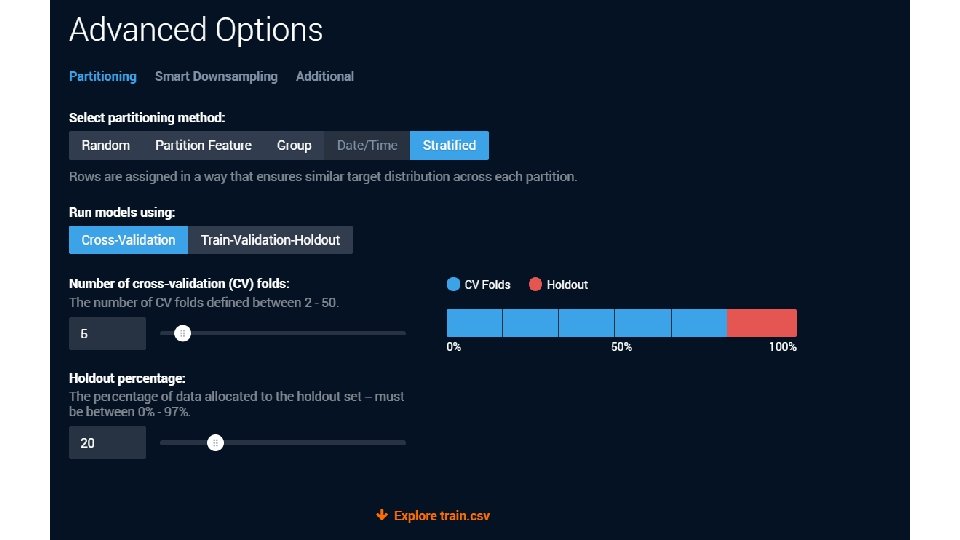
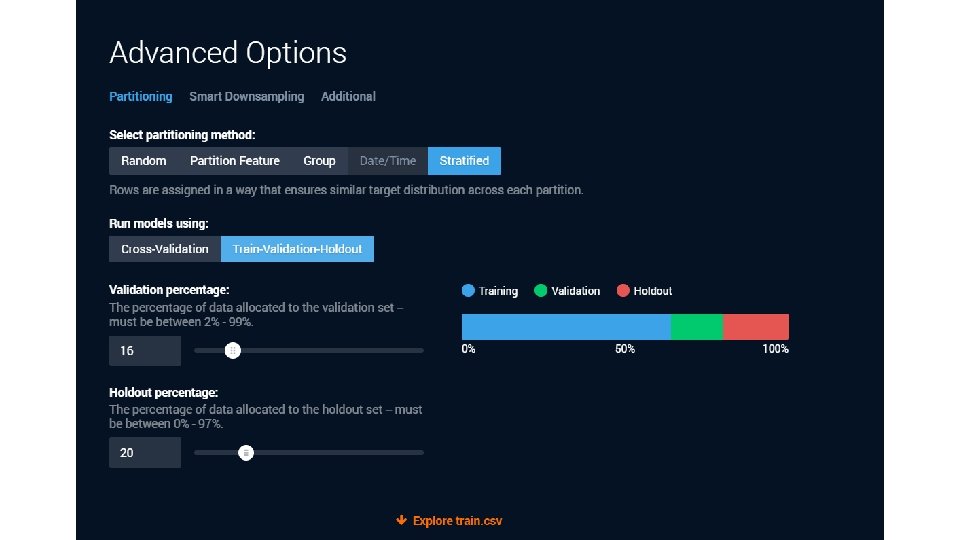
Data Robot does partitioning for you. Let’s look • https: //app. datarobot. com/docs/users-guide/more-info/datapartitioning. html? highlight=holdout • Data Robot splits your dataset several times • Once into a “train-test” split • They call the “test” a “holdout” • And then a cross-validation is run on just the “train” • you can “unlock” the holdout later to test your CV’ed models • Let’s use the lending club “no target leak” sample dataset…


• Many figures in this slide deck from Provost, F. , & Fawcett, T. (2013). Data science for business: what you need to know about data mining and data-analytic thinking. Sebastopol, Calif. : O'Reilly.
- Slides: 40