13 1 Human Population Growth Life Histories Life


")


- Slides: 15
13. 1 Human Population Growth
Life Histories Life history refers to events in an organism’s life. It includes: ◦ age of reproductive maturity ◦ type of survivorship ◦ fecundity ◦ life span ◦ mortality
K-Strategists In general, humans are considered K-strategists: ◦ Small number of offspring ◦ Reproduce later in life ◦ Provide ample parental care Ecologists use the r/K selection theory to estimate growth patterns
Demography is the statistical study of factors that affect human populations These factors include: ◦ Birth rate ◦ Death rate ◦ Population growth ◦ Population distribution ◦ Movement World Population 2008
Human Population Growth
Human Population Growth The human population curve shows exponential growth Population growth and size has been regulated by factors that affect other populations, such as food availability, disease, and predators Technological advances have also influenced population sizes
Exponential Growth Birth rate: 30/1000 people per year Death rate: 20/1000 people per year The difference between these rates results in about 2% growth per year Doubling time refers to the amount of time it takes for a population to double With a current growth rate of 1. 2% per year, the world’s population (7 billion) is expected to double in another 58 years
Demographic Transition Model A model was proposed by Warren Thompson that correlates stages of economic development with changes in population.
Population Pyramids Population pyramids are used by demographers to graph the age of a population and compare various populations. They show the percentage of females and males in different age categories (typically 5 year intervals)
Population Pyramids Population Pyramid – Republic of Congo Shows growth momentum (many young people) Population Pyramid – Canada Baby boomer bulge, negative growth structure
Carrying Capacity All environments have a limit to what they can sustain Today, the richest 20% of the population: ◦ uses 86% of the world’s resources ◦ Produce 53% of CO 2 emissions The poorest countries: ◦ Use 1. 3% of the world’s resources ◦ Produce 3% of the CO 2 emissions
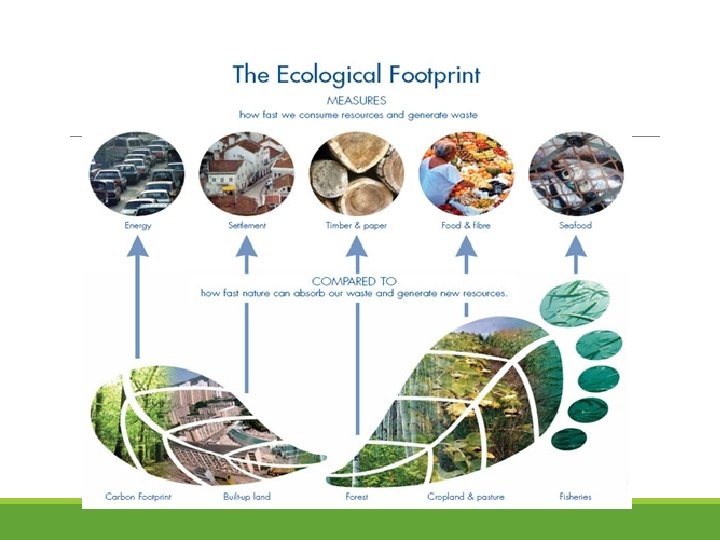
Ecological Footprint Measures the total amount of land needed to support one person Includes 6 categories of demand: ◦ ◦ ◦ Cropland Grazing land Fishing ground Forest land Carbon absorption land Building area Average ecological person is 2 ha/person (20000 m 2)
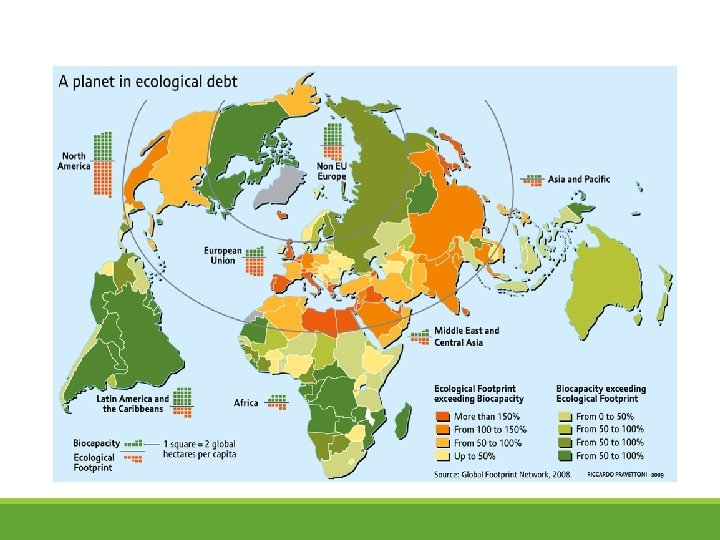
Biocapacity The Earth’s carrying capacity for human population is referred to as available biocapacity It includes: ◦ ◦ ◦ Cropland Grazing land Fishing grounds Forest land Building area Carbon-asbsorption land Currently, the Earth’s ecological footprint exceeds the biocapacity by about 23%