
12 February 2022 DistanceTime Graphs Date and title
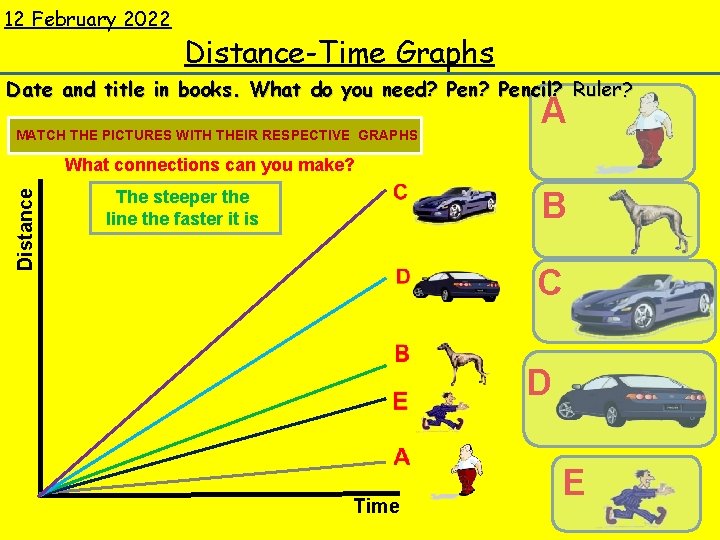
12 February 2022 Distance-Time Graphs Date and title in books. What do you need? Pencil? Ruler? MATCH THE PICTURES WITH THEIR RESPECTIVE GRAPHS A Distance What connections can you make? B The steeper the line the faster it is C D Time E
Learning Objective To be able to: Understand how to describe what distancetime graphs show us Key Words: distance–time graph, accelerate, stationary
Learning Outcomes I can identify if an object is moving or is at rest from a distance –time graph I can identify when an object is at constant speed from a distance-time graph I can calculate the average speed from a distance-time graph I can illustrate a journey with changing speed on a distance-time graph, and label changes in motion
Common misconception A straight line sloping upwards on a distance– time graph indicates that speed is increasing.
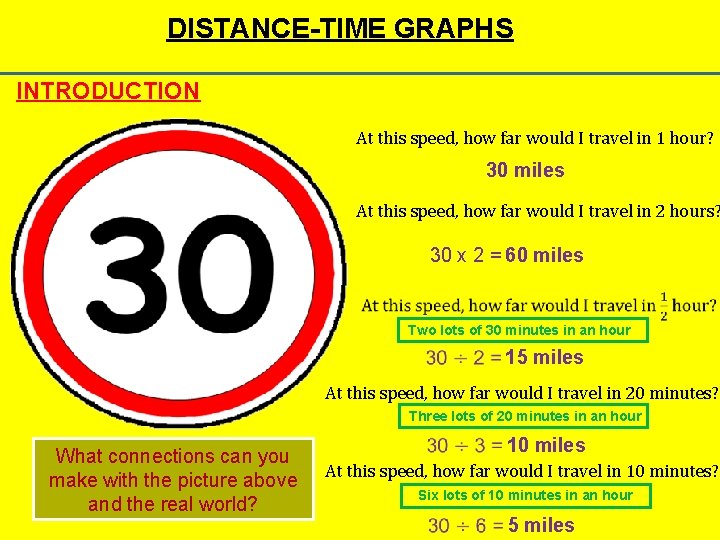
DISTANCE-TIME GRAPHS INTRODUCTION At this speed, how far would I travel in 1 hour? 30 miles At this speed, how far would I travel in 2 hours? 30 x 2 = 60 miles Two lots of 30 minutes in an hour 15 miles At this speed, how far would I travel in 20 minutes? Three lots of 20 minutes in an hour What connections can you make with the picture above and the real world? 10 miles At this speed, how far would I travel in 10 minutes? Six lots of 10 minutes in an hour 5 miles
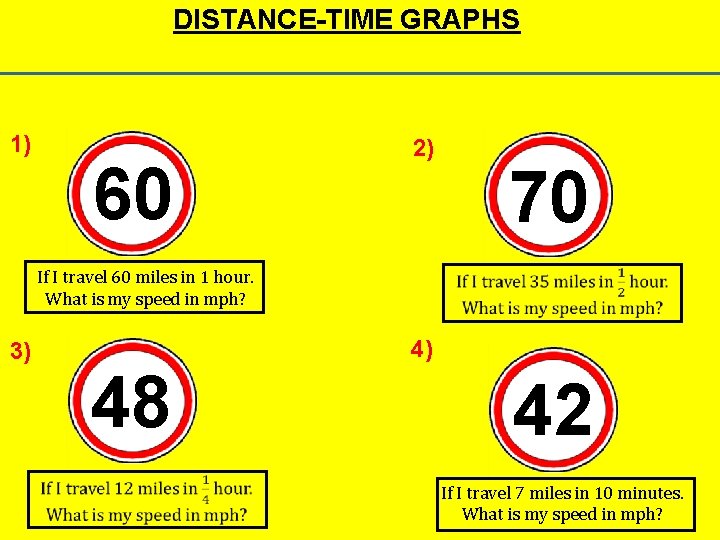
DISTANCE-TIME GRAPHS 1) 60 2) 70 If I travel 60 miles in 1 hour. What is my speed in mph? 3) 48 4) 42 If I travel 7 miles in 10 minutes. What is my speed in mph?
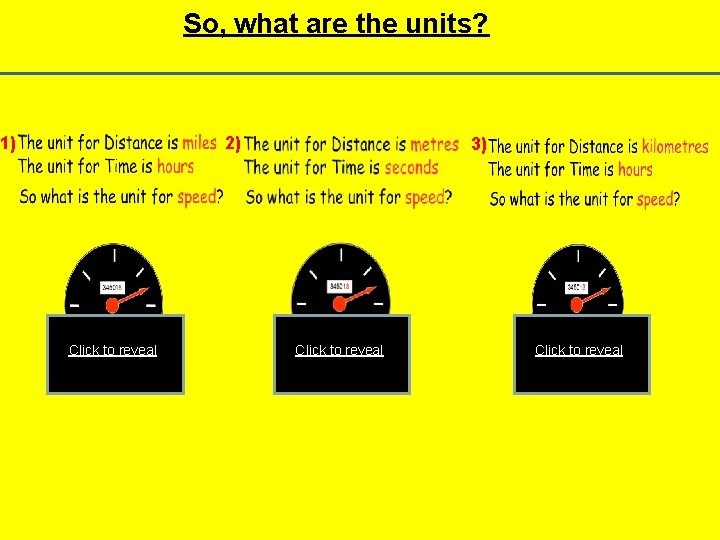
So, what are the units? 1) 2) Click to reveal 3) Click to reveal
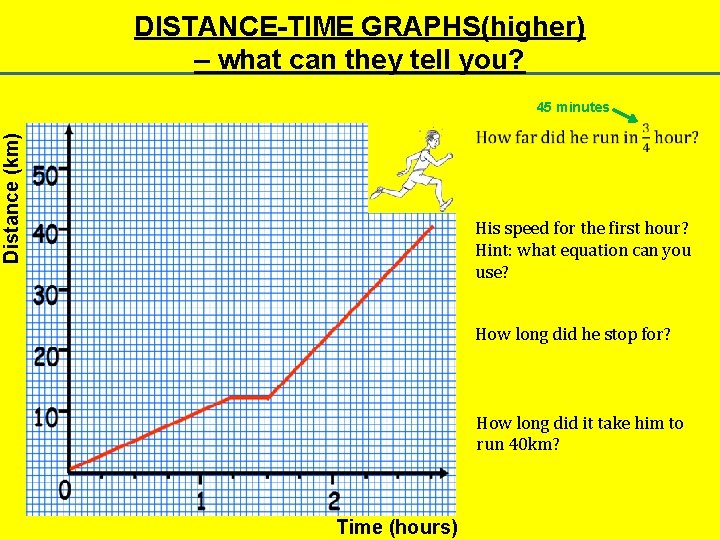
DISTANCE-TIME GRAPHS(higher) – what can they tell you? Distance (km) 45 minutes His speed for the first hour? Hint: what equation can you use? How long did he stop for? How long did it take him to run 40 km? Time (hours)
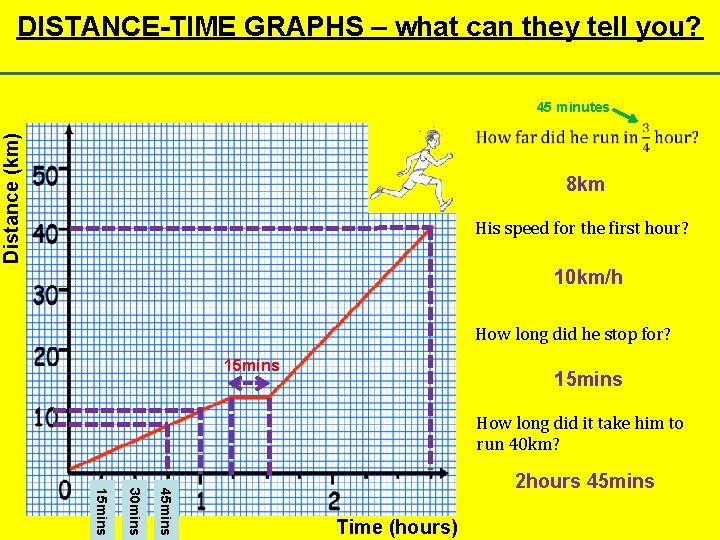
DISTANCE-TIME GRAPHS – what can they tell you? Distance (km) 45 minutes 8 km His speed for the first hour? 10 km/h How long did he stop for? 15 mins How long did it take him to run 40 km? 45 mins 30 mins 15 mins 2 hours 45 mins Time (hours)
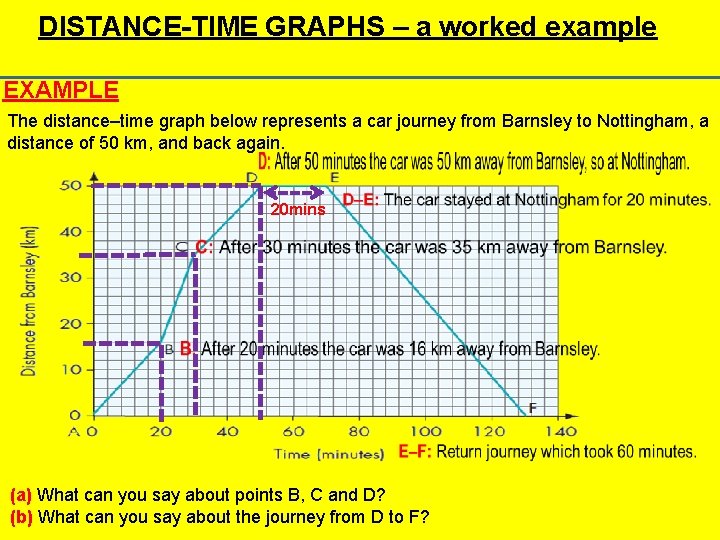
DISTANCE-TIME GRAPHS – a worked example EXAMPLE The distance–time graph below represents a car journey from Barnsley to Nottingham, a distance of 50 km, and back again. 20 mins (a) What can you say about points B, C and D? (b) What can you say about the journey from D to F?
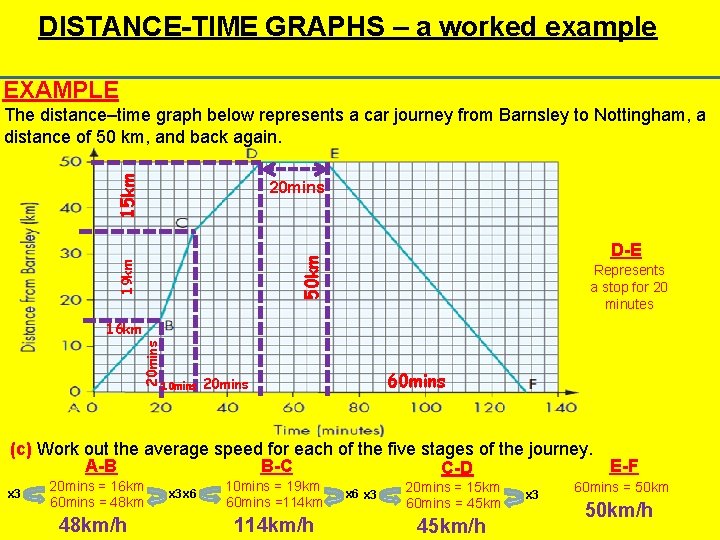
DISTANCE-TIME GRAPHS – a worked example EXAMPLE 15 km The distance–time graph below represents a car journey from Barnsley to Nottingham, a distance of 50 km, and back again. 20 mins 19 km 50 km D-E Represents a stop for 20 minutes 20 mins 16 km 10 mins 60 mins 20 mins (c) Work out the average speed for each of the five stages of the journey. A-B B-C E-F C-D x 3 20 mins = 16 km 60 mins = 48 km/h x 3 x 6 10 mins = 19 km 60 mins =114 km/h x 6 x 3 20 mins = 15 km 60 mins = 45 km/h x 3 60 mins = 50 km/h
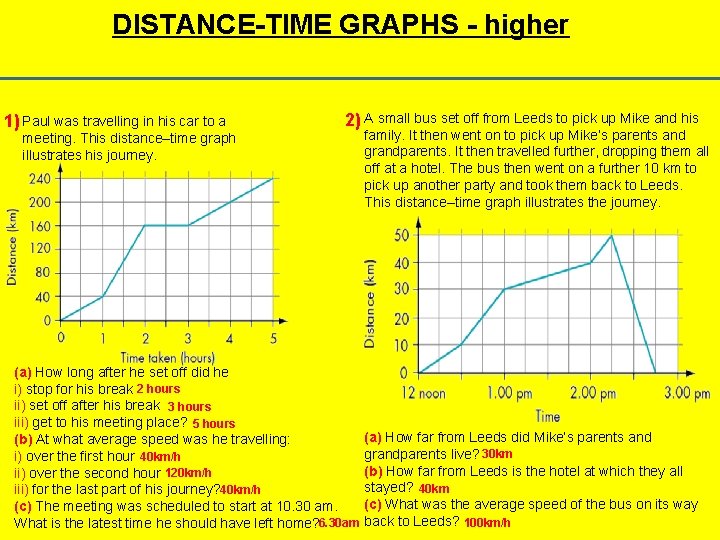
DISTANCE-TIME GRAPHS - higher 1) Paul was travelling in his car to a 2) A small bus set off from Leeds to pick up Mike and his meeting. This distance–time graph illustrates his journey. (a) How long after he set off did he i) stop for his break 2 hours ii) set off after his break 3 hours iii) get to his meeting place? 5 hours (b) At what average speed was he travelling: i) over the first hour 40 km/h ii) over the second hour 120 km/h iii) for the last part of his journey? 40 km/h (c) The meeting was scheduled to start at 10. 30 am. What is the latest time he should have left home? 6. 30 am family. It then went on to pick up Mike’s parents and grandparents. It then travelled further, dropping them all off at a hotel. The bus then went on a further 10 km to pick up another party and took them back to Leeds. This distance–time graph illustrates the journey. (a) How far from Leeds did Mike’s parents and grandparents live? 30 km (b) How far from Leeds is the hotel at which they all stayed? 40 km (c) What was the average speed of the bus on its way back to Leeds? 100 km/h
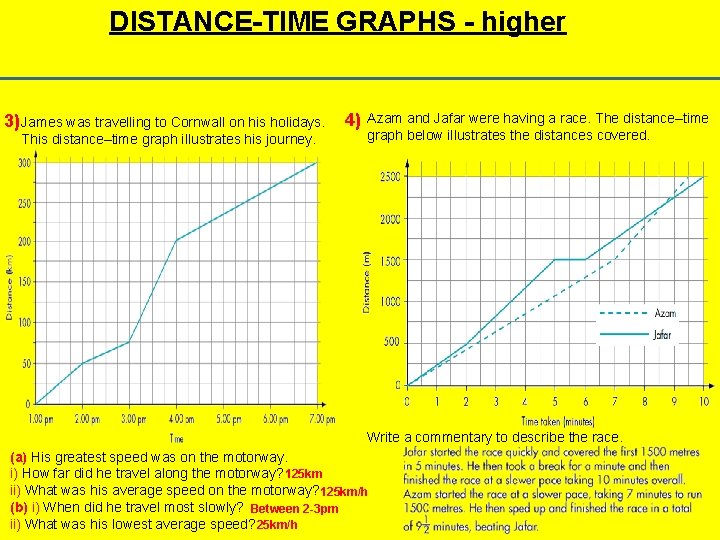
DISTANCE-TIME GRAPHS - higher 3) James was travelling to Cornwall on his holidays. This distance–time graph illustrates his journey. 4) Azam and Jafar were having a race. The distance–time graph below illustrates the distances covered. Write a commentary to describe the race. (a) His greatest speed was on the motorway. i) How far did he travel along the motorway? 125 km ii) What was his average speed on the motorway? 125 km/h (b) i) When did he travel most slowly? Between 2 -3 pm ii) What was his lowest average speed? 25 km/h
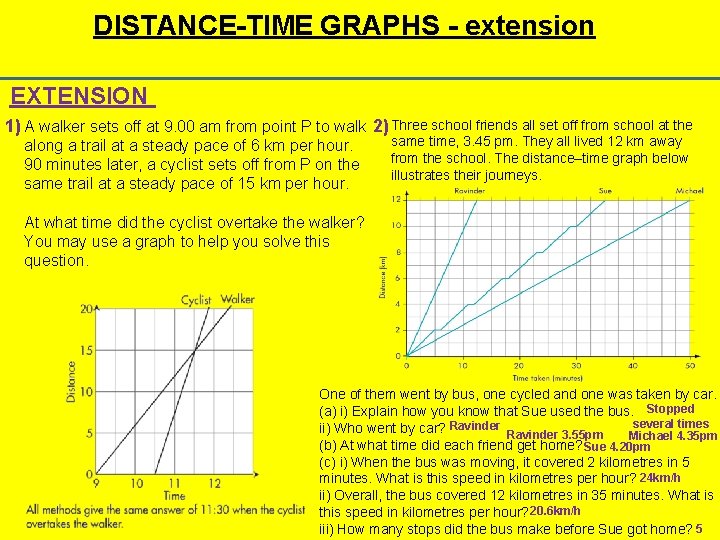
DISTANCE-TIME GRAPHS - extension EXTENSION 1) A walker sets off at 9. 00 am from point P to walk 2) Three school friends all set off from school at the along a trail at a steady pace of 6 km per hour. 90 minutes later, a cyclist sets off from P on the same trail at a steady pace of 15 km per hour. same time, 3. 45 pm. They all lived 12 km away from the school. The distance–time graph below illustrates their journeys. At what time did the cyclist overtake the walker? You may use a graph to help you solve this question. One of them went by bus, one cycled and one was taken by car. (a) i) Explain how you know that Sue used the bus. Stopped several times ii) Who went by car? Ravinder 3. 55 pm Michael 4. 35 pm (b) At what time did each friend get home? Sue 4. 20 pm (c) i) When the bus was moving, it covered 2 kilometres in 5 minutes. What is this speed in kilometres per hour? 24 km/h ii) Overall, the bus covered 12 kilometres in 35 minutes. What is this speed in kilometres per hour? 20. 6 km/h iii) How many stops did the bus make before Sue got home? 5

Matching graphs to descriptions • Choose the best description from statements i) to vi) below to match each of graphs a) to d).
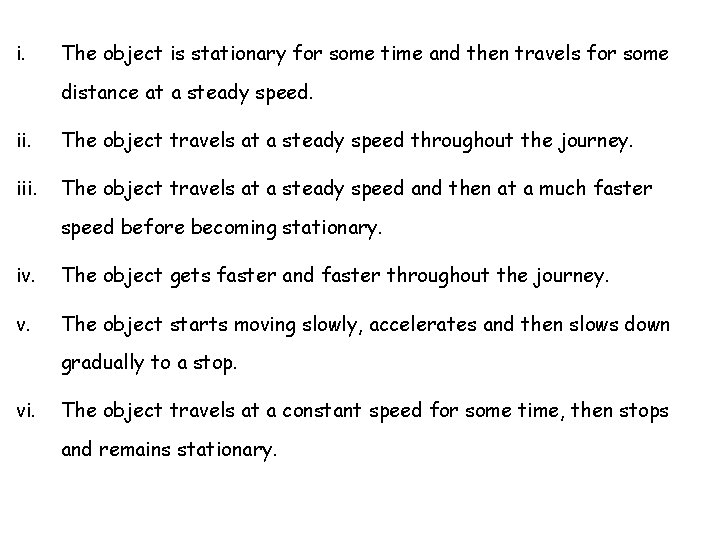
i. The object is stationary for some time and then travels for some distance at a steady speed. ii. The object travels at a steady speed throughout the journey. iii. The object travels at a steady speed and then at a much faster speed before becoming stationary. iv. The object gets faster and faster throughout the journey. v. The object starts moving slowly, accelerates and then slows down gradually to a stop. vi. The object travels at a constant speed for some time, then stops and remains stationary.
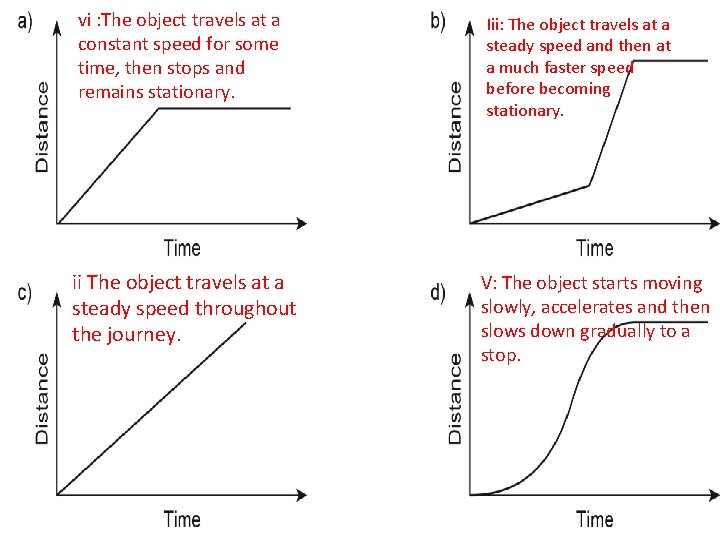
vi : The object travels at a constant speed for some time, then stops and remains stationary. ii The object travels at a steady speed throughout the journey. Iii: The object travels at a steady speed and then at a much faster speed before becoming stationary. V: The object starts moving slowly, accelerates and then slows down gradually to a stop.
- Slides: 17