12 Binary Liquid Vapor Phase diagram Refractometer 3
 3조 박준수, 박태균, 정승환, 유은혜")
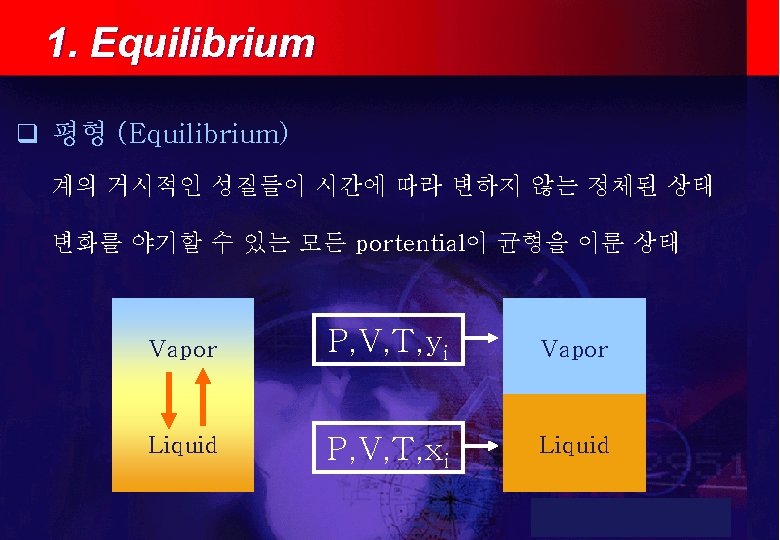
화학공학실험 실험 12 Binary Liquid- Vapor Phase diagram (Refractometer) 3조 박준수, 박태균, 정승환, 유은혜

4. PTxy diagram for Vapor - Liquid Equilibrium C 2 q F점에서 G점으로 압력 감소 P • L점에서 증기의 첫기포 발생 Bubble Point (기포점) 연결선 Bubble Point Curve F C 1 L 0 G x 1, y 1 W T • W점에서 액체증발이 마감 Dew Point (이슬점) 연결선 Dew Point Curve

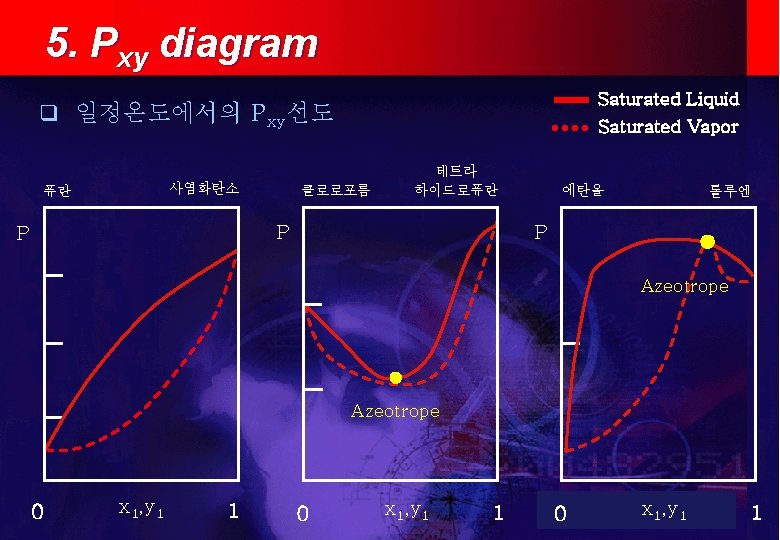
5. Pxy diagram for 3 temp q 서로 다른 온도에서 P-x-y 선도 C 2 Td C P Tb C A A C 1 Ta B B Saturated Liquid 0 Saturated Vapor x 1, y 1 T 1 0 x 1, y 1 1

6. Txy diagram for 3 Press q 서로 다른 압력에서 T-x-y 선도 Pd C 2 T P C C C Pb Pa C 1 Saturated Liquid 0 Saturated Vapor x 1, y 1 T 1 0 x 1, y 1 1


7. PT diagram for several compositions q 몇 개의 조성에 따른 PT 선도 C 2 Critical locus P C 2 T A K A B C 1 K U B 0 x 1, y 1 U 1 Critical locus C 1 Saturated Liquid Saturated Vapor T 0 x 1, y 1 1

10. 실험방법 q 증류 온도계 물배출 물주입 q 굴절률 측정 C 2 H 2 Cl 4 C 6 H 10 O 온도 1 V, 1 L 125 ml 0 ml 146 ℃ 2 V, 2 L - +38 ml 149 ℃ 3 V, 3 L - - 151 ℃ 4 V, 4 L - - 154 ℃ 5 V, 5 L +35 ml +25 ml 157 ℃ 6 V, 6 L +36 ml +54 ml 끓는점일정 7 V, 7 L 0 ml 105 ml 155 ℃ 8 V, 8 L +20 ml - 156. 5 ℃ 9 V, 9 L +17 ml +50 ml 157 ℃ 10 V, 10 L - - 끓는점일정
- Slides: 15