12 b The AD AS Model AS Graph

12 b – The AD /AS Model: AS Graph and Equilibrium This web quiz may appear as two pages on tablets and laptops. I recommend that you view it as one page by clicking on the open book icon at the bottom of the page.
 • Define • Draw •")
12 b – AS and Equilibrium Aggregate Supply (AS) • Define • Draw • Describe • Determinants Macroeconomic Equilibrium • UE • IN • EG

12 b – AS and Equilibrium OUTCOMES • Define, draw, and describe the shape of the immediate short-run, and long-run AS curves, and understand the determinants of the short-run AS curve [Define, Draw, Describe, Determinants] • Find an economy's equilibrium price level and real domestic output using AD/AS graph • Explain using an AD/AS graph what happens to RDO, the price level, UE, IN, and EG when there is a change in AD and/or AS. • Explain the ratchet effect and demand pull inflation • Explain cost-push inflation and stagflation • Two (or three) definitions of economic growth • IN THE NEWS - Use the AS/AD model to explain what might happen to UE, IN, and EG following these events in the news: • 2003: "the recently-signed tax-cut plan, which will give rebate checks to families with children in late summer, right in time for back-to-school spending" • 2003: "improving consumer confidence -- critical, since consumer spending makes up more than two-thirds of the economy" • 2003: "The Commerce Department's report last week of a surprising August improvement in the international trade balance " • 2009: "Personal spending jumped 1. 3% last month, the government said. " • 2011: "With energy prices already well on the rise before the latest crisis hit the Middle East and North Africa, is the global economy headed for another tumble? " • How can an economy go beyond the full employment level of output?

12 b – AS and Equilibrium Key Terms AS, immediate-short-run AS, long-run AS, Keynesian range, Intermediate range, Classical range, equilibrium price level, equilibrium real output (RDO), demand-pull inflation, cost-push inflation, efficiency wages, ratchet effect, stagflation, OPEC

1. DEFINE: Aggregate Supply is a schedule or curve showing the relationship between a nation’s: 1. aggregate demand the price level 2. price level and the amount of output that would be demanded 3. the amount of output produced and the aggregate demand 4. price level and the amount of output produced

1. DEFINE: Aggregate Supply is a schedule or curve showing the relationship between a nation’s: 1. aggregate demand the price level 2. price level and the amount of output that would be demanded 3. the amount of output produced and the aggregate demand 4. price level and the amount of output produced
: 1.")
2. Draw: Which graph below correctly shows the aggregate supply curve (short run): 1. 2. 3. 4. A B C D
: 1.")
2. Draw: Which graph below correctly shows the aggregate supply curve (short run): 1. 2. 3. 4. A B C D

Aggregate Supply

3. DESCRIBE: At very low levels of output, the short-run aggregate supply curve is relatively: 1. Flat, , because increasing output will cause small increases in per-unit production costs 2. flat, because firms are reluctant to give their workers raises when output is so low 3. steep, because firms are reluctant to give their workers raises when output is so low 4. steep, because increasing output will cause aggregate demand to increase

3. DESCRIBE: At very low levels of output, the short-run aggregate supply curve is relatively: 1. Flat, , because increasing output will cause small increases in per-unit production costs 2. flat, because firms are reluctant to give their workers raises when output is so low 3. steep, because firms are reluctant to give their workers raises when output is so low 4. steep, because increasing output will cause aggregate demand to increase

4. DETERMINANTS: Higher prices of imported resources will: 1. move the economy downward and to the right along the aggregate demand curve 2. make the aggregate demand curve steeper 3. shift the aggregate demand curve to the left 4. shift the aggregate supply curve to the left

4. DETERMINANTS: Higher prices of imported resources will: 1. move the economy downward and to the right along the aggregate demand curve 2. make the aggregate demand curve steeper 3. shift the aggregate demand curve to the left 4. shift the aggregate supply curve to the left

5. DETERMINANTS: Which of the following factors will shift AS 1 to AS 3? 1. increase in productivity 2. decrease in business taxes 3. decrease in household indebtedness 4. increase in input prices

5. DETERMINANTS: Which of the following factors will shift AS 1 to AS 3? 1. increase in productivity 2. decrease in business taxes 3. decrease in household indebtedness 4. increase in input prices

6. DETERMINANTS: Which of the following factors will shift AS 1 to AS 2? 1. increase in gov’t spending 2. decrease in business taxes 3. increase in net exports 4. increase in productivity

6. DETERMINANTS: Which of the following factors will shift AS 1 to AS 2? 1. increase in gov’t spending 2. decrease in business taxes 3. increase in net exports 4. increase in productivity

7. DETERMINANTS: Which of the following factors will shift AS 1 to AS 3? 1. increase in gov’t regulations 2. decrease in business taxes 3. decrease in resource peices 4. increase in productivity

7. DETERMINANTS: Which of the following factors will shift AS 1 to AS 3? 1. increase in gov’t regulations 2. decrease in business taxes 3. decrease in resource peices 4. increase in productivity

OUR GOAL: To see what happens to: – UE – IN – EG To do this we will need both AD and AS then find the macroeconomic EQUILIBRIUM. Then when the DETERMINANTS change we will get a change in UE, IN, and EG.

Determinants of AS

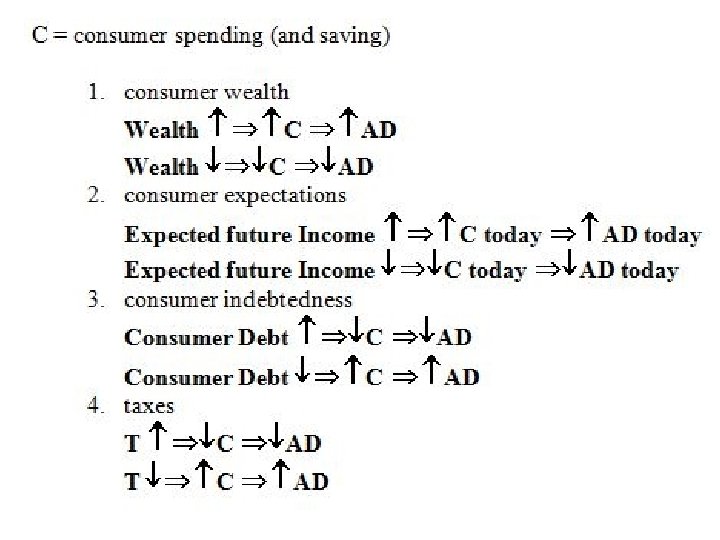
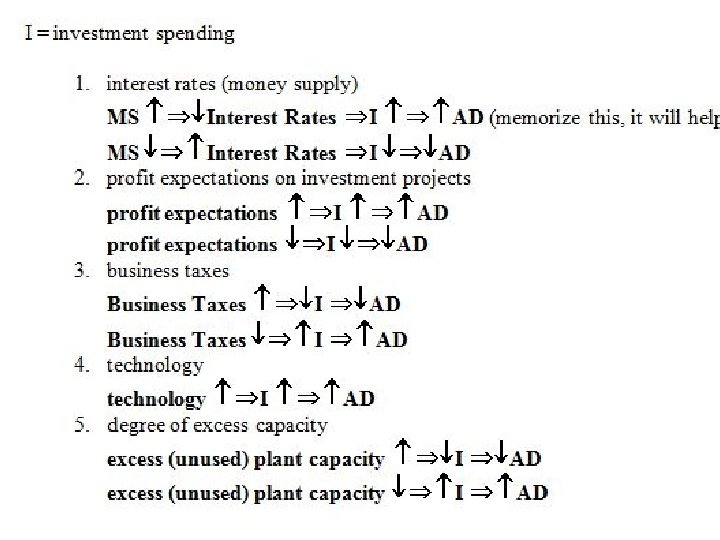
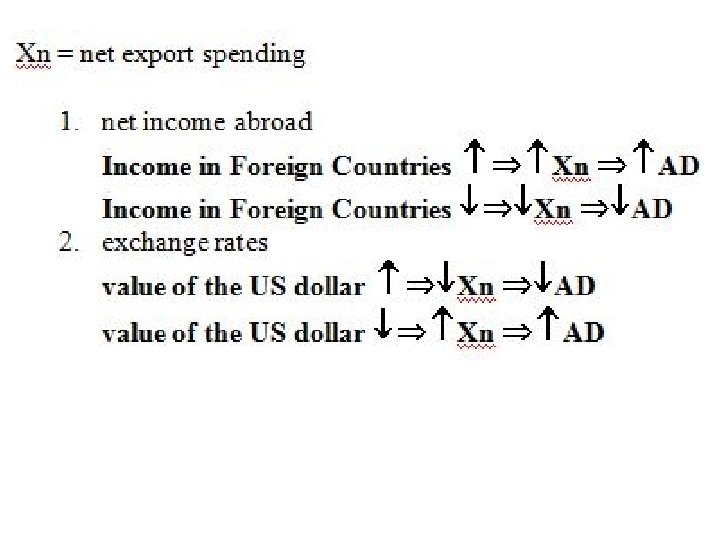
Determinants of AD

8. In 2007 home values began to decline significantly. Which graph above illustrates the effect on the economy? 1. 1 2. 2 3. 3 What happens to 4. 4 UE, IN, and EG?

8. In 2007 home values began to decline significantly. Which graph above illustrates the effect on the economy? 1. 1 2. 2 3. 3 What happens to 4. 4 UE, IN, and EG?
? 1. 2. 3. 4. A student buys")
9. Which is an economic investment (I)? 1. 2. 3. 4. A student buys stock in Apple computers An investor buy a government bond A carpenter buys a hammer A professor buys new skis
? 1. 2. 3. 4. A student buys")
9. Which is an economic investment (I)? 1. 2. 3. 4. A student buys stock in Apple computers An investor buy a government bond A carpenter buys a hammer A professor buys new skis

10. Assume business have increased excess capacity. Which graph above illustrates the effect on the economy? 1. 1 2. 2 3. 3 What happens to 4. 4 UE, IN, and EG?

10. Assume business have increased excess capacity. Which graph above illustrates the effect on the economy? 1. 1 2. 2 3. 3 What happens to 4. 4 UE, IN, and EG?

11. Assume the $ appreciates. Which graph above illustrates the effect on the economy? 1. 2. 3. 4. 1 2 3 4 What happens to UE, IN, and EG?

11. Assume the $ appreciates. Which graph above illustrates the effect on the economy? 1. 2. 3. 4. 1 2 3 4 What happens to UE, IN, and EG?

12. Which graph above illustrates the stagflation of the late 1970 s and early 1980 s? ? 1. 2. 3. 4. 1 2 3 4 What happens to UE, IN, and EG?

12. Which graph above illustrates the stagflation of the late 1970 s and early 1980 s? ? 1. 2. 3. 4. 1 2 3 4 What happens to UE, IN, and EG?

Determinants of AS

The Business Cycle
- Slides: 37