12 a The AD AS Model AD Graph


? 1. 2. 3. 4. A student buys")
? 1. 2. 3. 4. A student buys")


 curve? 1. 2.")
 curve? 1. 2.")


 or right")


 – Inflation (IN) –")
- Slides: 46
12 a – The AD /AS Model: AD Graph and its Determinants This web quiz may appear as two pages on tablets and laptops. I recommend that you view it as one page by clicking on the open book icon at the bottom of the page.
12 a – The AD/AS Model: AD Graph and its Determinants • UE, IN, and EG (Ch 6) • The Business Cycle (Ch. 9) • The AD (Ch. 12) • Define • Draw • Describe • Determinants
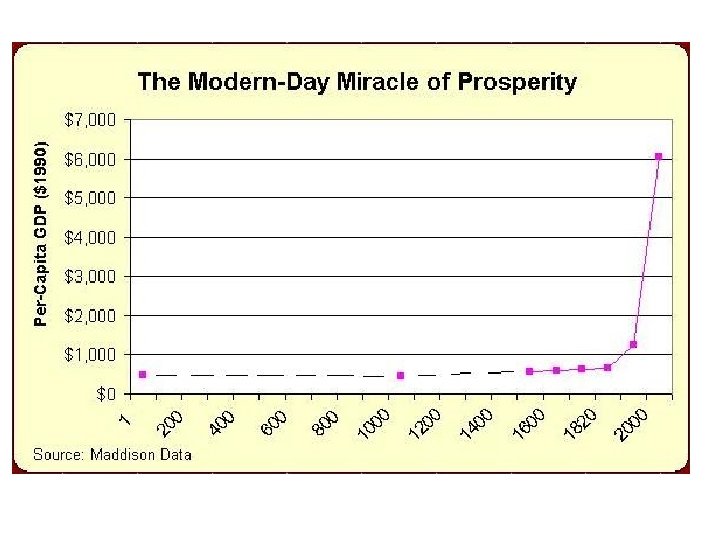
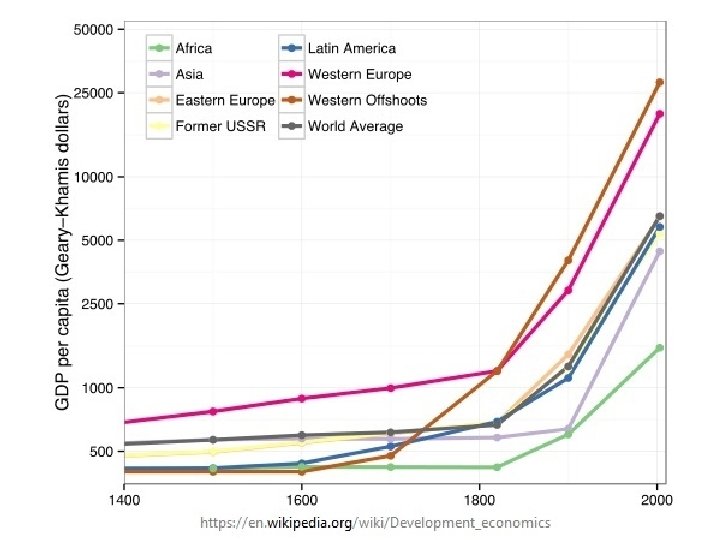
12 a – The AD/AS Model: AD Graph and its Determinants OUTCOMES • What is the "miracle of modern economic growth"? • Economic growth, the choice between present and future consumption, and the role of saving and investment. • Unemployment, inflation and the business cycle: peak, recession, trough, and expansion (recovery); long run growth trend • Causes of the business cycle: demand shocks and price stickiness • Define, draw, and describe the shape, and understand the determinants of the AD curve [Define, Draw, Describe, Determinants]
12 a – The AD /AS Model: AD Graph and its Determinants KEY TERMS: real GDP, unemployment, inflation, modern economic growth, saving, economic investment, financial investment, business cycle, peak, recession, trough, expansion (recovery), growth trend (secular trend), aggregate demand (AD), real-balances effect, interest-rate effect, foreign-purchases effect, determinants of aggregate demand, wealth vs. income, investment
12 b – AS/AD Equilibrium Why the Great Malaise of the World Economy Continues in 2016 For the United States, 2015 was supposed to be the year that finally closed the book on the Great Recession that began back in 2008; instead, the U. S. recovery has been middling. . In early 2010, I warned in my book "Freefall, " which describes the events leading up to the Great Recession, that without the appropriate responses, the world risked sliding into what I called a "Great Malaise. " Unfortunately, I was right: We didn't do what was needed, and we have ended up precisely where I feared we would. Why the Great Malaise of the World Economy Continues in 2016 by Joseph Stiglitz, The World Post 01/04/2016 01: 20 pm ET | Updated Jan 04, 2016 http: //www. huffingtonpost. com/joseph-e-stiglitz/world-economy-2016_b_8908560. html
12 a – AD Why the Great Malaise of the World Economy Continues in 2016 The only cure for the world's malaise is an increase in aggregate demand. Far-reaching redistribution of income would help, as would deep reform of our financial system -- not just to prevent it from imposing harm on the rest of us, but also to get banks and other financial institutions to do what they are supposed to do: match long-term savings to long-term investment needs. Why the Great Malaise of the World Economy Continues in 2016 by Joseph Stiglitz, The World Post 01/04/2016 01: 20 pm ET | Updated Jan 04, 2016 http: //www. huffingtonpost. com/joseph-e-stiglitz/world-economy-2016_b_8908560. html
1. Which is an economic investment (I)? 1. 2. 3. 4. A student buys stock in Apple computers An investor buy a government bond A carpenter buys a hammer A professor buys new skis
1. Which is an economic investment (I)? 1. 2. 3. 4. A student buys stock in Apple computers An investor buy a government bond A carpenter buys a hammer A professor buys new skis Investment (economic investment): - spending on the production and accumulation of newly created capital goods such as machinery, tools, factories, and warehouses - example: a carpenter buying a hammer
2. Before the late 1700's, living standards in the richest part of the world compared to the poorest parts were ? 1. About five times higher 2. At most only two to three times higher 3. About 50 times higher 4. About the same
2. Before the late 1700's, living standards in the richest part of the world compared to the poorest parts were ? 1. About five times higher 2. At most only two to three times higher 3. About 50 times higher 4. About the same
3. During a recession: 1. 2. 3. 4. UE is high and IN is high UE is low and IN is low UE is high and IN is low UE is low and IN is high
3. During a recession: 1. 2. 3. 4. UE is high and IN is high UE is low and IN is low UE is high and IN is low UE is low and IN is high
4. This graph is: 1. S and D 2. Business Cycle 3. AD and AD 4. PPC
4. This graph is: 1. S and D 2. Business Cycle 3. AD and AD 4. PPC
The Business Cycle Peak: UE low; IN high Recession: UE increase; IN decrease Trough: UE high; IN low Recovery: UE decrease; IN increase CAUSES: changes in AD
5. DEFINE: The aggregate demand curve shows the: 1. inverse relationship between the price level and the quantity of real GDP purchased 2. Direct relationship between the price level and the quantity of real GDP produced 3. Inverse relationship between interest rates and the quantity of real GDP produced 4. Direct relationship between real-balances and the quantity of real GDP purchased
5. DEFINE: The aggregate demand curve shows the: 1. inverse relationship between the price level and the quantity of real GDP purchased 2. Direct relationship between the price level and the quantity of real GDP 3. Inverse relationship between interest rates and the quantity of real GDP produced 4. Direct relationship between real-balances and the quantity of real GDP purchased
6. DRAW: Which graph below correctly shows the aggregate demand (AD) curve? 1. 2. 3. 4. A B C D
6. DRAW: Which graph below correctly shows the aggregate demand (AD) curve? 1. 2. 3. 4. A B C D
DEFINE / DRAW: The AD Curve: - a schedule or curve that shows the total quantity of goods and services demanded (purchased) at different price levels - the inverse relationship between the price level and the amount of real GDP demanded
7. DESCRIBE: Which is NOT one of the reasons why the AD curve is downward sloping? 1. 2. 3. 4. Price effect Real-Balances (Wealth) effect Interest rate effect Foreign purchases effect
7. DESCRIBE: Which is NOT one of the reasons why the AD curve is downward sloping? 1. 2. 3. 4. Price effect Real-Balances (Wealth) effect Interest rate effect Foreign purchases effect 2. PL up causes decrease value of financial assets causes RDO demanded down 3. PL up causes increase in interest rates causes RDO demanded down 4. PL in US up causes more imports from lower priced foreign products causes RDO demanded down
For ALL Graphs: • Define – what does the graph represent • Draw – be able to draw and label • Describe the Shape – why does the graph have the shape that it does? • Sometimes: Determinants shift the graph It would be a good idea to prepare 3 x 5 cards that Define, Draw, and Describe, all graphs.
8. Which of the following factors will shift AD 1 to AD 3? 1. increase in savings 2. decrease in taxes 3. decrease in household indebtedness 4. increase in investment
8. Which of the following factors will shift AD 1 to AD 3? 1. increase in savings 2. decrease in taxes 3. decrease in household indebtedness 4. increase in investment
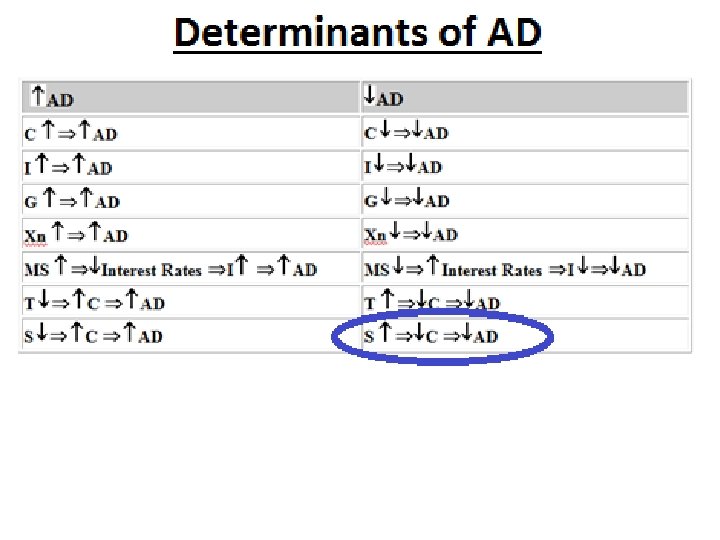
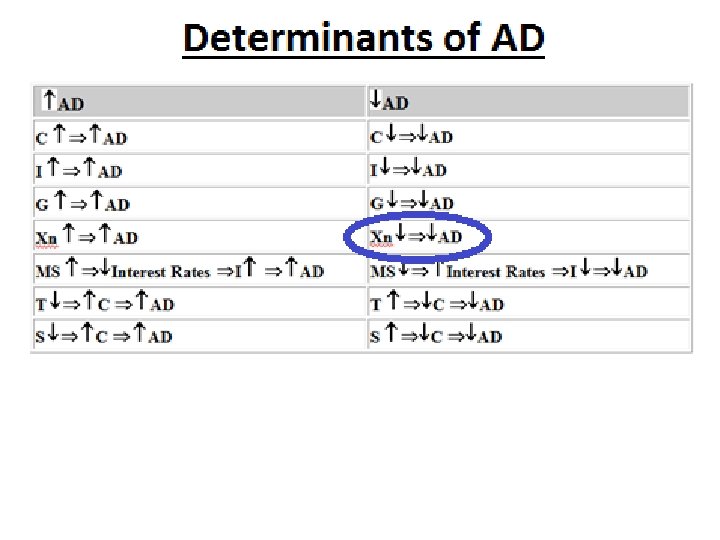
Determinants of AD If these change then AD shifts either left (increase) or right (decrease)
9. Which of the following factors will shift AD 1 to AD 3? 1. increase in gov’t spending 2. decrease in taxes 3. decrease in net exports 4. increase in money supply
9. Which of the following factors will shift AD 1 to AD 3? 1. increase in gov’t spending 2. decrease in taxes 3. decrease in net exports 4. increase in money supply
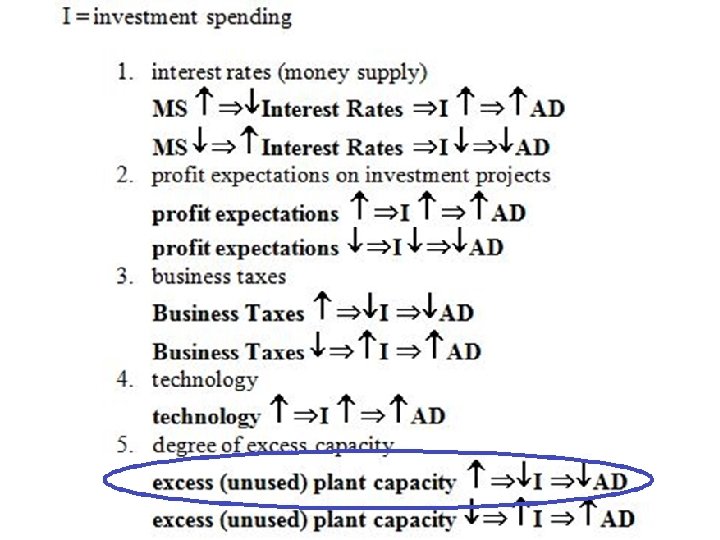
10. Which is correct when the MS increases? 1. A decrease in the interest rate CAUSES a decrease in Investment which CAUSES a decrease in AD 2. A decrease in the interest rate CAUSES an increase in Investment which CAUSES an increase in AD 3. An increase in the interest rate CAUSES a decrease in Investment which CAUSES a decrease in AD 4. An increase in the interest rate CAUSES an increase in Investment which CAUSES an increase in AD
10. Which is correct when the MS increases? 1. A decrease in the interest rate CAUSES a decrease in Investment which CAUSES a decrease in AD 2. A decrease in the interest rate CAUSES an increase in Investment which CAUSES an increase in AD 3. An increase in the interest rate CAUSES a decrease in Investment which CAUSES a decrease in AD 4. An increase in the interest rate CAUSES an increase in Investment which CAUSES an increase in AD
Memorize this!
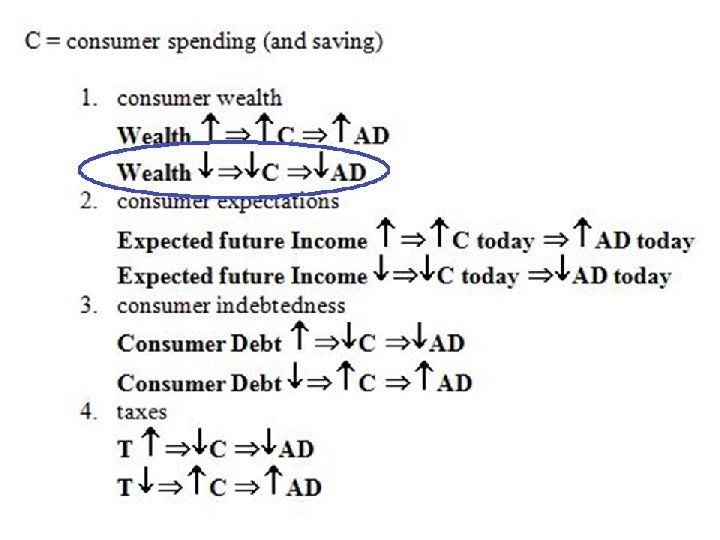
11. In 2007 home values began to decline significantly. Which is correct as a result? 1. Investment increased causing AD to go up 2. Taxes increased causing AD to go down 3. Wealth decreased causing AD to go down 4. Value of the $ increased causing AD to go down
11. In 2007 home values began to decline significantly. Which is correct as a result? 1. Investment increased causing AD to go up 2. Taxes increased causing AD to go down 3. Wealth decreased causing AD to go down 4. Value of the $ increased causing AD to go down
12. Assume business have increased excess capacity. Which is correct as a result? 1. Investment decreased causing AD to go down 2. Consumption decreased causing AD to go down 3. Wealth decreased causing AD to go down 4. Cons. Debt increased causing AD to go down
12. Assume business have increased excess capacity. Which is correct as a result? 1. Investment decreased causing AD to go down 2. Consumption decreased causing AD to go down 3. Wealth decreased causing AD to go down 4. Cons. Debt increased causing AD to go down
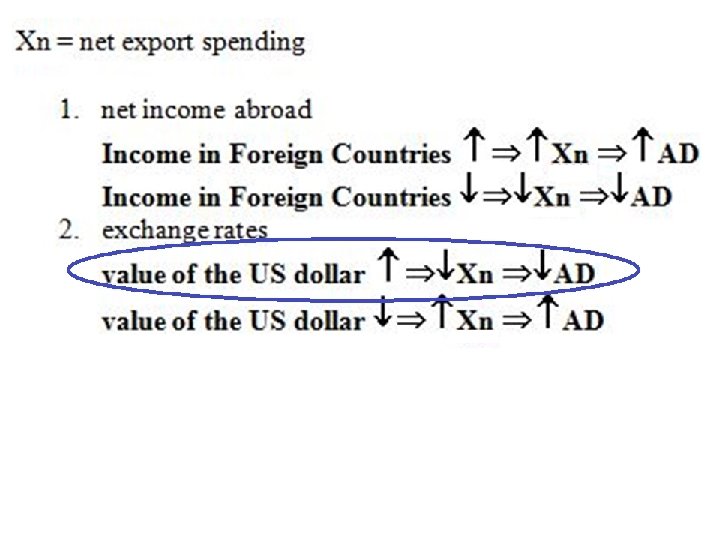
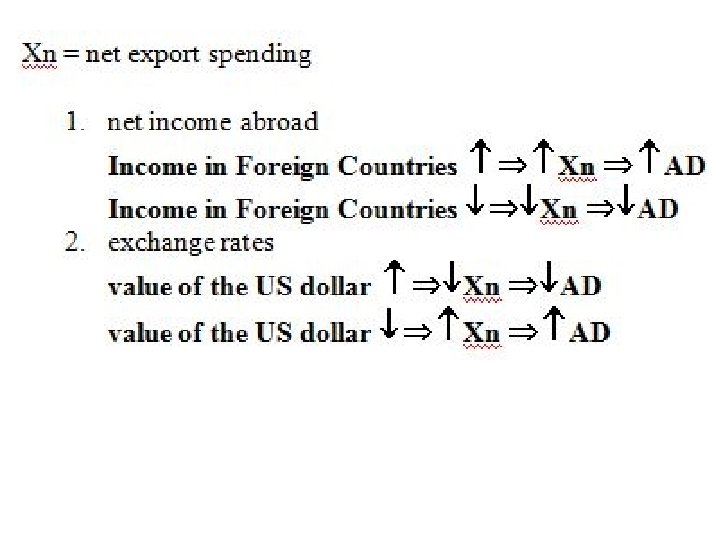
13. Assume the $ appreciates. Which is correct as a result? 1. 2. 3. 4. Exports decrease causing AD to go down Consumer Debt increases causing AD to go down Wealth increases causing AD to go up Net Exports decrease causing AD to go down
13. Assume the $ appreciates. Which is correct as a result? 1. 2. 3. 4. Exports decrease causing AD to go down Consumer Debt increases causing AD to go down Wealth increases causing AD to go up Net Exports decrease causing AD to go down
OUR GOAL: To see what happens to: – Unemployment (UE) – Inflation (IN) – Economic Growth (EG) To do this we will need both AD and AS and then find the macroeconomic equilibrium