12 6 NOTES Phase Diagrams Phase Diagrams graphs


")


- Slides: 22
12. 6 NOTES Phase Diagrams
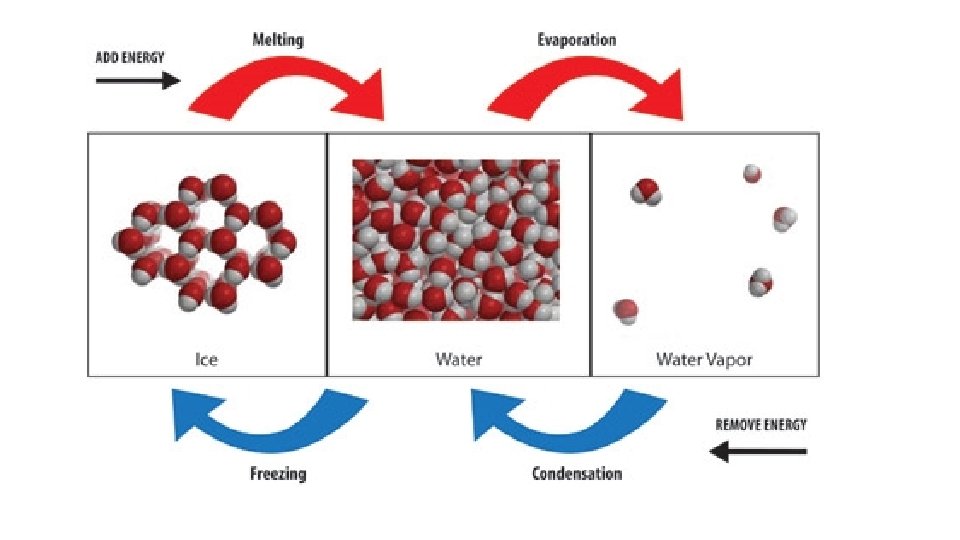
• Phase Diagrams: graphs that show the pressure and temperature relationships for all three phases of a substance • Phase Changes: the transition from one state of matter to another •
• Endothermic: requires energy • Melting • Boiling/Vaporization • Sublimation • Exothermic: releases energy • Freezing • Condensation • Deposition
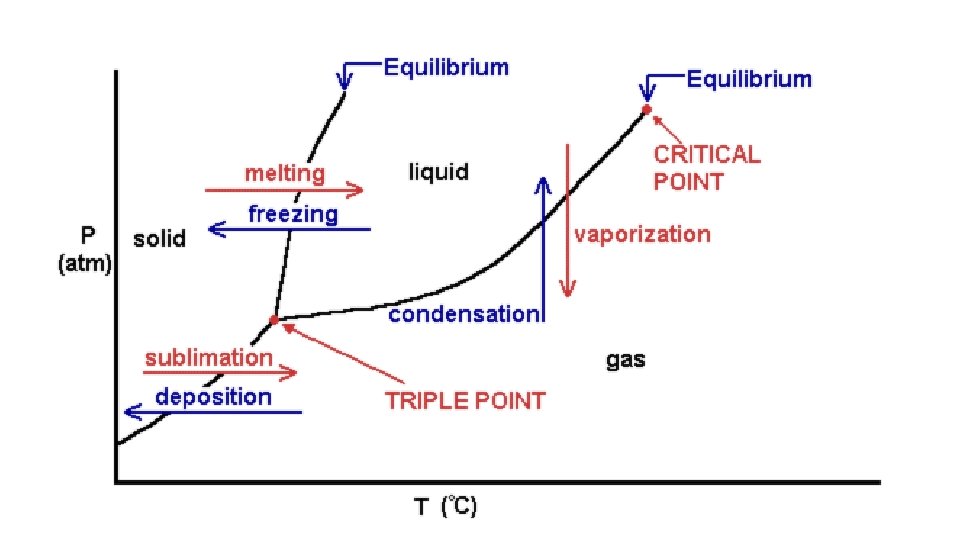
Phase Diagrams • “Normal” MP/FP and BP/CP: the temperatures where phase changes (melting/freezing and boiling/condensing) occur at standard pressure (1 atm, 760 torr, 760 mm. Hg). • The higher the MP or BP of a substance, the stronger the attractive forces.
• Triple Point: The temperature and pressure combination where all three phases exist and all six phase changes occur simultaneously. • Critical Point: The temperature and pressure combination above which a gas cannot be liquefied. • The higher the critical point, the weaker the attractive forces. These substances are said to be difficult to liquefy.
• Density of the Solid • Typical: the solid is more dense than the liquid • The slope of the solid-liquid boundary is positive • Atypical: the solid is less dense than the liquid • The slope of the solid-liquid boundary is negative
Examples: Use the figure above to answer the following questions: What is the normal melting point of the substance? What is the normal boiling point of the substance? Which phase is most dense? What is the triple point of the substance? What is the critical point of the substance? If the substance at 20ºC and 0. 2 atm is heated to 90 ºC (pressure is held constant), what phase change occurs? • If the substance at 80ºC and 0. 8 atm is cooled to 60 ºC (pressure is held constant), what phase change occurs? • •
• 2. Vaporization process by which a liquid changes to a gas or vapor; phase change from a liquid to a gas • - difference b/t evaporation and BP = evaporation occurs at all temps and only at the surface of the liquid while boiling occurs at a specific temp and pressure and occurs throughout the liquid • body sweat – requires energy to evaporate liquid, when liquid does evaporate it takes (heat) energy with it;
• Vapor Pressure - pressure exerted by a vapor over a liquid • an increase in temp would increase vapor pressure • vapor – gas phase of a substance that is normally a liquid at room temp; a. k. a. equilibrium vapor pressure • Boiling point - the temp @ which the vapor pressure of a liquid equals the atmospheric (external) pressure; if walls of container are smooth, temp of liquid may get higher than that of BP, use boiling chip to prevent spattering; vacuum pump demo
• 3. Sublimation solid directly to gas; I 2 and CO 2 (solids) sublime @ room temp • - examples – moth balls and solid air freshners;
• B. Phase changes that release energy Exothermic • 1. Condensation process by which gas becomes a liquid • - clouds form when a layers of air high above the Earth’s surface cool • - clouds = small H 2 O droplets; rain = large droplets
• 2. Deposition change from gas to solid; snowflakes and frost; H 2 O(g) to solid; • 3. Freezing change from liquid to solid; FP and MP are the same temp; •
• C. Phase diagrams - phase is dependent on temp and pressure • - T and P can have opposite effects on a substance • - i. e. increase temp, cause L G while increase pressure causes G L
• - plot of pressure vs. temperature shows in which phase a substance exists under different conditions of temp. and pressure • - any point on the line will represent gas-liquid boundary/solid-liquid boundary/gas-solid boundary • - gas/liquid boundary represents Boiling Point at that pressure • - solid/liquid boundary represents Melting Point at that pressure
• if line is to the right represents the solid is more dense than the liquid and the MP increases as pressure increases (most substances) • - if line is to the left like water, represents solid is less dense than liquid and MP decreases with pressure • - if start at high P, water will go from liquid to solid to gas; why freeze drying works • - place fresh veggies in freezer 1 st water is frozen and then as pressure drops ice quickly sublimes to lock in freshness and taste;
• Phase diagram for water Phase diagram for carbon dioxide
• - Triple point - point at which all 3 phases occur simultaneously with the 6 phase changes; if in closed system would be very odd looking; • - Critical temperature and pressure point at which no matter how much pressure is applied, gas will not liquefy - corresponds to pressure as well; lower the critical temp, harder a substance is to liquefy;