1162022 12 ORM 1 F 1 ORM 1


 ORM")

 表型 Albumin* (g L-1)")


 of serum quinidine after a single oral dose of 200")

. x s. ORM 1 表型 F 1 Time")

 ORM 1 S表型: > ORM 1 F 1表型 ORM 1 F 1 S表型:介于上述两者之间")
 of Celecoxib in i. v. -dosed male and female")


 组 别 人数 年龄 ALB GLB ALT AST (岁) 青年组")
 人数(%) 533. 9 ~ 594.")

- Slides: 61
结 果 1/16/2022 12
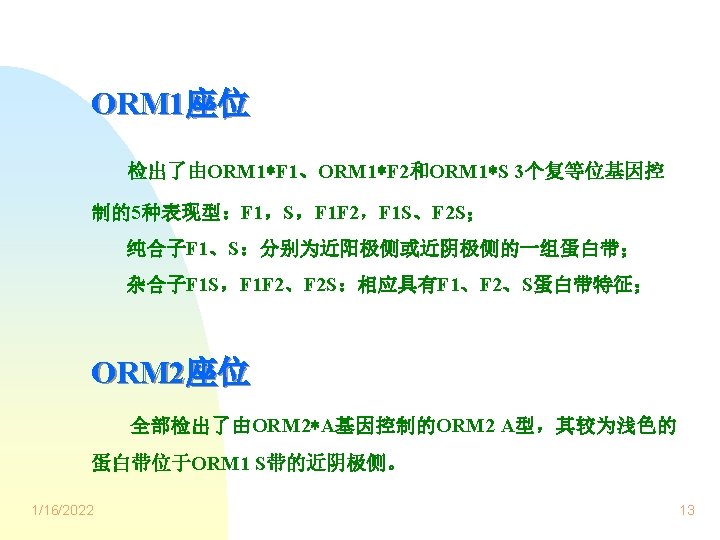
ORM 1 F 1 ORM 1 F 2 ORM 1 S ORM 2 A 1 2 3 4 5 6 7 8 9 等电聚焦电泳-免疫印迹图 Lane 1: ORM 1 F 2 Lanes 2, 6: ORM 1 F 1 Lanes 3, 9: ORM 1 S Lanes 4, 5, 7: ORM 1 F 1 S Lane 8: ORM 1 F 2 S 1/16/2022 14
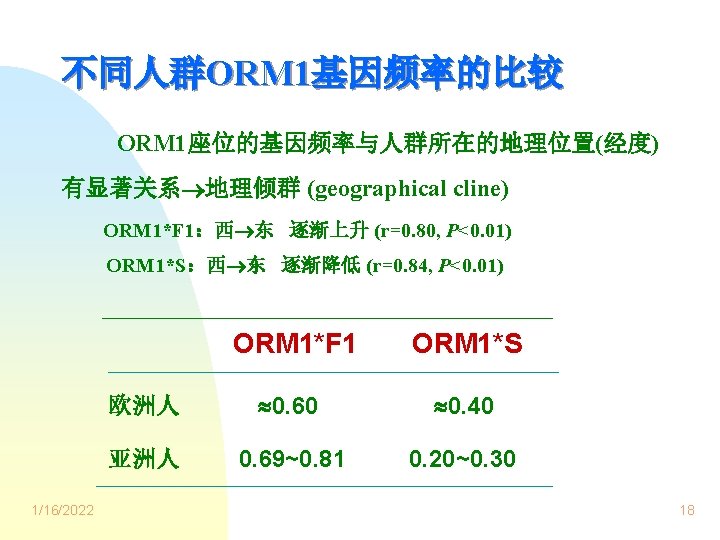
ORM 1表型-基因频率 n n 1/16/2022 ORM 1座位: F 1: 47. 27% S: 5. 46% F 1 F 2: 3. 18% F 1 S: 43. 64% F 2 S: 0. 45% ORM 1基因频率: ORM 1 F 1: 0. 7068 ORM 1 F 2: 0. 0182 ORM 1 S : 0. 2750 15
表 1 中国南京地区汉族人ORM 1表型及基因频率 表 型 观察值 期望值 基 因 频 率 (n) ORM 1 F 1 104 109. 91 ORM 1 F 1=0. 7068 ORM 1 F 2 0 0. 07 ORM 1 F 2=0. 0182 12 16. 64 ORM 1 S =0. 2750 7 5. 66 2 = 1. 5074 ORM 1 F 1 S 96 85. 52 ORM 1 F 2 S 1 2. 20 220. 00 ORM 1 S ORM 1 F 1 F 2 Total 1/16/2022 df = 3 P > 0. 05 16
表 健康受试者血清ORM和白蛋白浓度. x s. ORM 1 n ORM* (mg L-1) 表型 Albumin* (g L-1) F 1 10 573. 2 29. 3 57. 5 3. 0 S 8 553. 8 31. 2 57. 6 1. 5 10 569. 8 40. 1 58. 4 1. 5 F 1 S ORM 1 F 1, S和 F 1 S三组表型间比较,* P>0. 05. 1/16/2022 24
Fig. Serum total quinidine concentration-time curve after a single oral dose of 200 mg quinidine sulfate in the healthy subjects with the three ORM 1 phenotypes. x s. ○─○: ORM 1 F 1(n=10),●─●: ORM 1 S(n=8),□─□: ORM 1 F 1 S(n=10) 1/16/2022 25
Fig. Unbound quinidine serum concentration-curve after a single oral dose of 200 mg quinidine sulfate in the healthy subjects with the three ORM 1 phenotypes. x s. ○─○: ORM 1 F 1(n=10),●─●: ORM 1 S(n=8),□─□: ORM 1 F 1 S(n=10) 1/16/2022 26
*** Fig. Percentage for unbound serum quinidine after a single oral dose of 200 mg quinidine sulfate in the healthy subjects with the three ORM 1 phenotypes. x s. : ORM 1 F 1(n=10), : ORM 1 S(n=8), : ORM 1 F 1 S(n=10) *** P<0. 01 vs ORM 1 F 1 phenotype. 1/16/2022 27
Tab. Pharmacokinetics parameters of total quinidine after a single oral dose of 200 mg quinidine sulfate in the healthy male subjects with the three ORM 1 phenotypes. x s. ORM 1 n Phenotypes F 1 S F 1 S 1/16/2022 10 8 10 ke Cmax t 1/2 Cl/F Vd AUC h-1 g L-1 h h L h-1 L kg 1 g h L-1 0. 124 1015. 5 2. 2 5. 65 23. 60 0. 012 220. 5 0. 3 0. 55 5. 16 0. 57 1916. 2 0. 113 1055. 9 1. 8 6. 22 23. 06 3. 45 8857. 2 0. 015 232. 5 0. 90 3. 96 0. 61 1257. 3 0. 120 988. 6 1. 9 6. 06 24. 62 3. 23 8543. 6 0. 029 145. 7 0. 4 1. 39 5. 68 0. 58 2047. 9 l 3. 09 8845. 3 28
Tab. Protein binding percentage(%) of serum quinidine after a single oral dose of 200 mg quinidine sulfate in the healthy male subjects with the three ORM 1 phenotypes. x s. ORM 1 n Phenotypes Time after dosing (h) 8 12 24 F 1 10 93. 64 2. 98 91. 88 4. 11 80. 21 6. 13 S 8 94. 38 0. 89 93. 18 1. 82 89. 31 4. 83*** 10 94. 38 1. 27 92. 26 2. 57 87. 26 3. 42*** F 1 S *** P< 0. 01 vs ORM 1 F 1 phenotype 1/16/2022 29
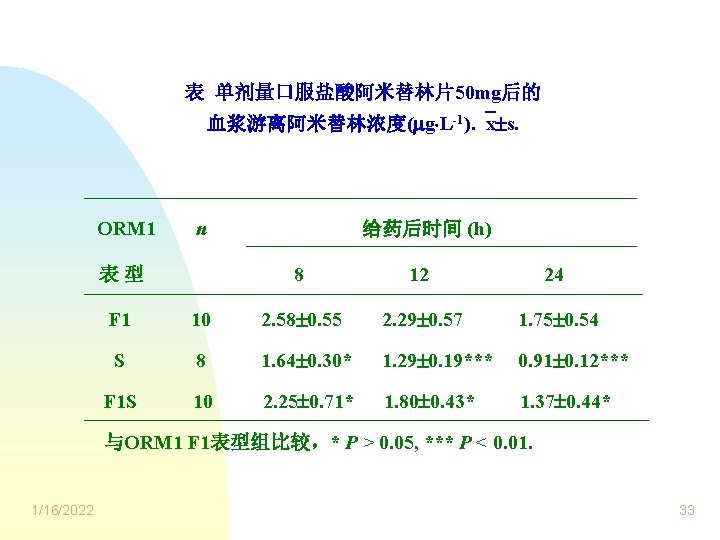
表 单剂量口服盐酸阿米替林片50 mg后的血浆阿米替林总浓度 ( g L-1). x s. ORM 1 表型 F 1 Time (h) 1 3 4 5 6 5. 36 8. 65 10. 21 10. 24 8. 77 7. 84 8. 51 19. 96 25. 06 32. 54 29. 28 24. 30 19. 55 (n=8) 5. 17 6. 41 F 1 S 10. 25 24. 98 31. 44 37. 42 34. 11 27. 45 (n=10) 5. 56 1/16/2022 8 10 12 24 36 10. 32 26. 30 35. 73 39. 70 35. 62 31. 58 27. 17 20. 79 14. 45 9. 42 5. 06 (n=10) 4. 80 S 2 6. 29 7. 13 8. 25 8. 41 9. 88 4. 40 8. 81 3. 93 7. 19 3. 10 7. 45 6. 03 4. 13 2. 76 15. 96 11. 56 7. 01 4. 54 3. 91 2. 11 1. 37 0. 98 24. 67 18. 86 13. 44 8. 83 4. 99 6. 61 6. 57 3. 54 3. 61 2. 10 31
表 单剂量口服盐酸阿米替林片50 mg后血浆阿米替林总浓度 的药物动力学参数. x s. ORM 1 n Tmax Cmax 表型 h g L-1 L h-1 L kg 1 h h 3. 9 40. 31 86. 83 14. 88 2. 45 21. 22 535. 5 639. 9 0. 6 10. 25 29. 97 5. 45 0. 80 7. 41 175. 2 220. 1 3. 9 34. 55 92. 91 17. 26 2. 52 22. 97 424. 8 544. 0 0. 8 7. 56 5. 16 0. 69 5. 30 67. 4 120. 1 38. 79 86. 00 13. 97 2. 48 23. 37 496. 8 612. 2 0. 97 8. 61 132. 3 182. 2 F 1 S F 1 S 10 8 10 4. 1 0. 6 1/16/2022 Cl/F 17. 69 9. 08 29. 17 Vd 3. 98 t 1/2 AUC 0~36 AUC 0~∞ g h L-1 35
阿米替林血浆蛋白结合率(%) ORM 1 S表型: > ORM 1 F 1表型 ORM 1 F 1 S表型:介于上述两者之间 ORM 1 n 给药后时间(h) 8 表型 12 24 90. 05 2. 42 82. 77 4. 05 79. 99 4. 39 F 1 10 S 8 91. 35 2. 24* 88. 58 2. 22*** 86. 76 2. 08*** F 1 S 10 90. 71 2. 36* 85. 98 3. 95* 83. 43 4. 65* 与ORM 1 F 1表型组比较,* P > 0. 05, *** P < 0. 01. 1/16/2022 36
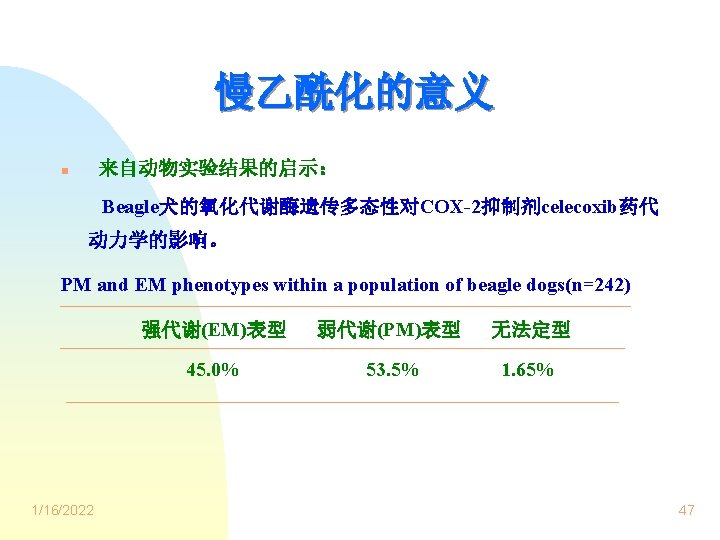
TAB. Pharmacokinetic parameters (mean ±s) of Celecoxib in i. v. -dosed male and female dogs Populationa Sex/n Male/11 EM PM a T 1/2 h Cl ml/min/kg Vd L/kg AUC 0 -∞ µg/ml*h 1. 77± 0. 9 19. 2± 7. 7 2. 63± 1. 37 4. 95± 1. 80 Female/8 1. 66± 0. 43 16. 9± 4. 2 2. 32± 0. 41 5. 20± 1. 23 M and F/19 1. 72± 0. 79 18. 2± 6. 4 2. 50± 1. 07 5. 05± 1. 55 Male/8 4. 69± 1. 25 7. 43± 1. 23 2. 95± 0. 60 11. 5± 2. 0 Female/11 5. 54± 1. 24 6. 95± 1. 55 3. 27± 0. 72 12. 5± 2. 6 M and F/19 5. 18± 1. 29 7. 15± 1. 41 3. 13± 0. 67 12. 1± 2. 33 Celecoxib T 1/2, Cl, and AUC 0 -∞ were statistically different between EM and PM dogs (p<0. 001). Celecoxib Vd were statistically different between EM and PM dogs (p<0. 01). 1/16/2022 From Paulson et al. Drug Metab Dispos 1999; 27(10): 1133 -42 48
Tab Plasma concentration and CAc. INH/CINH ratio in various NAT 2 genotypes 1/16/2022 Genotype n CINH mol/L CAc. INH mol/L Ratio CAc. INH/CINH m/m 7 17. 43 8. 98 11. 04 8. 21 0. 67 0. 34 m/w 22 17. 10 12. 82 13. 09 8. 33 0. 88 0. 40 w/w 17 12. 97 15. 25 18. 96 21. 16 1. 69 0. 66 Total 46 15. 62 13. 21 14. 94 14. 52 1. 15 0. 65 51
Fig Distribution of the Ac. INH/INH ratio in three NAT 2 genotypes in 46 Chinese pulmonary tuberculosis patients 1/16/2022 52
谢 谢! 1/16/2022 55
表 健康受试者的一般资料( x s) 组 别 人数 年龄 ALB GLB ALT AST (岁) 青年组 (18~23岁) 172 20. 2 1. 5 非青年组 41 35. 1 (24~59岁) 合 计 9. 5 213 23. 0 7. 3 1/16/2022 (g/L) 血 糖 尿素氮 肌酐 尿酸 (u/L) (mmol/L) ( mol/L) 51. 6 22. 0 13. 6 23. 3 4. 6 5. 4 85. 0 358. 6 7. 8 7. 4 0. 5 1. 2 14. 5 59. 6 49. 1 23. 1 14. 5 24. 6 4. 5 5. 7 101. 5 377. 5 9. 8 0. 7 1. 0 10. 6 60. 5 13. 7 23. 5 4. 6 5. 5 88. 1 362. 2 0. 5 1. 2 15. 3 60. 1 4. 1 2. 9 2. 7 6. 0 51. 1 22. 2 4. 1 3. 6 10. 1 9. 0 7. 9 57
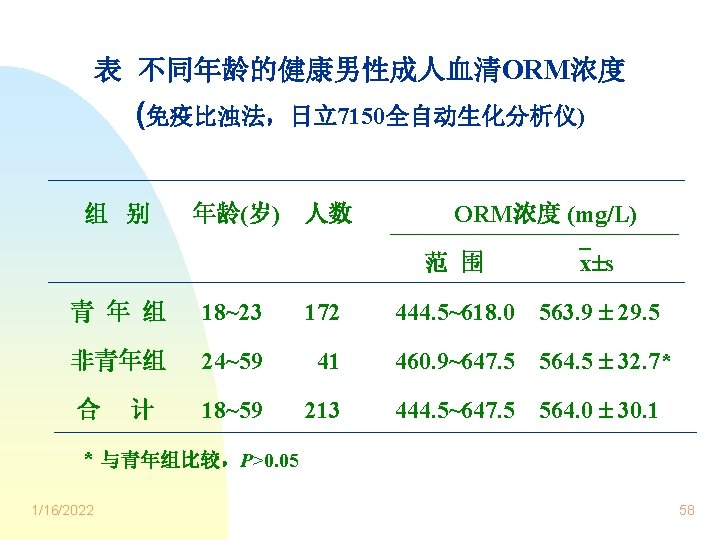
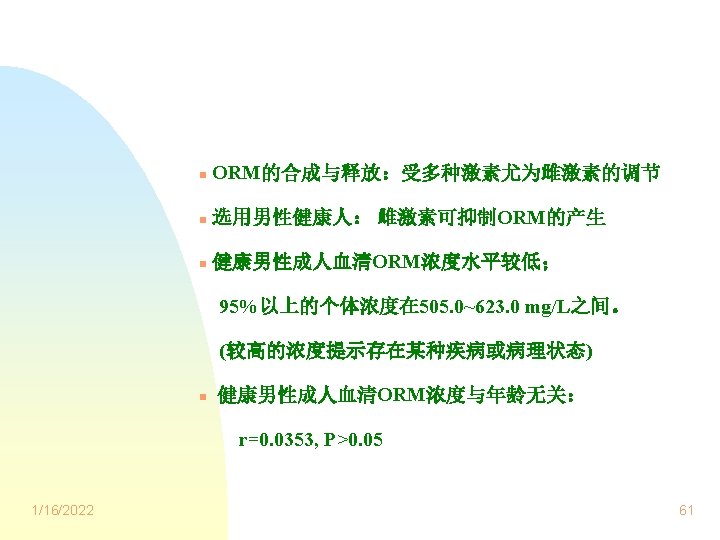
表 健康男性成人血清ORM浓度的实际分布 与理论分布比较 x s ORM浓度范围 实际分布 理论分布 (mg/L) 人数(%) 533. 9 ~ 594. 1 160 (75. 12) 68. 27 x 1. 96 s 564. 0 1. 96× 30. 1 505. 0 ~ 623. 0 206 (96. 71) 95. 00 x 2. 58 s 564. 0 2. 58× 30. 1 486. 3 ~ 641. 7 209 (98. 12) 99. 00 x 1 s 1/16/2022 564. 0 1× 30. 1 59