
11 th EMS 10 th ECAM Berlin Deutschland

11 th EMS & 10 th ECAM Berlin, Deutschland The influence of the new ECMWF Ensemble Prediction System resolution on wind power forecast accuracy and uncertainty estimation S. Alessandrini, S. Sperati, G. Decimi, P. Pinson 2, 09/2011 (2 DTU, Denmark )
Outline • This work is a prosecution of the presentation of EMS 2010 • A comparison of wind power deterministic forecast performances based on old and new version ECMWF GM during two periods (2008, 2011) is shown • The new version of the EPS (ECMWF) is applied to understand if it is possible to increase the performances in the forecast of power prediction accuracy 2
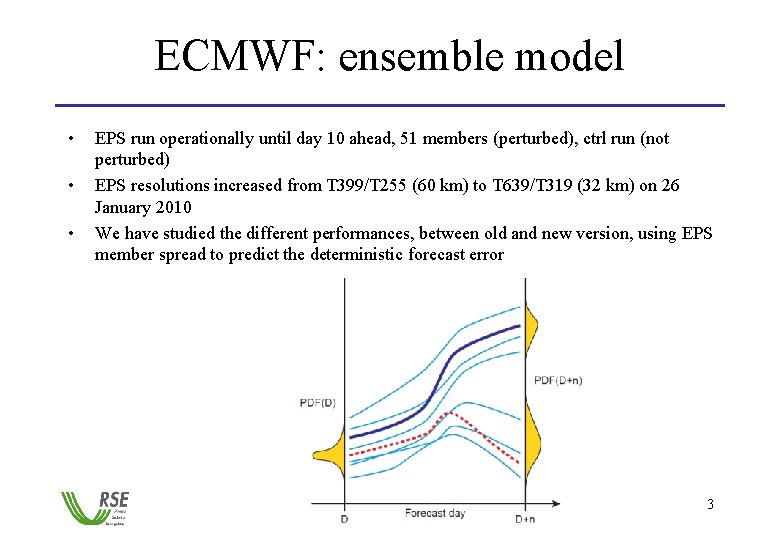
ECMWF: ensemble model • • • EPS run operationally until day 10 ahead, 51 members (perturbed), ctrl run (not perturbed) EPS resolutions increased from T 399/T 255 (60 km) to T 639/T 319 (32 km) on 26 January 2010 We have studied the different performances, between old and new version, using EPS member spread to predict the deterministic forecast error 3
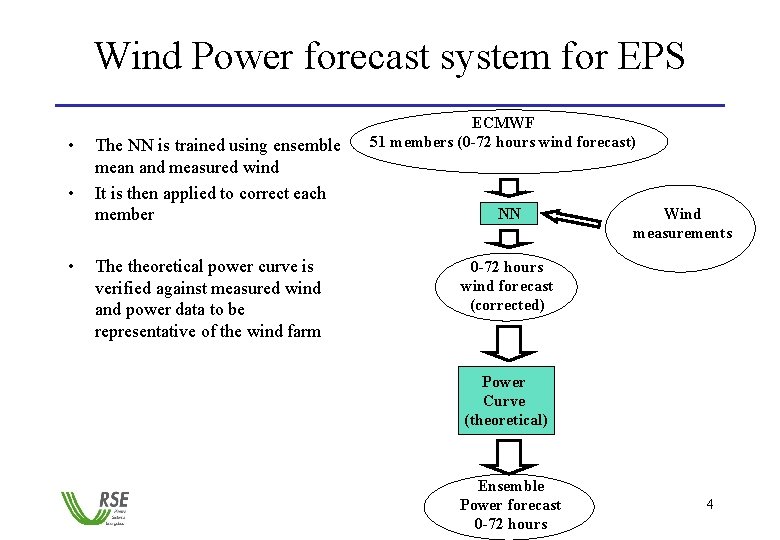
Wind Power forecast system for EPS • • • The NN is trained using ensemble mean and measured wind It is then applied to correct each member The theoretical power curve is verified against measured wind and power data to be representative of the wind farm ECMWF 51 members (0 -72 hours wind forecast) NN Wind measurements 0 -72 hours wind forecast (corrected) Power Curve (theoretical) Ensemble Power forecast 0 -72 hours 4

Deterministic Wind Power forecast system used at RSE ECMWF deterministic forecast model 0 -72 hours wind forecast NN Power measurements Power forecast 0 -72 hours 5
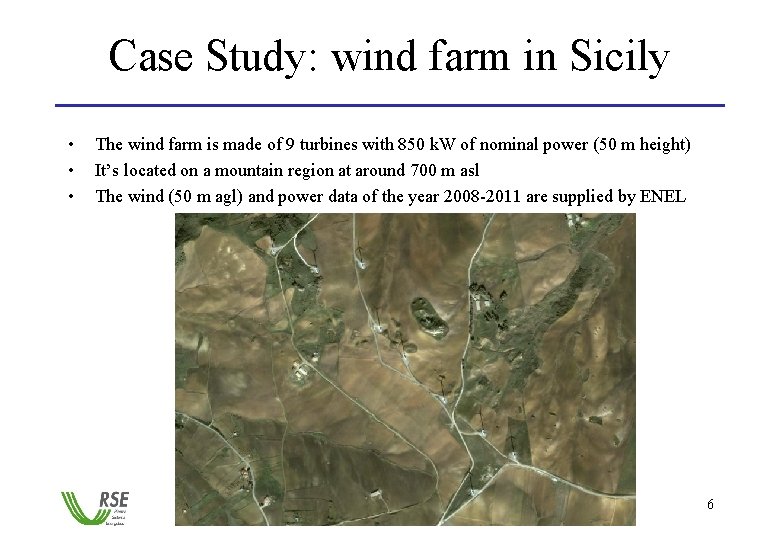
Case Study: wind farm in Sicily • • • The wind farm is made of 9 turbines with 850 k. W of nominal power (50 m height) It’s located on a mountain region at around 700 m asl The wind (50 m agl) and power data of the year 2008 -2011 are supplied by ENEL 6
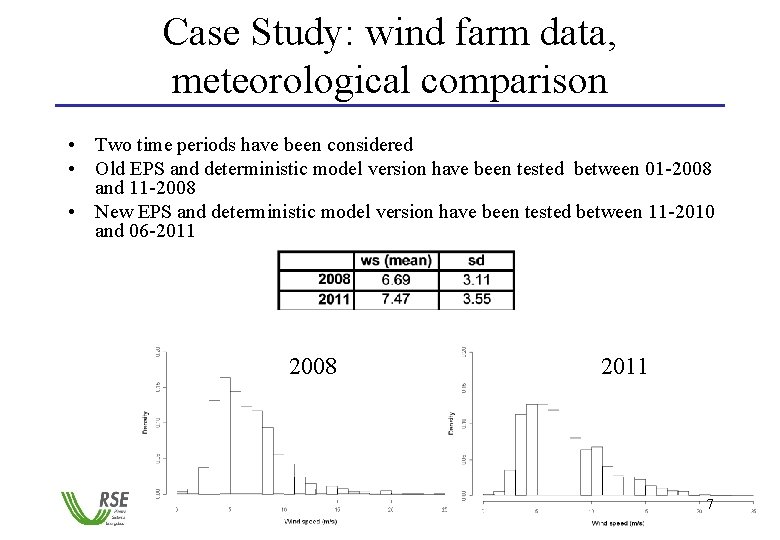
Case Study: wind farm data, meteorological comparison • Two time periods have been considered • Old EPS and deterministic model version have been tested between 01 -2008 and 11 -2008 • New EPS and deterministic model version have been tested between 11 -2010 and 06 -2011 2008 2011 7
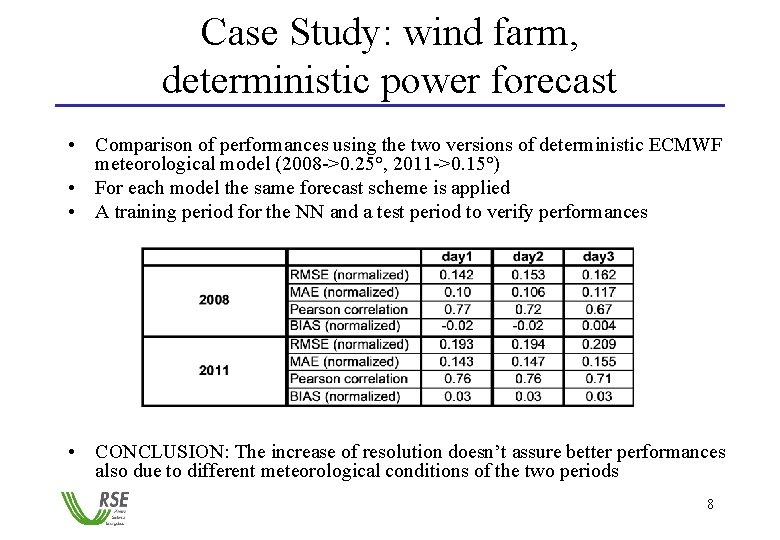
Case Study: wind farm, deterministic power forecast • Comparison of performances using the two versions of deterministic ECMWF meteorological model (2008 ->0. 25°, 2011 ->0. 15°) • For each model the same forecast scheme is applied • A training period for the NN and a test period to verify performances • CONCLUSION: The increase of resolution doesn’t assure better performances also due to different meteorological conditions of the two periods 8
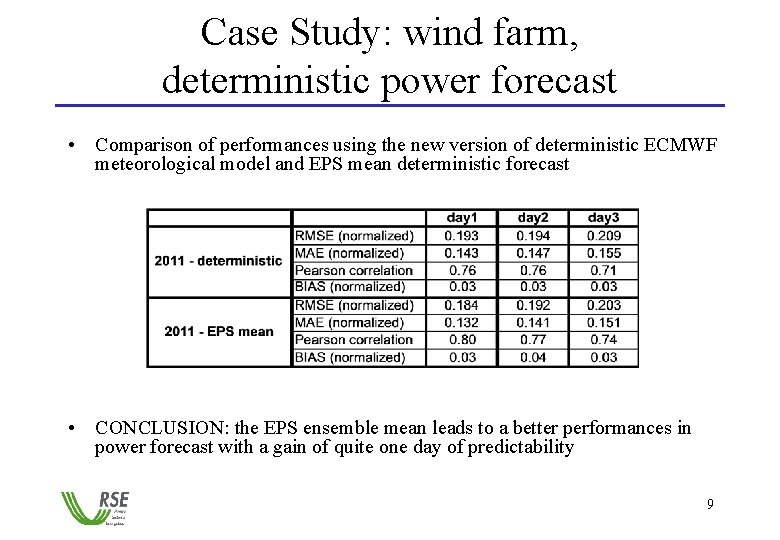
Case Study: wind farm, deterministic power forecast • Comparison of performances using the new version of deterministic ECMWF meteorological model and EPS mean deterministic forecast • CONCLUSION: the EPS ensemble mean leads to a better performances in power forecast with a gain of quite one day of predictability 9
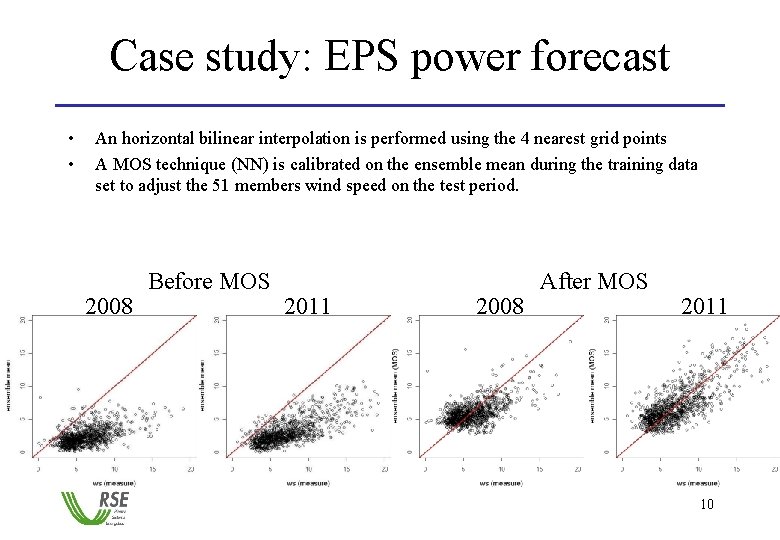
Case study: EPS power forecast • • An horizontal bilinear interpolation is performed using the 4 nearest grid points A MOS technique (NN) is calibrated on the ensemble mean during the training data set to adjust the 51 members wind speed on the test period. 2008 Before MOS 2011 2008 After MOS 2011 10
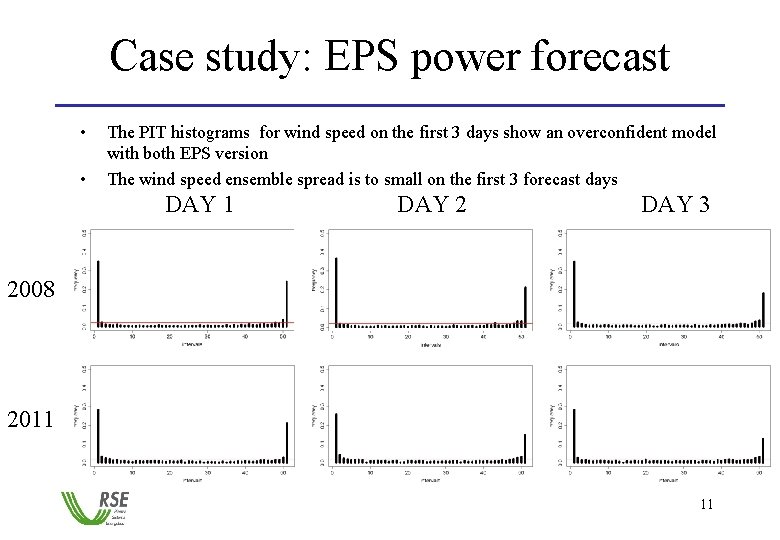
Case study: EPS power forecast • • The PIT histograms for wind speed on the first 3 days show an overconfident model with both EPS version The wind speed ensemble spread is to small on the first 3 forecast days DAY 1 DAY 2 DAY 3 2008 2011 11
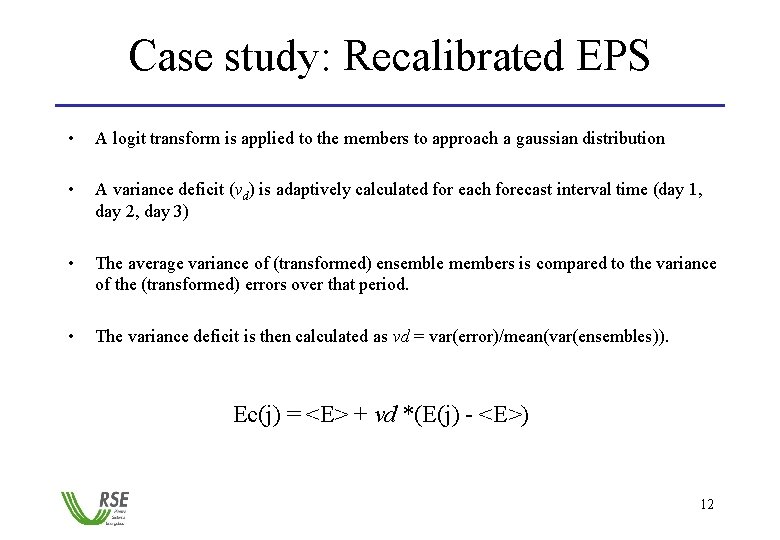
Case study: Recalibrated EPS • A logit transform is applied to the members to approach a gaussian distribution • A variance deficit (vd) is adaptively calculated for each forecast interval time (day 1, day 2, day 3) • The average variance of (transformed) ensemble members is compared to the variance of the (transformed) errors over that period. • The variance deficit is then calculated as vd = var(error)/mean(var(ensembles)). Ec(j) = <E> + vd *(E(j) - <E>) 12
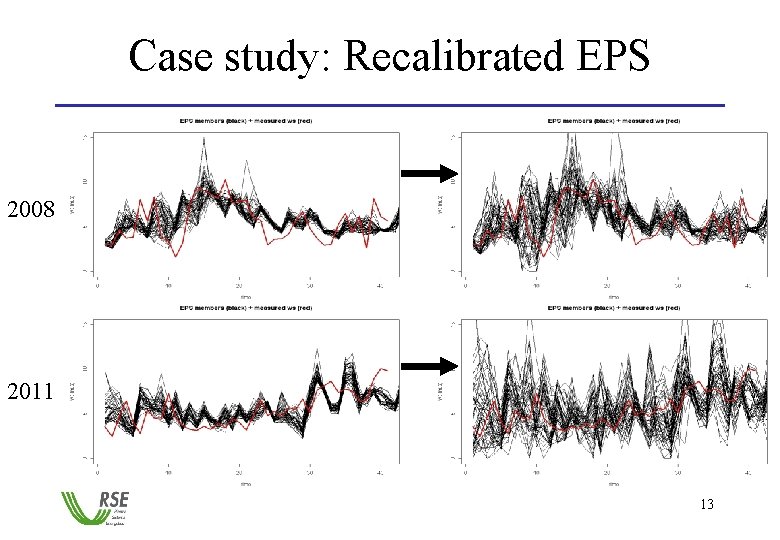
Case study: Recalibrated EPS 2008 2011 13
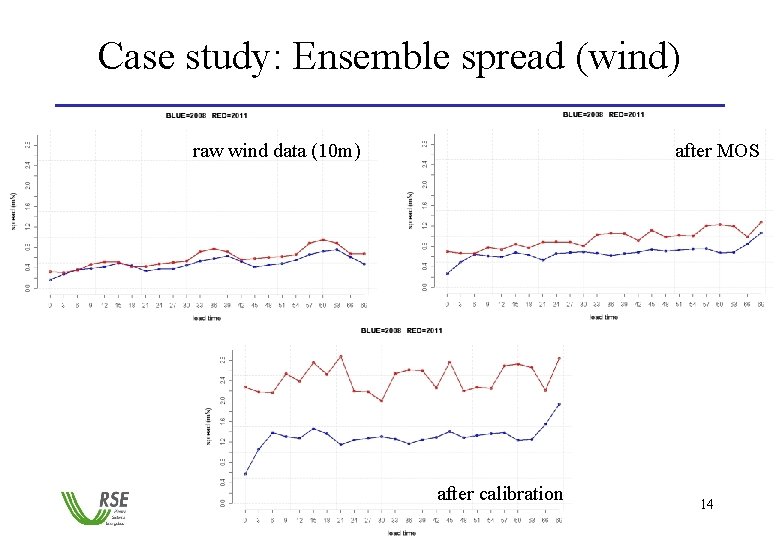
Case study: Ensemble spread (wind) raw wind data (10 m) after MOS after calibration 14
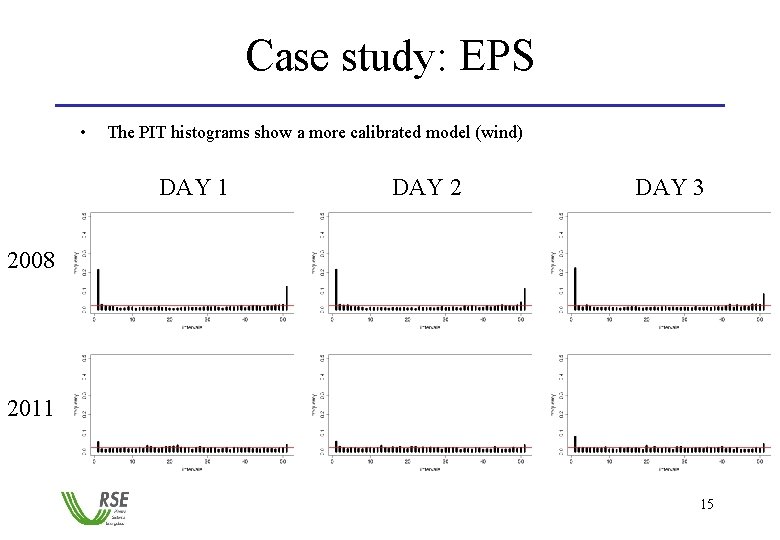
Case study: EPS • The PIT histograms show a more calibrated model (wind) DAY 1 DAY 2 DAY 3 2008 2011 15
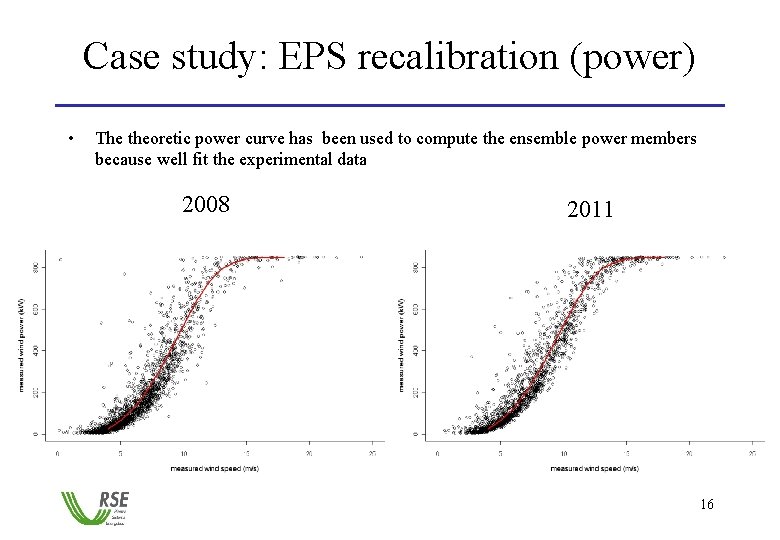
Case study: EPS recalibration (power) • The theoretic power curve has been used to compute the ensemble power members because well fit the experimental data 2008 2011 16
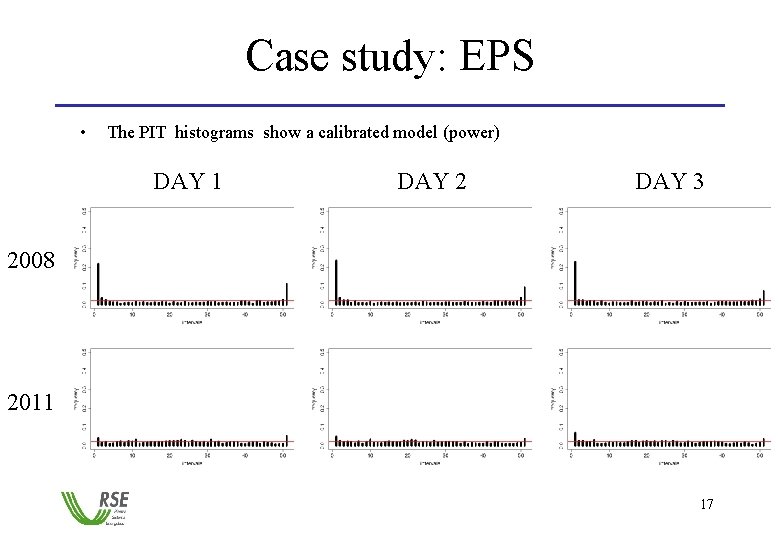
Case study: EPS • The PIT histograms show a calibrated model (power) DAY 1 DAY 2 DAY 3 2008 2011 17

Case study: Deterministic errors vs ensemble spread (power) Statistical comparison between average daily spread vs daily RMSE Of deterministic power forecast during the test period 18

Case study: Deterministic errors vs ensemble spread (power) DAY 1 DAY 2 DAY 3 2008 70% 2011 76% 19
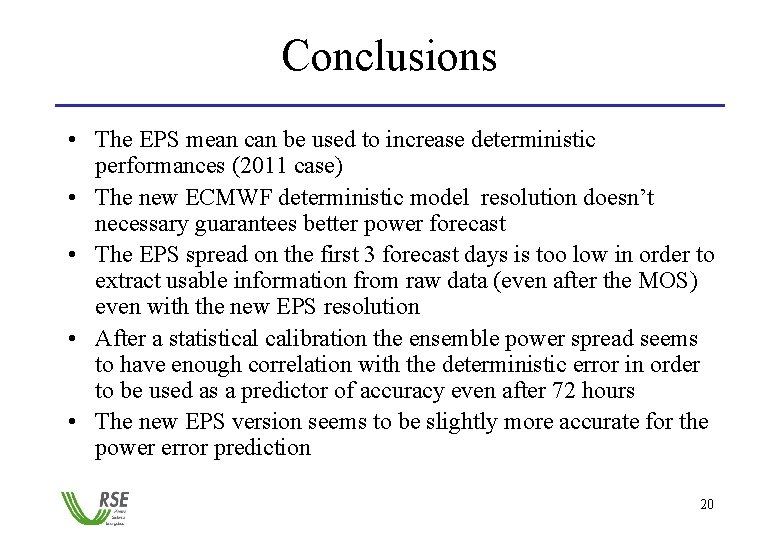
Conclusions • The EPS mean can be used to increase deterministic performances (2011 case) • The new ECMWF deterministic model resolution doesn’t necessary guarantees better power forecast • The EPS spread on the first 3 forecast days is too low in order to extract usable information from raw data (even after the MOS) even with the new EPS resolution • After a statistical calibration the ensemble power spread seems to have enough correlation with the deterministic error in order to be used as a predictor of accuracy even after 72 hours • The new EPS version seems to be slightly more accurate for the power error prediction 20
- Slides: 20