11 I want to test different soap products


- Slides: 19

#11 I want to test different soap products to see which product kills the most bacteria on my hands. 1. What is the independent variable in this experiment? 2. What is the dependent variable? 3. What would be the control group? 4. List 2 constants.

All Class Data Product Control Group Experimental group Anti bac foaming soap (orange) 892 79 370 50 Sanitizer 473; 670 202 110 Non anti bac soap (blue) 1895 161 Water only 944 354 390 Difference 22 -842 311 -348 206; 174 377 126 -267 -496 175 16 251 1776 104 12 -119 -57 -239 400 1423 76 248 479 -278 -152 Difference =Experimental-control

Product Difference Anti bac foaming soap (orange) -842 311 -348 Sanitizer -267 -496 175 16 Non anti bac soap (blue) -119 -57 -239 Water only 479 -278 -152 % Difference 94% Decrease 394% increase 94% decrease 56% decrease 74% decrease 87% increase 14% increase 6% decrease 35% decrease 95% decrease 50% increase 78% decrease 38% decrease

Remove outliers (any number that increased) Product Difference % Difference Anti bac foaming soap (orange) -842 311 -348 94% Decrease Sanitizer -267 -496 175 16 56% decrease 74% decrease Non anti bac soap (blue) -119 -57 -239 Water only 479 -278 -152 6% decrease 35% decrease 95% decrease 78% decrease 38% decrease How do you graph remaining data?

Product % Difference Average % Difference Anti bac foaming soap 94% Decrease (orange) 94% Decrease 56% decrease Sanitizer 74% decrease 94% 6% decrease 35% decrease 95% decrease 78% decrease 38% decrease 45% Non anti bac soap (blue) Water only 65% 58% Rank Most effective (1 -4)

% Change in bacterial colonies Type of Product Figure 1. 1: Bacterial Analysis after Hand cleansing with different products

#12 Eva and Lucy decide to test the effects of how much sleep a student gets on the academic performance of that student. They select 20 juniors (10 male and 10 female) to study. All students have GPA’s between 3. 5 and 4. 0, and are all of similar ethnic backgrounds. Eva and Lucy instruct the students to get 9 hours of sleep every night for a week, and give the students a standardized test on Friday. The next week, students are only allowed 8 hours of sleep every night before taking a similar test the following Friday. They continue to vary the amount of sleep down to only 5 hours per night, and record data about how they perform on a standardized test each week. • • What is the independent variable in this experiment? What is the dependent variable? Name two constants they keep. Write a hypothesis for this experiment.

Individual Practice.

https: //www. youtube. com/watch? v=Ts. II 89 E c 8 YI&scrlybrkr=cb 0 dc 660 1

Science v. Technology Science advances Knowledge Technology advances Society 2

Science v. Technology • Science does lead to New Technology. **The goal of Technology is to solve problems, whereas science is aimed at answering a question. ** 3

• Technology: application of scientific discoveries to meet human needs and goals through the development of products and processes 4

Four stages of technological design: 1. Problem Identification – Clearly define the problem or need 2. Solution Design – Brainstorm, research, sketch, and narrow down to best design for product or process 3. Implementation – Build and Test – make improvements as needed 4. Evaluation – Determine if you solved the problem/met all constraints 5

Common requirements within the Solution Design stage: 1. Cost effectiveness or lowest cost 2. Time effectiveness or least amount of time required 3. Materials that meet these criteria: • • Reasonably priced Availability Durability Not harmful to users or the environment It’s nearly impossible to have the perfect design, but in general shoot for the: Benefits >>> risks 6

Scientific Investigation vs. Technological Design • Identifies a problem – asks a question • Researches related information • Designs an investigation or experiment • Conducts the investigation or experiment – repeated trials • Analyzes the results • Evaluates the conclusion – did the results refute or verify the hypothesis? • Communicates the findings • Identifies a problem or need • Researches related information • Designs a process or a product • Implements the design or the process – repeated testing • Analyzes the results • Evaluates the process or product – did it meet the criteria? • Communicates the product or process 7

Vocabulary Cards 1. Technology

Exit Ticket List the first 2 steps of the technological design process.


#13 List the 4 steps of the technological Design process.
 Signing naturally 6:13
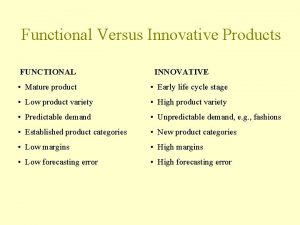
 Functional and innovative products
 Marketing mix of pepsi
 A brand mark with human form or characteristics.
 Why do different polymers have different properties
 Technicolor test
 Sound will travel at different speeds in different mediums.
 Library.thinkquest.org 19537
 Different culture have different moral codes
 Different angle different story
 Acids and bases song
 Manufactured boards examples
 Different people different things
 Argumenterande tal struktur
 Java soap xml 파싱
 Soap wsdl uddi
 Undefined simple or complex type 'soapenc:array'
 When was soap first used
 Simple object access protocol
 Pomr documentation

