
11 Cost of Capital Prepared by Michel Paquet
11 Cost of Capital Prepared by: Michel Paquet SAIT Polytechnic 1 of 40 © 2009 Mc. Graw-Hill Ryerson Limited
Chapter 11 - Outline • What is the Cost of Capital? • Components and Calculation of Cost of Capital • Optimal Capital Structure • Use of Cost of Capital • Capital Asset Pricing Model (CAPM) • Summary and Conclusions 2 of 40 © 2009 Mc. Graw-Hill Ryerson Limited
Learning Objectives 1. Explain that the cost of capital represents the overall cost of financing to the firm. (LO 1) 2. Define the cost of capital as the discount rate normally used to analyze an investment. It is an evaluation tool. (LO 2) 3. Calculate the cost of capital based on the various valuation techniques from Chapter 10 as applied to bonds, preferred stock and common shares. (LO 3) 3 of 40 © 2009 Mc. Graw-Hill Ryerson Limited
Learning Objectives 4. Describe how a firm attempts to find a minimum cost of capital by varying the mix of its sources of financing. (LO 4) 5. Explain the marginal cost of capital concept. (LO 5) 4 of 40 © 2009 Mc. Graw-Hill Ryerson Limited
LO 1/LO 2 Cost of Capital • The cost of capital is a measure of the overall cost of financing to a firm. • It is the discount rate used to discount future cash flows from an investment. • It is the minimal rate of return that an investment of the same risk as the firm should earn. • Using the cost of capital to make investment decisions eliminates inconsistency. 5 of 40 © 2009 Mc. Graw-Hill Ryerson Limited
LO 1/LO 2 Cost of Capital • The cost of capital is a weighted average cost of the various sources of capital, including debt, preferred stock, and common equity (retained earnings): WACC = Weighted Average Cost of Capital WACC = The sum of the weighted (aftertax) cost of each source of capital • If a firm changes its financial leverage (capital structure), its cost of capital will also change accordingly. 6 of 40 © 2009 Mc. Graw-Hill Ryerson Limited
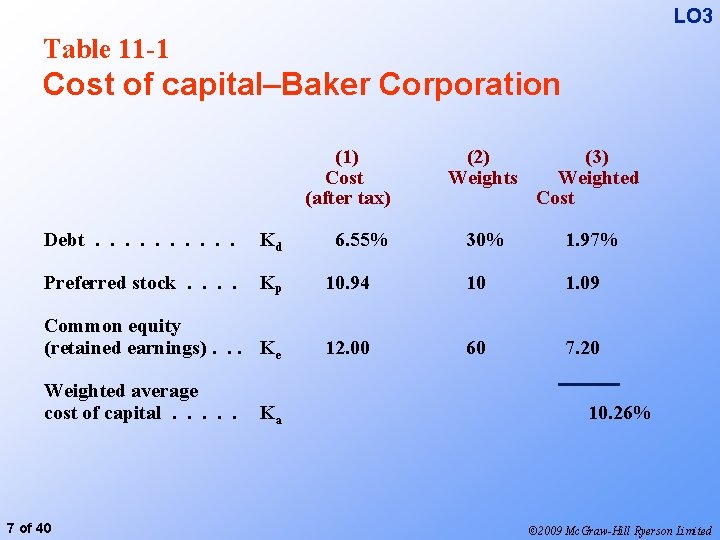
LO 3 Table 11 -1 Cost of capital–Baker Corporation (1) Cost (after tax) (3) Weighted Cost 30% 1. 97% Debt. . Kd Preferred stock. . Kp 10. 94 10 1. 09 Common equity (retained earnings). . . Ke 12. 00 60 7. 20 Weighted average cost of capital. . . 7 of 40 Ka 6. 55% (2) Weights 10. 26% © 2009 Mc. Graw-Hill Ryerson Limited
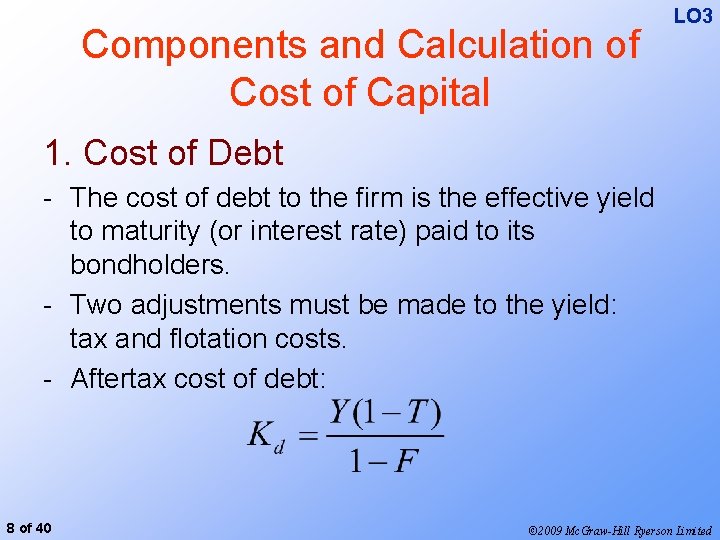
Components and Calculation of Cost of Capital LO 3 1. Cost of Debt - The cost of debt to the firm is the effective yield to maturity (or interest rate) paid to its bondholders. - Two adjustments must be made to the yield: tax and flotation costs. - Aftertax cost of debt: 8 of 40 © 2009 Mc. Graw-Hill Ryerson Limited
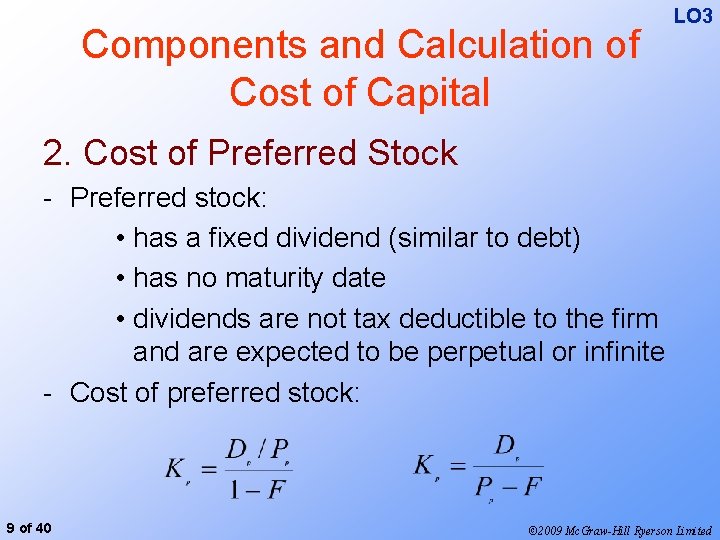
Components and Calculation of Cost of Capital LO 3 2. Cost of Preferred Stock - Preferred stock: • has a fixed dividend (similar to debt) • has no maturity date • dividends are not tax deductible to the firm and are expected to be perpetual or infinite - Cost of preferred stock: 9 of 40 © 2009 Mc. Graw-Hill Ryerson Limited
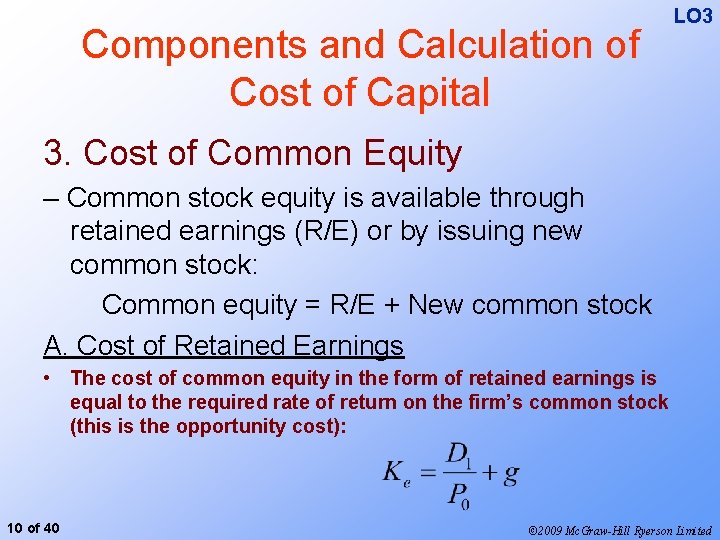
Components and Calculation of Cost of Capital LO 3 3. Cost of Common Equity – Common stock equity is available through retained earnings (R/E) or by issuing new common stock: Common equity = R/E + New common stock A. Cost of Retained Earnings • The cost of common equity in the form of retained earnings is equal to the required rate of return on the firm’s common stock (this is the opportunity cost): 10 of 40 © 2009 Mc. Graw-Hill Ryerson Limited
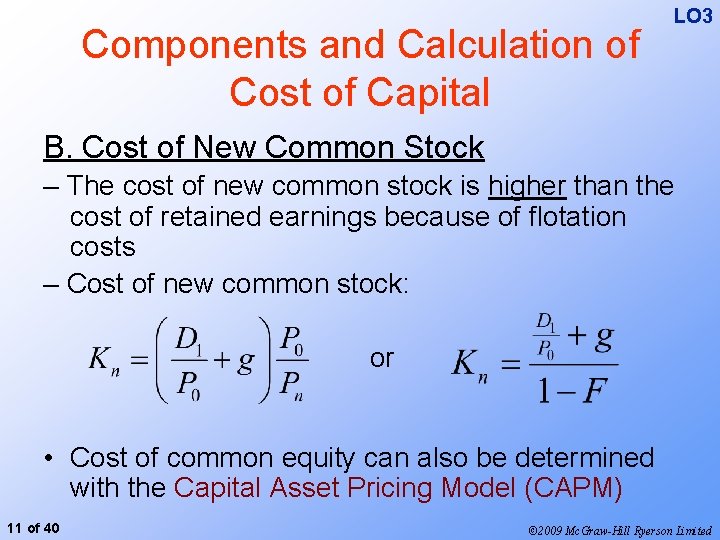
Components and Calculation of Cost of Capital LO 3 B. Cost of New Common Stock – The cost of new common stock is higher than the cost of retained earnings because of flotation costs – Cost of new common stock: or • Cost of common equity can also be determined with the Capital Asset Pricing Model (CAPM) 11 of 40 © 2009 Mc. Graw-Hill Ryerson Limited
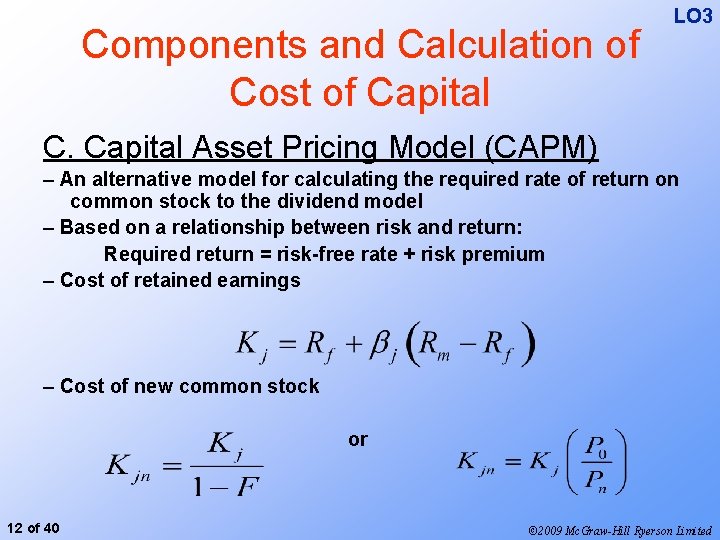
Components and Calculation of Cost of Capital LO 3 C. Capital Asset Pricing Model (CAPM) – An alternative model for calculating the required rate of return on common stock to the dividend model – Based on a relationship between risk and return: Required return = risk-free rate + risk premium – Cost of retained earnings – Cost of new common stock or 12 of 40 © 2009 Mc. Graw-Hill Ryerson Limited
LO 4 Optimum Capital Structure The optimum (best) situation is associated with the minimum overall cost of capital (WACC): – Costs of individual components of financing weighed by their proportions (weights) in the firm’s capital structure produce WACC – Optimum capital structure means the lowest WACC – Usually occurs with 40 -70% debt in a firm’s capital structure – Based upon the market value rather than the book value of the firm’s debt and equity 13 of 40 © 2009 Mc. Graw-Hill Ryerson Limited
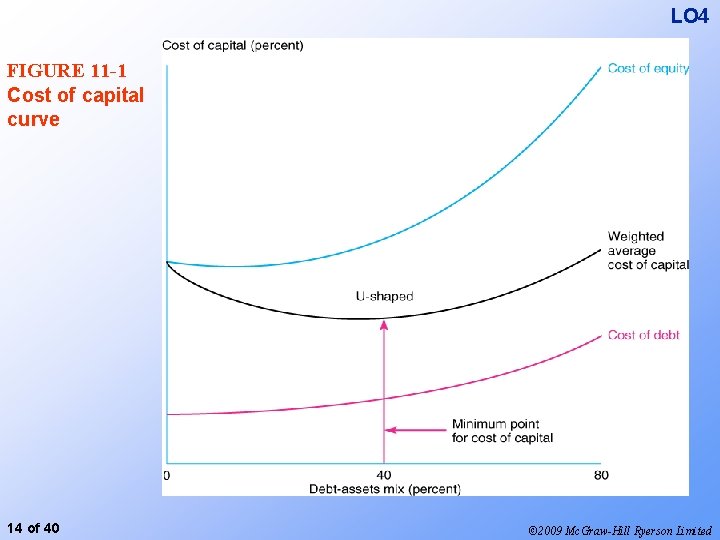
LO 4 FIGURE 11 -1 Cost of capital curve 14 of 40 © 2009 Mc. Graw-Hill Ryerson Limited
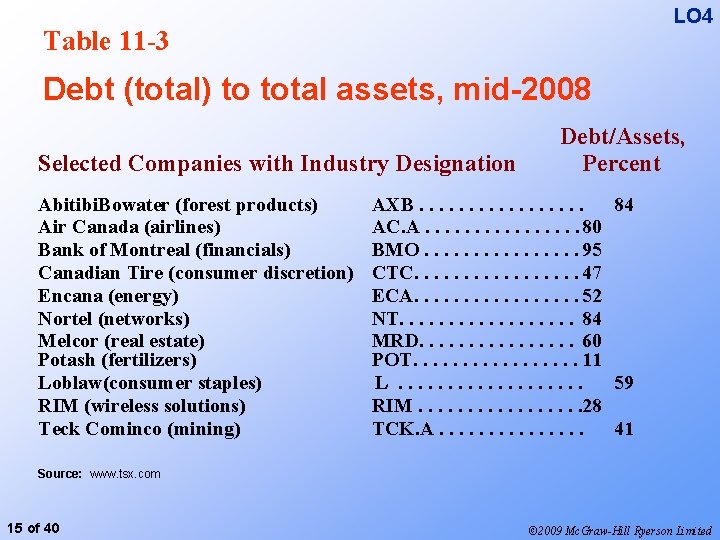
LO 4 Table 11 -3 Debt (total) to total assets, mid-2008 Selected Companies with Industry Designation Abitibi. Bowater (forest products) Air Canada (airlines) Bank of Montreal (financials) Canadian Tire (consumer discretion) Encana (energy) Nortel (networks) Melcor (real estate) Potash (fertilizers) Loblaw(consumer staples) RIM (wireless solutions) Teck Cominco (mining) Debt/Assets, Percent AXB. . . . 84 AC. A. . . . 80 BMO. . . . 95 CTC. . . . 47 ECA. . . . 52 NT. . . . 84 MRD. . . . 60 POT. . . . 11 L. . . . . 59 RIM. . . . 28 TCK. A. . . . 41 Source: www. tsx. com 15 of 40 © 2009 Mc. Graw-Hill Ryerson Limited
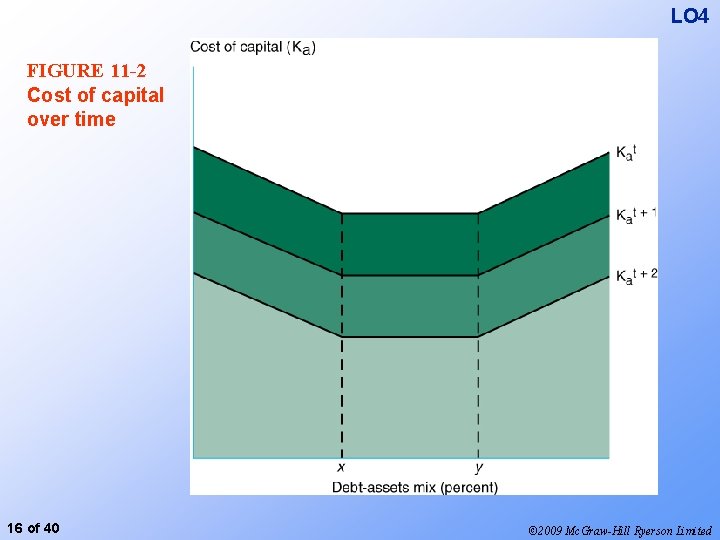
LO 4 FIGURE 11 -2 Cost of capital over time 16 of 40 © 2009 Mc. Graw-Hill Ryerson Limited
LO 4 Use of The Cost of Capital • The cost of capital (WACC) represents the overall rate of return required by a firm’s investors – bondholders, preferred shareholders and common shareholders. • Investments must be judged against this benchmark regardless of the particular source of funds the firm is using for a particular investment. • If investments are matched with their financing, investments with lower return may be accepted while those with higher return would be rejected. 17 of 40 © 2009 Mc. Graw-Hill Ryerson Limited
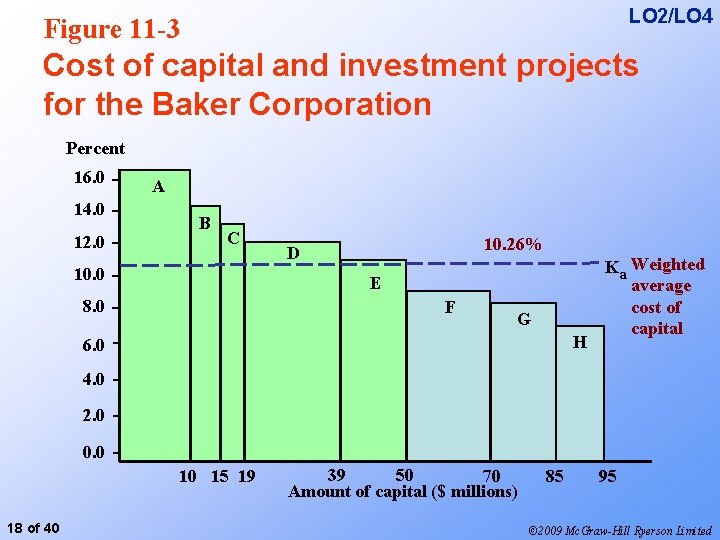
LO 2/LO 4 Figure 11 -3 Cost of capital and investment projects for the Baker Corporation Percent 14. 0 12. 0 10. 0 8. 0 16. 0 A B C 10. 26% D E F 4. 0 2. 0 0. 0 - G H 6. 0 10 15 19 18 of 40 39 50 70 Amount of capital ($ millions) 85 Ka Weighted average cost of capital 95 © 2009 Mc. Graw-Hill Ryerson Limited
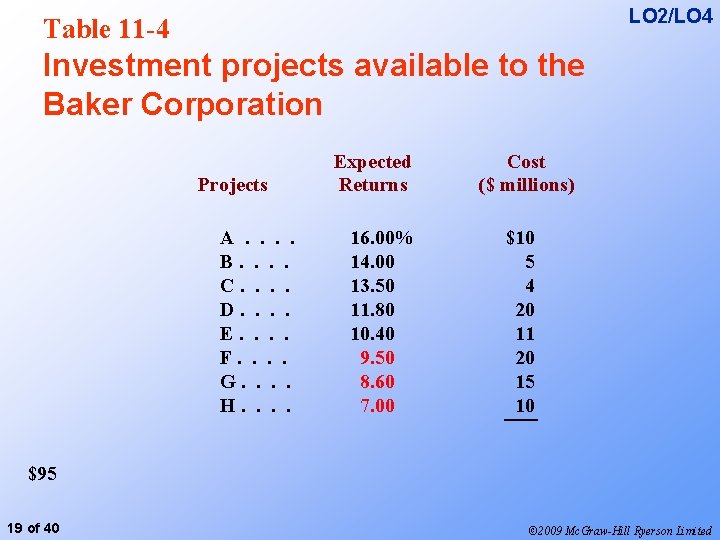
LO 2/LO 4 Table 11 -4 Investment projects available to the Baker Corporation Projects A. . B. . C. . D. . E. . F. . G. . H. . Expected Returns 16. 00% 14. 00 13. 50 11. 80 10. 40 9. 50 8. 60 7. 00 Cost ($ millions) $10 5 4 20 11 20 15 10 $95 19 of 40 © 2009 Mc. Graw-Hill Ryerson Limited
LO 5 Marginal Cost of Capital • A firm’s cost of debt or preferred stock or common stock increases as it uses more debt or preferred stock or common stock. • This will lead to a higher cost of capital even if a given capital structure (the weights) is maintained. • The marginal cost of capital measures a firm’s overall cost of receiving extra dollar from investors. 20 of 40 © 2009 Mc. Graw-Hill Ryerson Limited
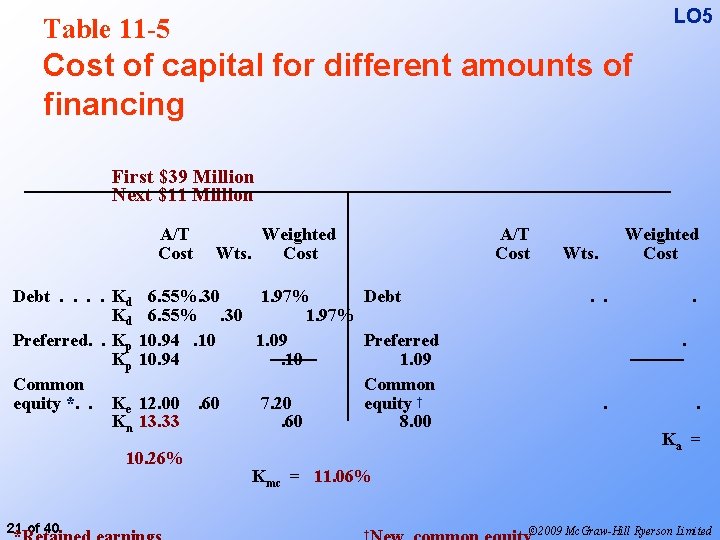
LO 5 Table 11 -5 Cost of capital for different amounts of financing First $39 Million Next $11 Million A/T Cost Debt. . Kd Kd Preferred. . Kp Kp Common equity *. . Ke Kn A/T Cost 6. 55%. 30 1. 97% Debt 6. 55%. 30 1. 97% 10. 94. 10 1. 09 Preferred 10. 94. 10 1. 09 Common 12. 00. 60 7. 20 equity † 13. 33. 60 8. 00 10. 26% 21 of 40 Weighted Wts. Cost Weighted Cost Wts. . . . Ka = Kmc = 11. 06% † © 2009 Mc. Graw-Hill Ryerson Limited
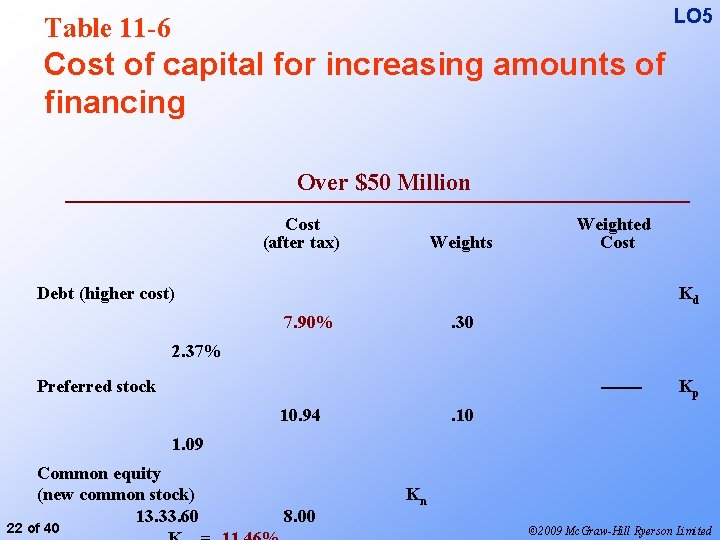
LO 5 Table 11 -6 Cost of capital for increasing amounts of financing Over $50 Million Cost (after tax) Weights Debt (higher cost) Weighted Cost Kd 7. 90% . 30 2. 37% Preferred stock Kp 10. 94 . 10 1. 09 Common equity (new common stock) 13. 33. 60 22 of 40 8. 00 Kn © 2009 Mc. Graw-Hill Ryerson Limited
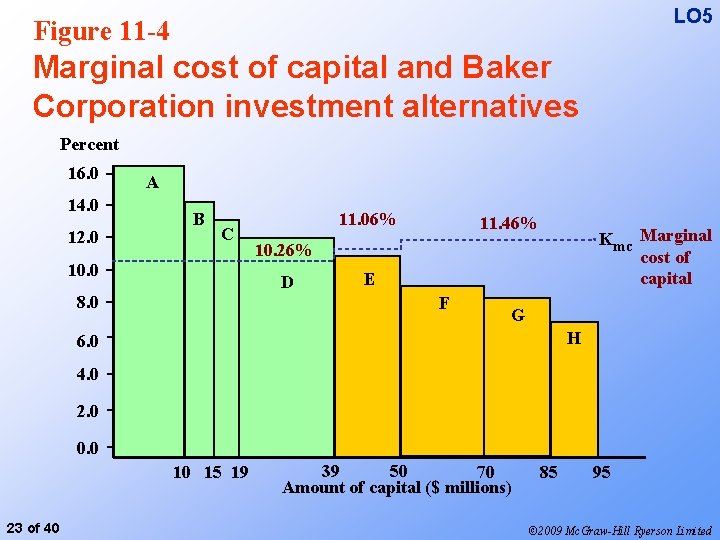
LO 5 Figure 11 -4 Marginal cost of capital and Baker Corporation investment alternatives Percent 14. 0 12. 0 10. 0 8. 0 16. 0 A B C 11. 06% 11. 46% 10. 26% D E F 4. 0 2. 0 0. 0 - Kmc Marginal cost of capital G H 6. 0 10 15 19 23 of 40 39 50 70 Amount of capital ($ millions) 85 95 © 2009 Mc. Graw-Hill Ryerson Limited
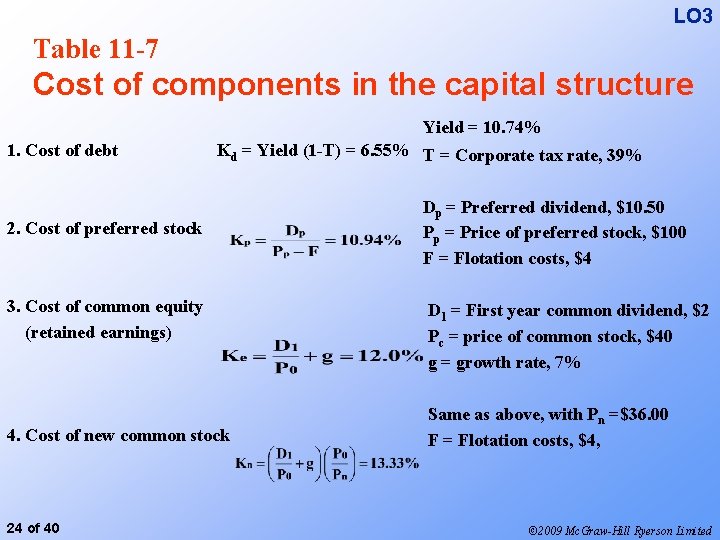
LO 3 Table 11 -7 Cost of components in the capital structure Yield = 10. 74% 1. Cost of debt Kd = Yield (1 -T) = 6. 55% T = Corporate tax rate, 39% 2. Cost of preferred stock 3. Cost of common equity (retained earnings) 4. Cost of new common stock 24 of 40 Dp = Preferred dividend, $10. 50 Pp = Price of preferred stock, $100 F = Flotation costs, $4 D 1 = First year common dividend, $2 Pc = price of common stock, $40 g = growth rate, 7% Same as above, with Pn =$36. 00 F = Flotation costs, $4, © 2009 Mc. Graw-Hill Ryerson Limited
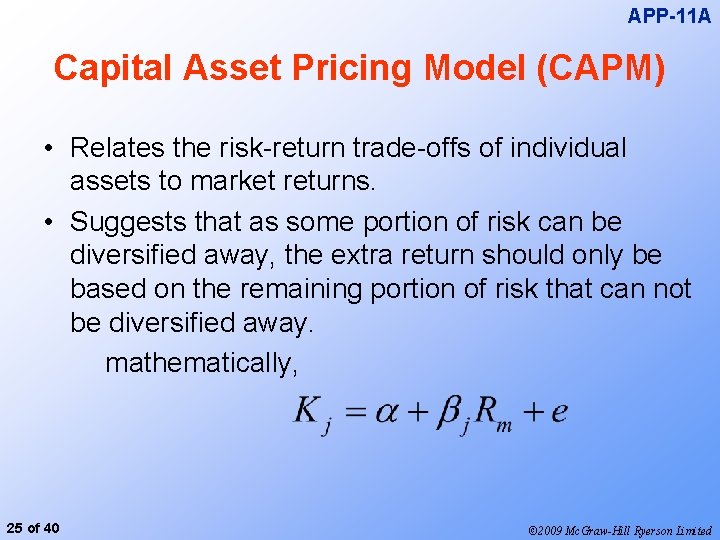
APP-11 A Capital Asset Pricing Model (CAPM) • Relates the risk-return trade-offs of individual assets to market returns. • Suggests that as some portion of risk can be diversified away, the extra return should only be based on the remaining portion of risk that can not be diversified away. mathematically, 25 of 40 © 2009 Mc. Graw-Hill Ryerson Limited
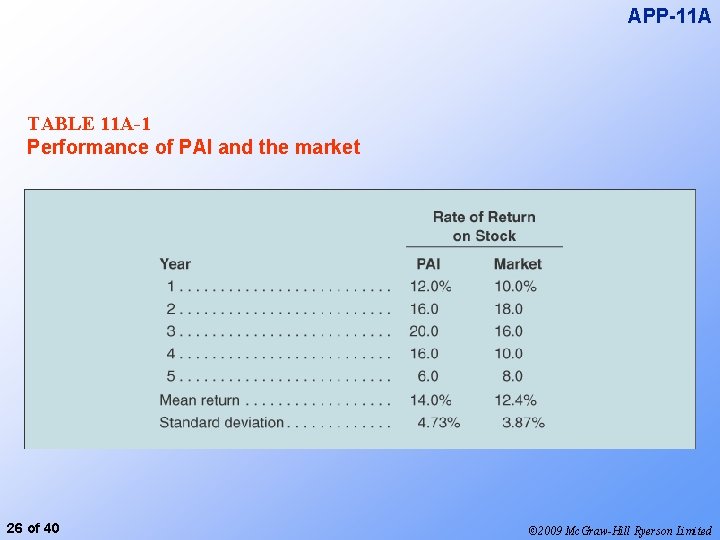
APP-11 A TABLE 11 A-1 Performance of PAI and the market 26 of 40 © 2009 Mc. Graw-Hill Ryerson Limited
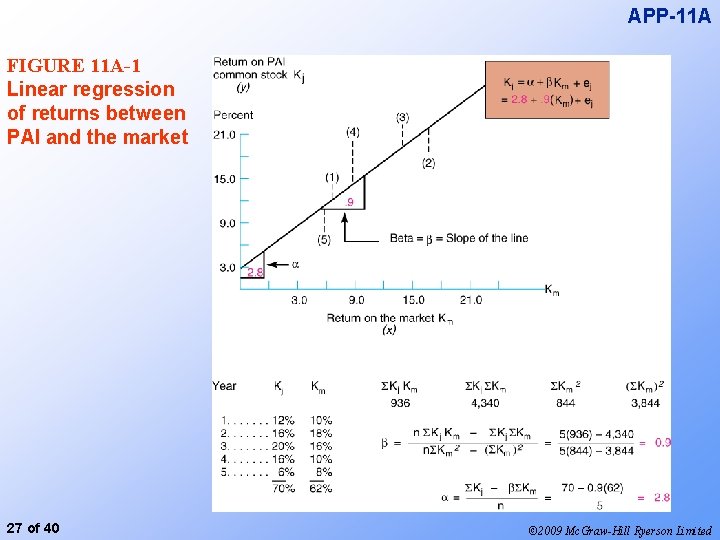
APP-11 A FIGURE 11 A-1 Linear regression of returns between PAI and the market 27 of 40 © 2009 Mc. Graw-Hill Ryerson Limited
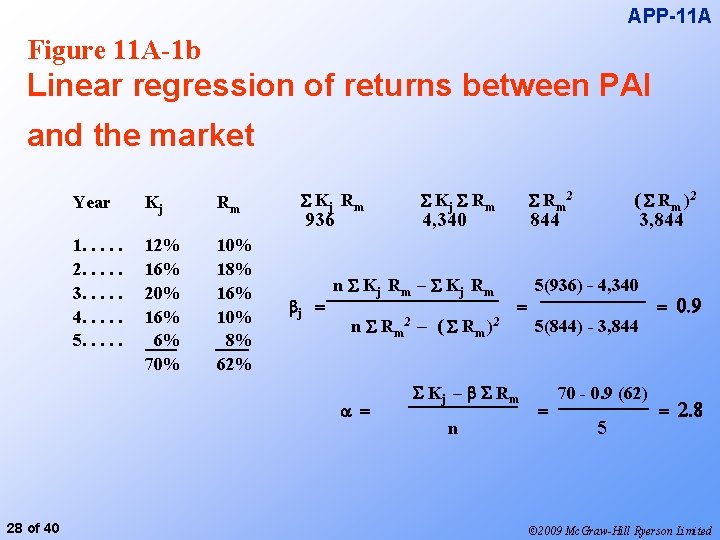
APP-11 A Figure 11 A-1 b Linear regression of returns between PAI and the market Year Kj Rm 1. . . 2. . . 3. . . 4. . . 5. . . 12% 16% 20% 16% 6% 70% 18% 16% 10% 8% 62% Kj Rm 936 Kj Rm 4, 340 Rm 2 844 ( R m )2 3, 844 n Kj Rm – Kj Rm 5(936) - 4, 340 j 2 2 n Rm – ( Rm ) 5(844) - 3, 844 Kj – Rm 70 - 0. 9 (62) n 5 28 of 40 © 2009 Mc. Graw-Hill Ryerson Limited
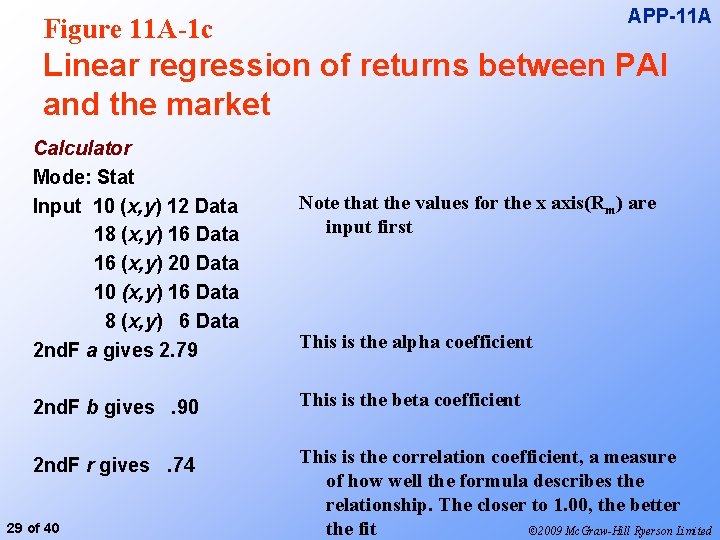
APP-11 A Figure 11 A-1 c Linear regression of returns between PAI and the market Calculator Mode: Stat Input 10 (x, y) 12 Data 18 (x, y) 16 Data 16 (x, y) 20 Data 10 (x, y) 16 Data 8 (x, y) 6 Data 2 nd. F a gives 2. 79 Note that the values for the x axis(Rm) are input first This is the alpha coefficient 2 nd. F b gives. 90 This is the beta coefficient 2 nd. F r gives. 74 This is the correlation coefficient, a measure of how well the formula describes the relationship. The closer to 1. 00, the better the fit © 2009 Mc. Graw-Hill Ryerson Limited 29 of 40
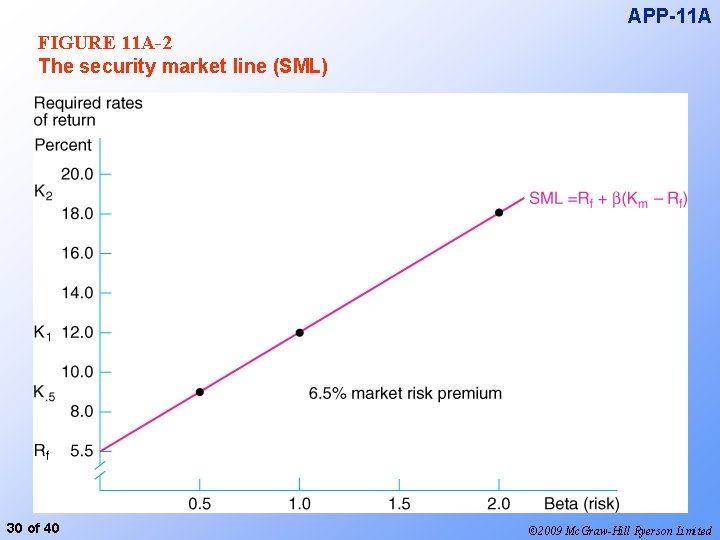
APP-11 A FIGURE 11 A-2 The security market line (SML) 30 of 40 © 2009 Mc. Graw-Hill Ryerson Limited
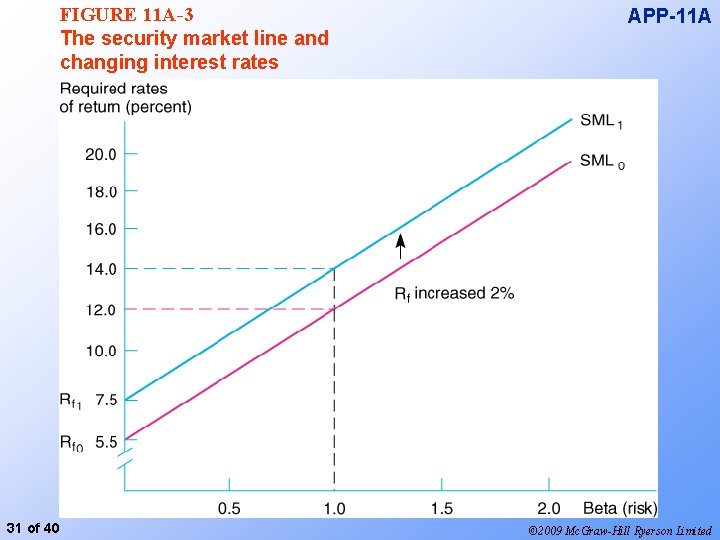
FIGURE 11 A-3 The security market line and changing interest rates 31 of 40 APP-11 A © 2009 Mc. Graw-Hill Ryerson Limited
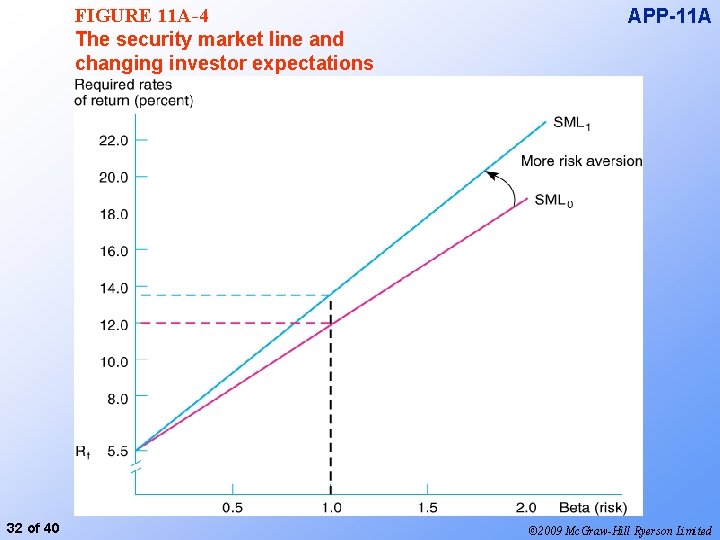
FIGURE 11 A-4 The security market line and changing investor expectations 32 of 40 APP-11 A © 2009 Mc. Graw-Hill Ryerson Limited
APP-11 B Capital Structure Theory • Net Income (NI) Approach • Net Operating Income (NOI) Approach • Modigliani and Miller Model 33 of 40 © 2009 Mc. Graw-Hill Ryerson Limited
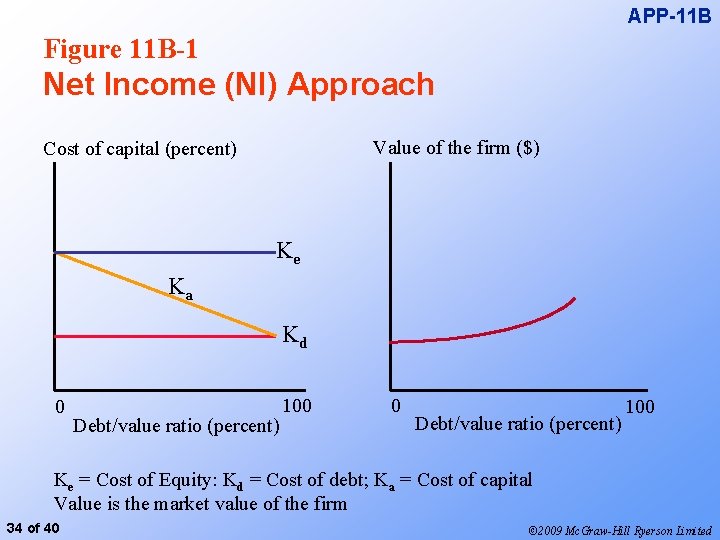
APP-11 B Figure 11 B-1 Net Income (NI) Approach Value of the firm ($) Cost of capital (percent) Ke Ka Kd 0 Debt/value ratio (percent) 100 Ke = Cost of Equity: Kd = Cost of debt; Ka = Cost of capital Value is the market value of the firm 34 of 40 © 2009 Mc. Graw-Hill Ryerson Limited
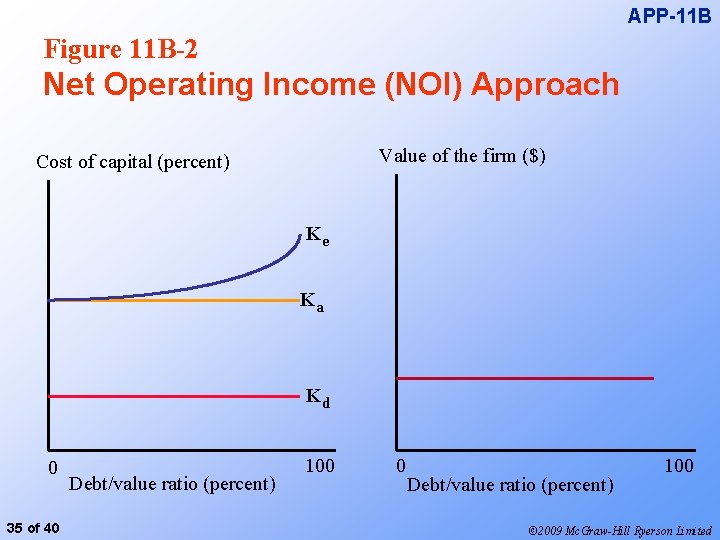
APP-11 B Figure 11 B-2 Net Operating Income (NOI) Approach Value of the firm ($) Cost of capital (percent) Ke Ka Kd 0 35 of 40 Debt/value ratio (percent) 100 © 2009 Mc. Graw-Hill Ryerson Limited
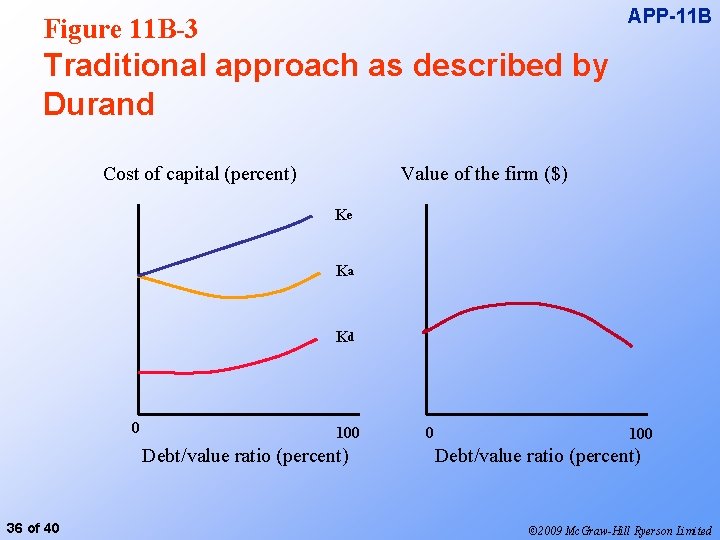
APP-11 B Figure 11 B-3 Traditional approach as described by Durand Cost of capital (percent) Value of the firm ($) Ke Ka Kd 0 100 Debt/value ratio (percent) 36 of 40 0 100 Debt/value ratio (percent) © 2009 Mc. Graw-Hill Ryerson Limited
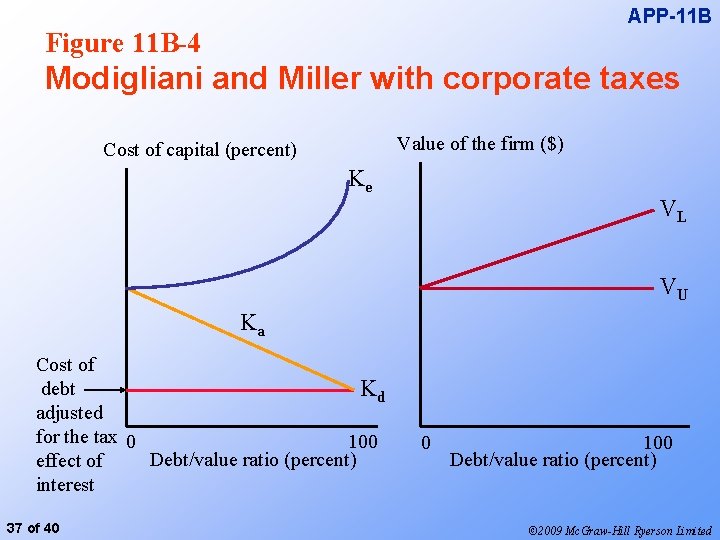
APP-11 B Figure 11 B-4 Modigliani and Miller with corporate taxes Value of the firm ($) Cost of capital (percent) Ke VL VU Ka Cost of debt Kd adjusted for the tax 0 100 Debt/value ratio (percent) effect of interest 37 of 40 0 100 Debt/value ratio (percent) © 2009 Mc. Graw-Hill Ryerson Limited
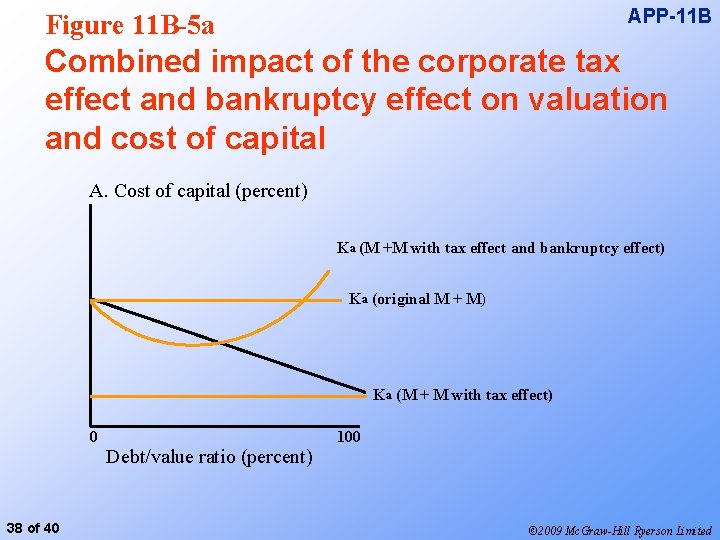
APP-11 B Figure 11 B-5 a Combined impact of the corporate tax effect and bankruptcy effect on valuation and cost of capital A. Cost of capital (percent) Ka (M +M with tax effect and bankruptcy effect) Ka (original M + M) Ka (M + M with tax effect) 0 38 of 40 Debt/value ratio (percent) 100 © 2009 Mc. Graw-Hill Ryerson Limited
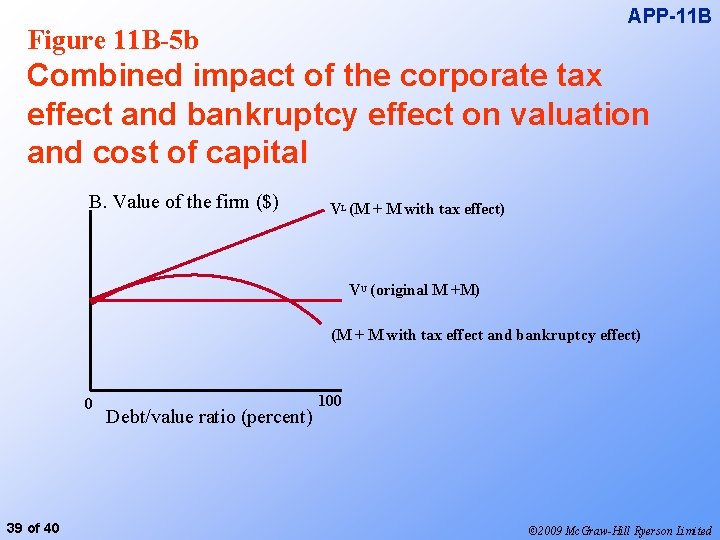
APP-11 B Figure 11 B-5 b Combined impact of the corporate tax effect and bankruptcy effect on valuation and cost of capital B. Value of the firm ($) VL (M + M with tax effect) VU (original M +M) (M + M with tax effect and bankruptcy effect) 0 39 of 40 Debt/value ratio (percent) 100 © 2009 Mc. Graw-Hill Ryerson Limited
Summary and Conclusions • The cost of capital is calculated as the weighted average of costs from various sources of financing (WACC). • The weightings are based on the market value of the existing capital structure. • Firms choose the weights to minimize WACC. • The cost of capital is used as an evaluation tool to analyze investment proposals. 40 of 40 © 2009 Mc. Graw-Hill Ryerson Limited
- Slides: 40