11 947 Loans 7 216 Loans 3 446


 Charged Off,")


 Prepaid")


- Slides: 39
11, 947 Loans 7, 216 Loans 3, 446 Loans 1, 166 Loans 119 Loans
Total Loan Volume: $103, 649, 269 $54, 837, 059 $32, 845, 566 $14, 911, 852 $1, 054, 812
Standard Loan Performance Data Static Features Dynamic Features Borrower Characteristics Monthly payment history Loan Characteristics Outstanding Balance Project Characteristics Loss mitigation
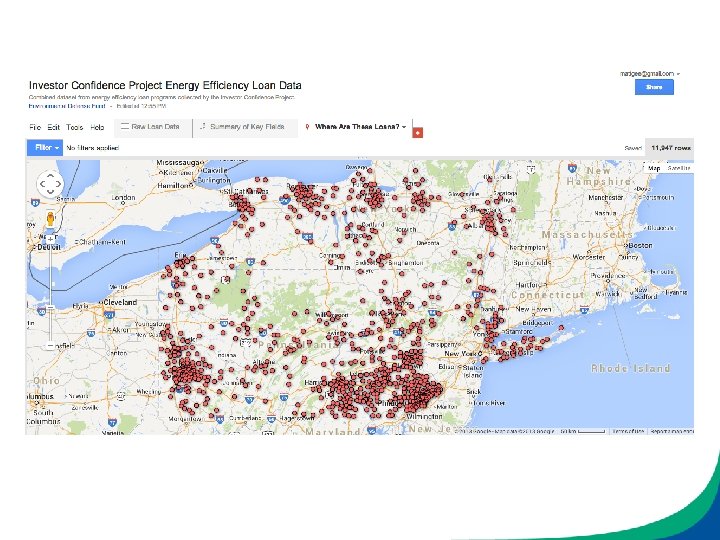
Combined Data Overview: • Information About Borrower and Property • Information About the Loan • Limited Information on Payments • Limited Information About the Project • No Information About Energy Usage
Information About the Borrower and Property Data Field Oregon NYSERDA PA Treasury GCEA x x x DTI City x x x Borrowers Annual Income County x x Year Constructed Floorspace x x Building Type Number of occupants x Credit Score Zip State x x x x x
Information About the Loan Data Field Loan Amount Loan Interst Rate Original Loan Term Loan Approval Date Oregon x x NYSERDA PA Treasury x x x x Current Principal Balance Loan Status Days Past Due Next Principal Due Date Next Interest Due Date x x x x Last Payment Date Last Payment Amount # Payments Made Loan Product Open Date Charge Off Amount x x x x x Regular Payment Due Amount Lender Name GCEA x x x
Information About the Project Data Field Project Work Done Total Invoiced Cost Oregon NYSERDA PA Treasury x x x GCEA x x
Combined Dataset Summary Statistics Data Field Range Median Mean # of Loans Loan Amount $701 -$30, 000 $7, 500 $8, 675 11, 947 Loan Term 12 -257 120 123 11, 947 Loan Interest 0. 99%-12% 5. 99% 5. 6% 11, 947 Credit Score 509 -926 755 744 11, 929 DTI 0 -0. 9848 0. 345 0. 337 10, 774 Annual Income 0 -$725, 000 $65, 000 $77, 460 4, 724
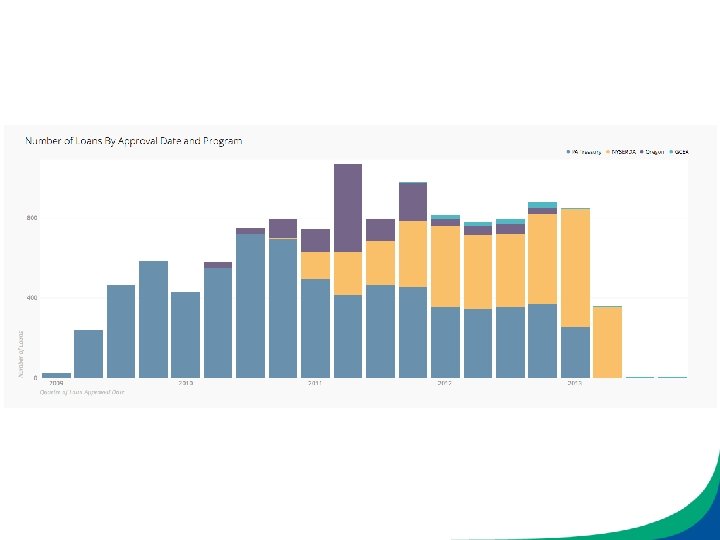
Summary Statistics by Program • Loan Amounts: Data Set Range Median Mean # of Loans Oregon $1, 000 -$30, 000 $11, 689 $12, 788 1, 166 NYSERDA $701 -$25, 000 $8, 439 $9, 531 3, 446 PA Treasury $1, 000 -$15, 000 $7, 032 $7, 599 7, 216 GCEA $1, 000 -$21, 000 $7, 538 $8, 863 112
Summary Statistics by Program • Borrowers Credit Scores: Data Set Range Median Mean # of Obs Oregon 580 -842 773 763 1, 166 NYSERDA 509 -830 752 740 3, 454 PA Treasury 640 -800 742 7, 216 GCEA 645 -926 734 745 111
Summary Statistics by Program
Summary Statistics by Program • Borrowers DTI: Data Set Range Median Mean # of Loans NYSERDA 0 -0. 9848 0. 339 0. 331 3, 446 PA Treasury 0. 01 -0. 75 0. 3468 0. 340 7, 216 GCEA 0. 16 -0. 54 0. 361 0. 357 112 Oregon
Summary Statistics by Program
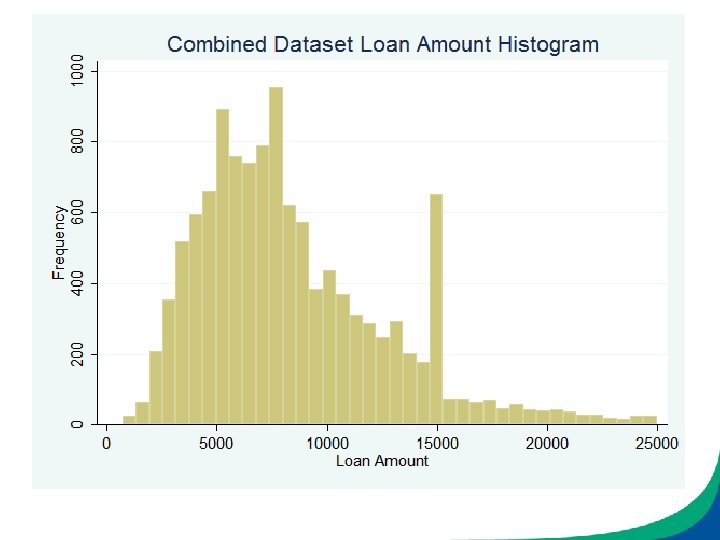
Analysis of Loan Amounts • Combined Dataset – – 11, 947 Loans Range: $701 -$30, 000 Mean: $8, 675, Median: $7, 500 Total Amount Lent: $103, 649, 269
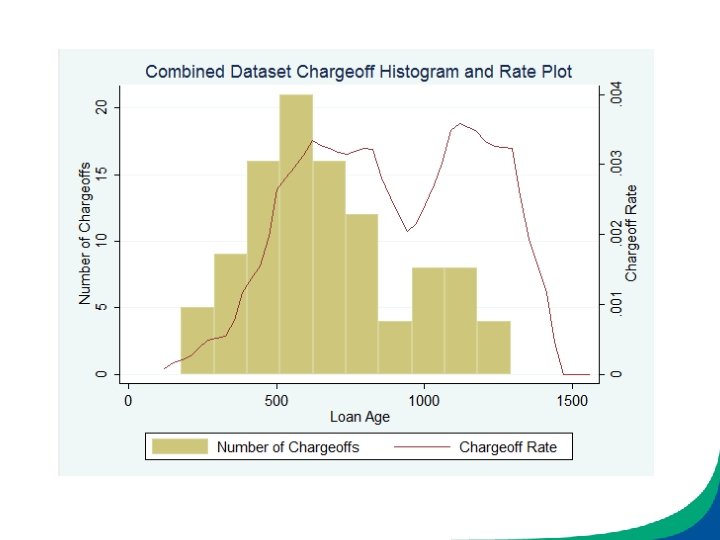
Analysis of Charge Offs • 11, 828 Loans • 106 (0. 89%) Charged Off, We Have Date and Amount Data For 103 • Charged Off Amounts Range from $901 -$25, 000 • Median: $5, 824 Mean: $6, 182 • Total Principal Lost: $642, 917
Analysis of Charge Offs by Program Data Set % Charged # Range of Charged Off Amounts Median Amount Mean Amount Oregon 0. 17% 2 N/A N/A NYSERDA 0. 4% 13 $1, 368 -$25, 000 $6, 495 $7, 426 PA Treasury 1. 26% 91 $903 -$15, 000 $5, 695 $6, 004 GCEA N/A N/A N/A
Analysis of Charge Offs by Loan Term Data Set % Charged # Range of Charged Off Amounts Median Amount Mean Amount 36 -Month 0. 68% 7 $903 -$6, 524 $2, 908 $3, 430 60 -Month 1. 02% 24 $2, 074 -$8, 340 $3, 263 $3, 747 120 -Month 1. 32% 66 $2, 741 -$14, 897 $6, 430 $7, 026 180 -Month 0. 31% 7 $1, 368 -$25, 000 $7, 669 $9, 320 240 -Month 0. 18% 2 N/A N/A
Charge Off Rates Over Time • Rate of Charge Off increases as loans age to around 2 years then plateaus • Measured rate is significantly less meaningful above 3 years because of small sample size
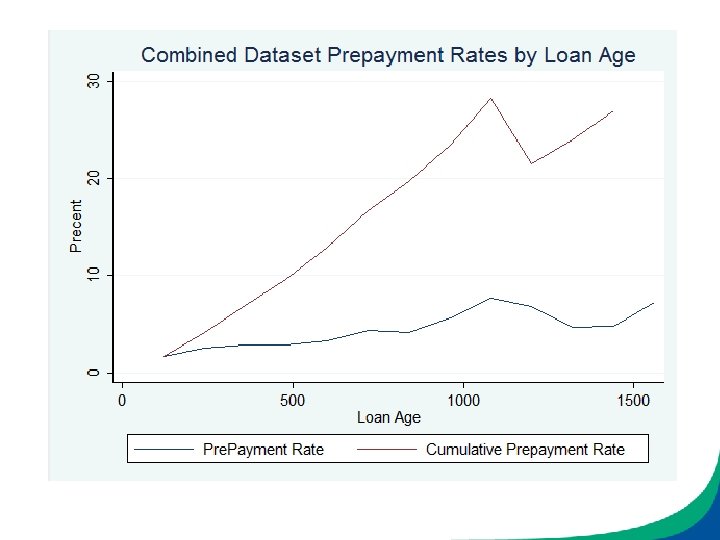
Prepayment Analysis • 11, 828 Loans • 2, 040 (17. 24%) Prepaid
Prepayment Rate by Program Loan Program # of Loans # of Early Payoffs Early Payoff Rate PA Treasury 7216 1622 22. 4% NYSERDA 3446 100 2. 9% Oregon 1166 318 27. 3%
Prepayment Rate by Loan Term in Months # of Loans # of early payoffs Early Payoff Rate 36 1043 668 64. 0% 60 2371 503 21. 2% 120 5080 568 11. 2% 180 2275 40 1. 8% 240 1123 303 26. 8%
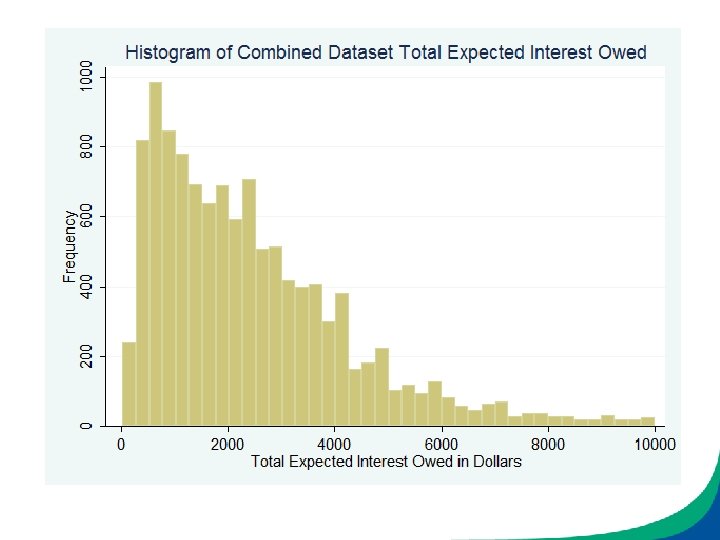
Losses Analysis • 11, 947 Loans • $103, 649, 269 loaned out • $34, 294, 175 in expected interest payments • $137, 943, 444 expected to be paid back
Combined Dataset Losses Analysis • 103 Charge Offs • $642, 917 in lost principal, $163, 175 in lost interest • $806, 092 in total losses, which is 0. 58% of the total expected payback
Combined Dataset Losses Analysis • 2, 040 Prepayments • $301, 910 in lost interest, which is 0. 22% of the total expected payback • $1, 108, 002 in total losses, which is 0. 8% of the total expected payback
Losses by Program Principal Losses from Chargeoffs Interest Losses from Chargeoffs Total Losses from Chargeoffs Interest Losses from Payoffs Total Losses as a Percent Oregon N/A N/A $20, 158 N/A NYSERDA $96, 453 $22, 435 $118, 888 $2, 739 $121, 627 0. 29% PA Treas. $546, 373 $140, 739 $687, 112 $279, 011 $966, 123 1. 37%
Losses by Loan Term Principal Losses from Chargeoffs Interest Losses from Chargeoffs Total Losses Interest from Losses Chargeoffs from Payoffs Total Losses as a Percent 36 -Month $24, 014 $1, 432 $25, 446 $112, 142 $137, 588 2. 41% 60 -Month $89, 942 $8, 581 $98, 523 $99, 010 $197, 533 1. 1% 120 -Month $463, 717 $135, 561 $599, 278 $70, 222 $695, 500 1. 2% 180 -Month $65, 241 $17, 600 $82, 841 $375 $83, 216 0. 27% 240 -Month N/A $19, 203 $19203 N/A
Delinquency Analysis • As of 7/31/2013, the combined dataset 30 -day delinquency rate was 1. 9% • Without time-series data, a more meaningful delinquency analysis was not possible
Summary Statistics by Program • Borrowers Annual Income: Data Set Range Median Mean # of Loans Oregon 0 -$500, 000 $72, 500 $79, 998 1, 166 NYSERDA 0 -$725, 000 $61, 214 $76, 336 3, 446 $27, 000 -$250 K $73, 200 $85, 607 112 PA Treasury GCEA
Summary Statistics by Program
Summary Statistics by Program
Prepayment Rates Over Time • Prepayment rate slowly increases as loans age • Measured rate is significantly less meaningful above 3 years because of small sample size
Total Amount Loaned Out by Program # of Loans Total Lent Total Expected Payback Oregon 1166 $14, 911, 852 $25, 384, 522 NYSERDA 3446 $32, 845, 566 $40, 843, 761 PA Treasury 7216 $54, 837, 059 $70, 337, 771 GCEA 119 $1, 054, 812 $1, 377, 390
Total Amount Loaned Out by Loan Term # of Loans Total Lent Total Expected Payback 36 -Month 1043 $5, 151, 073 $5, 700, 994 60 -Month 2371 $16, 000, 947 $18, 607, 645 120 -Month 5080 $43, 731, 557 $57, 811, 207 180 -Month 2275 $23, 791, 428 $30, 357, 192 240 -Month 1120 $14, 693, 458 $25, 117, 119