
11 6 11 9 Sublimation and Fusion Heating
11. 6 -11. 9 Sublimation and Fusion, Heating Curve for Water, and Phase Diagrams
Sublimation and Deposition • Sublimation, the transition from solid to gas. If solid particles have enough kinetic energy, they can escape the solid state and go directly into the gaseous state. – CO 2 and I 2 are substances that we think about when we hear the term sublimation. But even particles of ice can sublimate. • Deposition, the transition from gas to solid, occurs when gaseous particles are lower in energy and collide with the solid. At this time, intermolecular forces capture the particles and they condense back into the solid state. – Deposition occurs on cold days in winter, when gaseous water vapor condenses on you car windshield, and you have to scrape the frost.
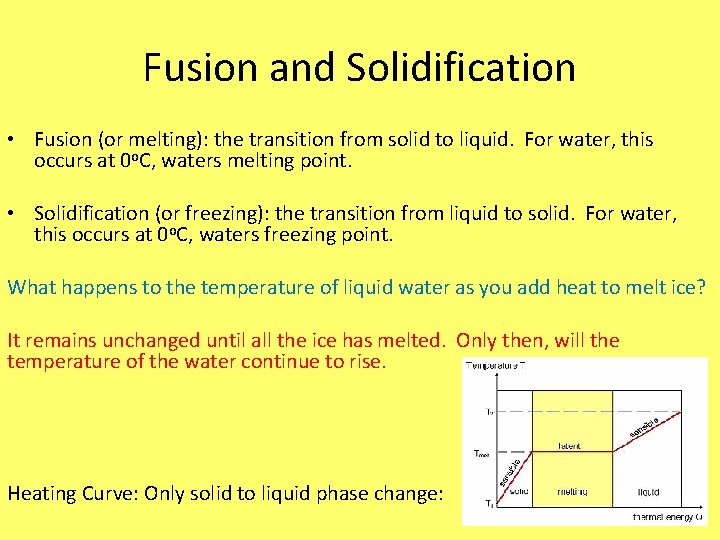
Fusion and Solidification • Fusion (or melting): the transition from solid to liquid. For water, this occurs at 0 o. C, waters melting point. • Solidification (or freezing): the transition from liquid to solid. For water, this occurs at 0 o. C, waters freezing point. What happens to the temperature of liquid water as you add heat to melt ice? It remains unchanged until all the ice has melted. Only then, will the temperature of the water continue to rise. Heating Curve: Only solid to liquid phase change:
Heat of Fusion and Heat of Solidification • Heat of Fusion (ΔHfus): The amount of heat required to melt one mole of solid. – Is heat of fusion an endothermic or an exothermic process? Should it’s value be positive or negative? • Heat of fusion, melting, is endothermic, so the value will always be positive. • H 2 O(s) H 2 O(l) ΔHfus = 6. 02 k. J/mol • Heat of solidification (ΔHsolid or -ΔHfus): The amount of heat released in order for one mol of a liquid to freeze. – Heat of solidification is an exothermic process, to the heat released is a negative value. • H 2 O(l) H 2 O(s) -ΔHfus = -6. 02 k. J/mol • The heat required to vaporize a liquid is a lot higher than the heat required to melt a solid. This is due to the fact that only partial separation of particles is required to melt a solid.
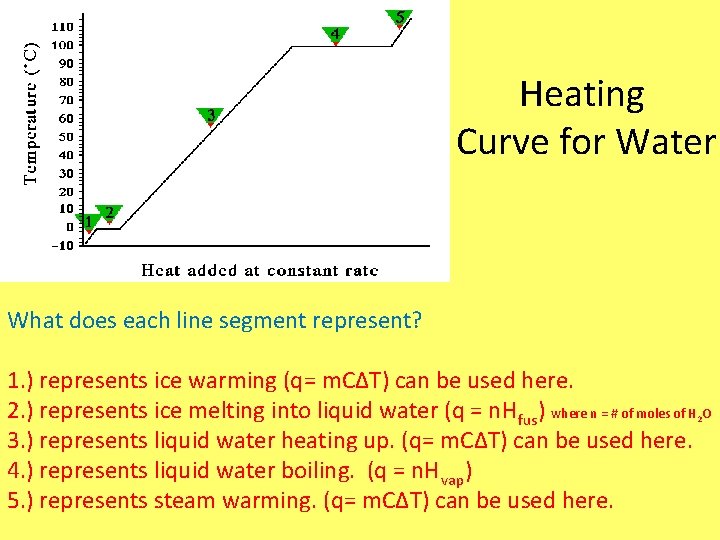
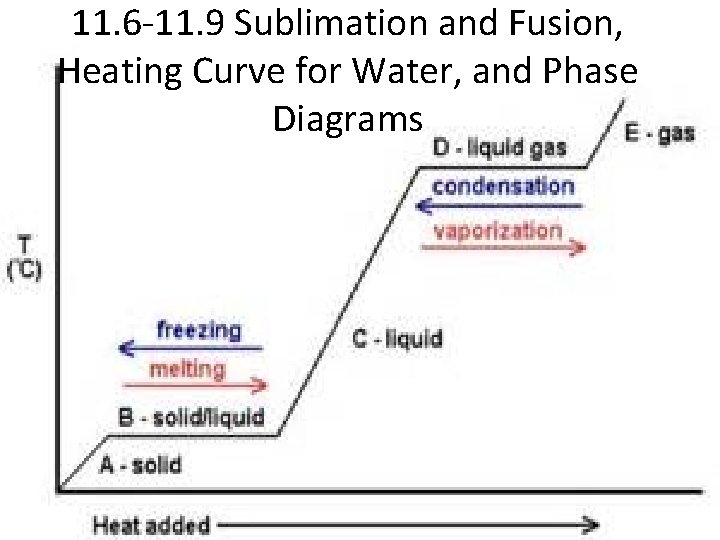
Heating Curve for Water What does each line segment represent? 1. ) represents ice warming (q= m. CΔT) can be used here. 2. ) represents ice melting into liquid water (q = n. Hfus) where n = # of moles of H O 3. ) represents liquid water heating up. (q= m. CΔT) can be used here. 4. ) represents liquid water boiling. (q = n. Hvap) 5. ) represents steam warming. (q= m. CΔT) can be used here. 2
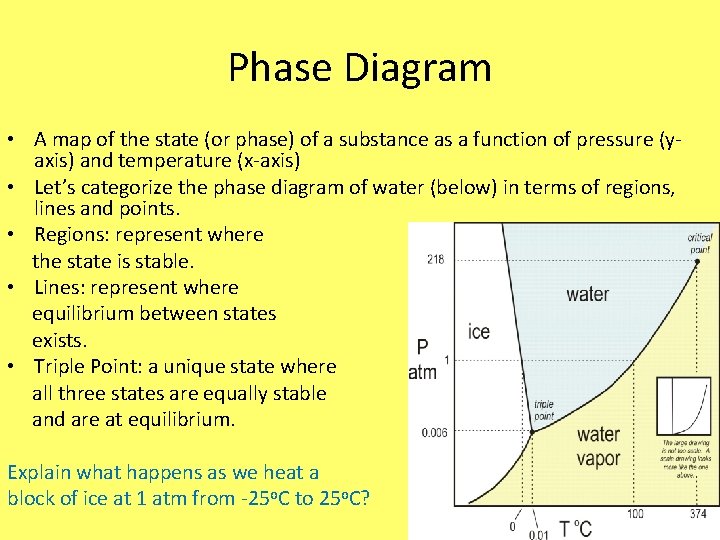
Phase Diagram • A map of the state (or phase) of a substance as a function of pressure (yaxis) and temperature (x-axis) • Let’s categorize the phase diagram of water (below) in terms of regions, lines and points. • Regions: represent where the state is stable. • Lines: represent where equilibrium between states exists. • Triple Point: a unique state where all three states are equally stable and are at equilibrium. Explain what happens as we heat a block of ice at 1 atm from -25 o. C to 25 o. C?
Quick Question! A substance has a triple point at -24. 5 o. C and 225 mm Hg. What is most likely to happen to a solid sample of the substance as it is warmed from -35 o. C to 0 o. C at a pressure of 220 mm Hg? a. ) The solid will melt into a liquid. b. ) The solid will sublime into gas. c. ) nothing (the solid will remain a solid). b. ) The solid will sublime into a gas. Since the pressure is below the triple point, the liquid state is not stable.
Water is a Fascinating Substance! • Expands when it freezes. – It’s solid state is less dense then it’s liquid state. • It can dissolve certain non-polar molecules such as CO 2 and O 2, by inducing a dipole moment in those molecules. When CO 2 dissolves in water, carbonic acid (H 2 CO 3(aq))is produced. • Has a high boiling point, even though it has a low molar mass. • Has a high specific heat capacity, which keeps costal temperatures tolerable.

11. 6 -11. 9 pg. 538 #’s 79, 82, 86, and 92 Read 11. 12 -11. 13 pgs. 526 -531
- Slides: 9