
10 3 Inequalities An inequality states that two

- Slides: 13
10 -3 Inequalities An inequality states that two quantities either are not equal or may not be equal. An inequality uses one of the following symbols: Symbol < > Meaning Word Phrases is less than Fewer than, below More than, above ≤ is greater than is less than or equal to ≥ is greater than or equal to At least, no less than At most, no more than
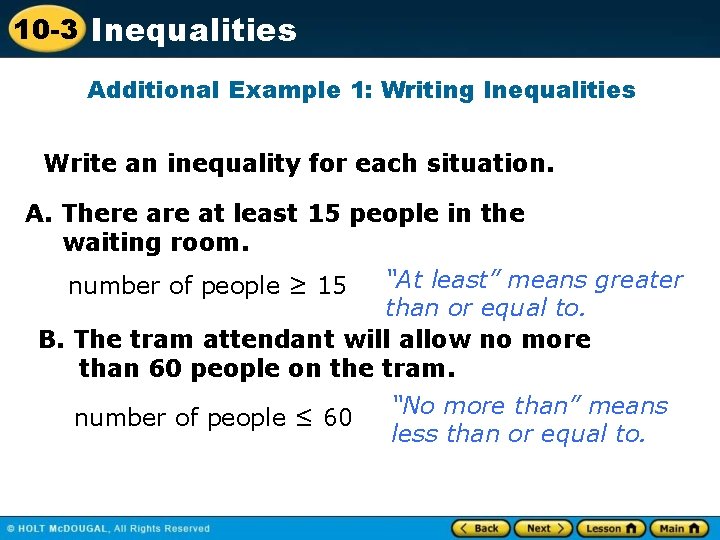
10 -3 Inequalities Additional Example 1: Writing Inequalities Write an inequality for each situation. A. There at least 15 people in the waiting room. “At least” means greater than or equal to. B. The tram attendant will allow no more than 60 people on the tram. number of people ≥ 15 number of people ≤ 60 “No more than” means less than or equal to.
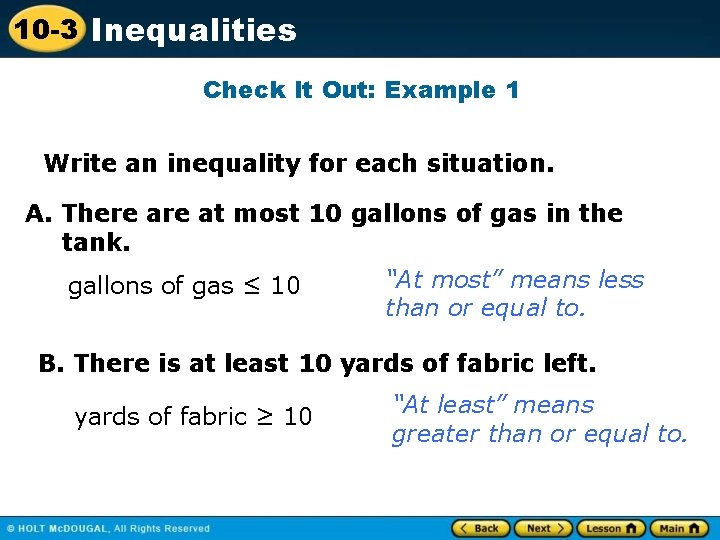
10 -3 Inequalities Check It Out: Example 1 Write an inequality for each situation. A. There at most 10 gallons of gas in the tank. gallons of gas ≤ 10 “At most” means less than or equal to. B. There is at least 10 yards of fabric left. yards of fabric ≥ 10 “At least” means greater than or equal to.
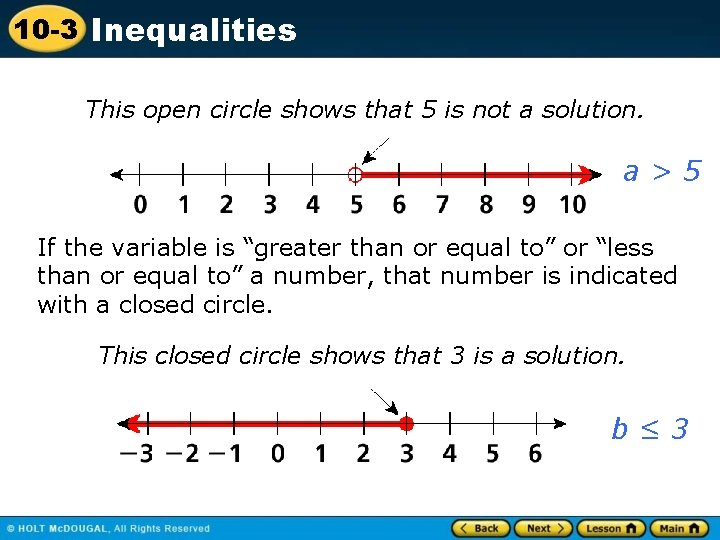
10 -3 Inequalities An inequality that contains a variable is an algebraic inequality. A value of the variable that makes the inequality true is a solution of the inequality. An inequality may have more than one solution. Together, all of the solutions are called the solution set. You can graph the solutions of an inequality on a number line. If the variable is “greater than” or “less than” a number, then that number is indicated with an open circle.
10 -3 Inequalities This open circle shows that 5 is not a solution. a>5 If the variable is “greater than or equal to” or “less than or equal to” a number, that number is indicated with a closed circle. This closed circle shows that 3 is a solution. b≤ 3
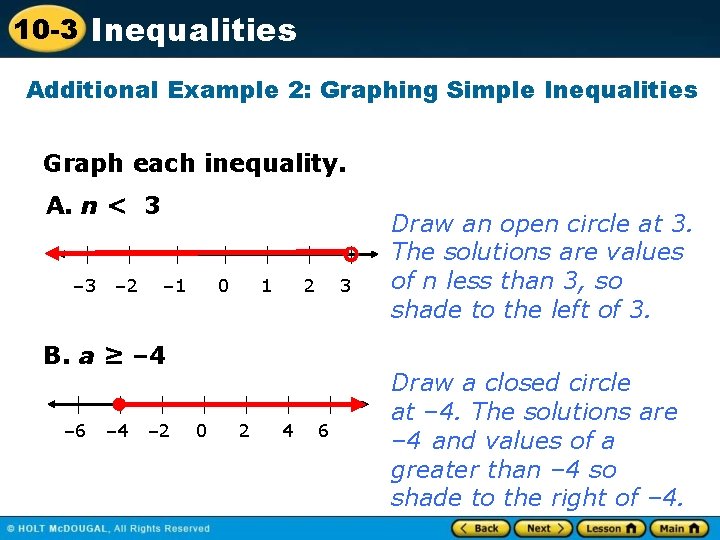
10 -3 Inequalities Additional Example 2: Graphing Simple Inequalities Graph each inequality. A. n < 3 – 2 – 1 0 1 2 3 B. a ≥ – 4 – 6 – 4 – 2 0 2 4 6 Draw an open circle at 3. The solutions are values of n less than 3, so shade to the left of 3. Draw a closed circle at – 4. The solutions are – 4 and values of a greater than – 4 so shade to the right of – 4.
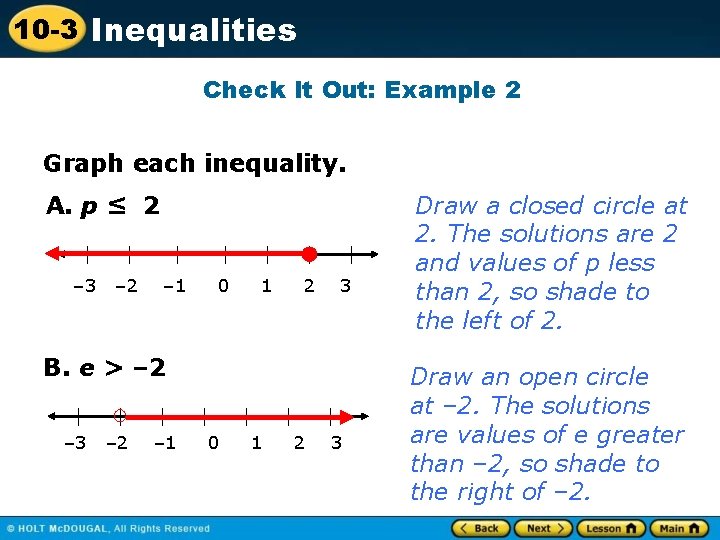
10 -3 Inequalities Check It Out: Example 2 Graph each inequality. A. p ≤ 2 – 3 – 2 – 1 0 1 2 3 B. e > – 2 – 3 – 2 – 1 0 1 2 3 Draw a closed circle at 2. The solutions are 2 and values of p less than 2, so shade to the left of 2. Draw an open circle at – 2. The solutions are values of e greater than – 2, so shade to the right of – 2.
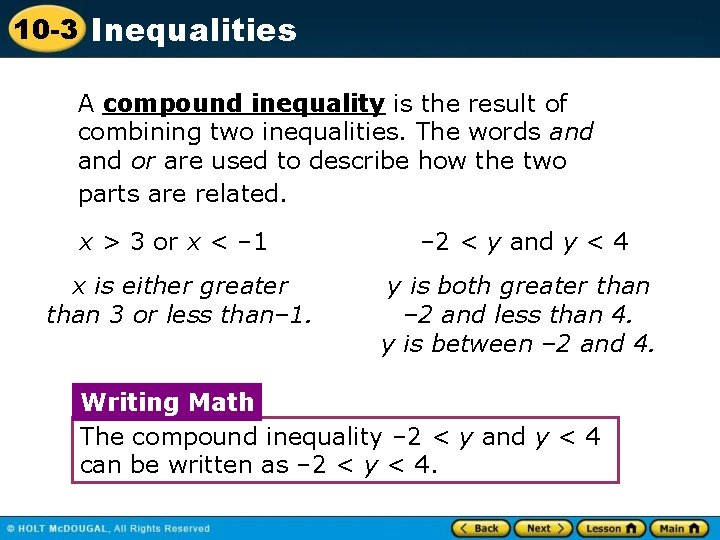
10 -3 Inequalities A compound inequality is the result of combining two inequalities. The words and or are used to describe how the two parts are related. x > 3 or x < – 1 – 2 < y and y < 4 x is either greater than 3 or less than– 1. y is both greater than – 2 and less than 4. y is between – 2 and 4. Writing Math The compound inequality – 2 < y and y < 4 can be written as – 2 < y < 4.
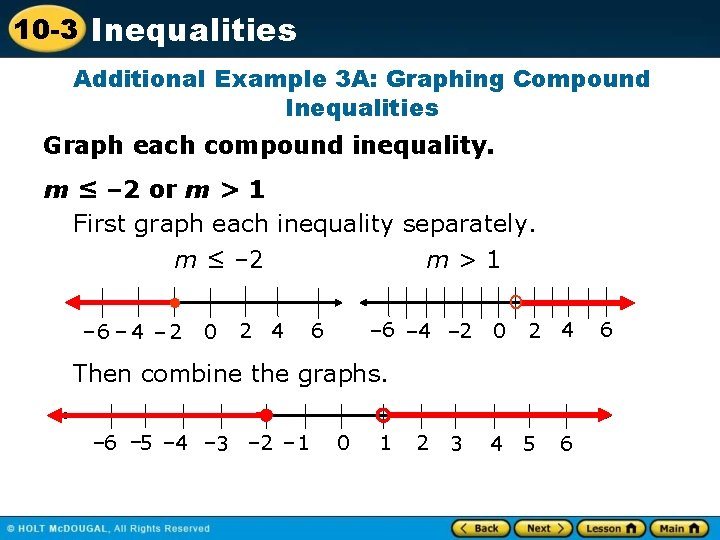
10 -3 Inequalities Additional Example 3 A: Graphing Compound Inequalities Graph each compound inequality. m ≤ – 2 or m > 1 First graph each inequality separately. m ≤ – 2 m>1 • – 6 – 4 – 2 0 2 4 – 6 – 4 – 2 6 0 º 2 4 Then combine the graphs. – 6 – 5 – 4 – 3 – 2 – 1 0 1 2 3 4 5 6 6
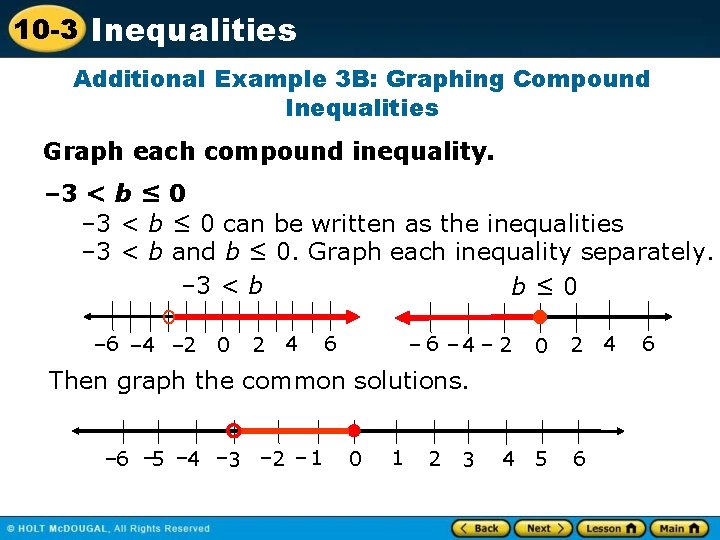
10 -3 Inequalities Additional Example 3 B: Graphing Compound Inequalities Graph each compound inequality. – 3 < b ≤ 0 can be written as the inequalities – 3 < b and b ≤ 0. Graph each inequality separately. – 3 < b b≤ 0 º – 6 – 4 – 2 0 2 4 6 – 4 – 2 • 0 2 4 5 6 Then graph the common solutions. – 6 – 5 – 4 – 3 – 2 – 1 0 1 2 3 4 6
10 -3 Inequalities Reading Math 1 < p is the same as p > 1.
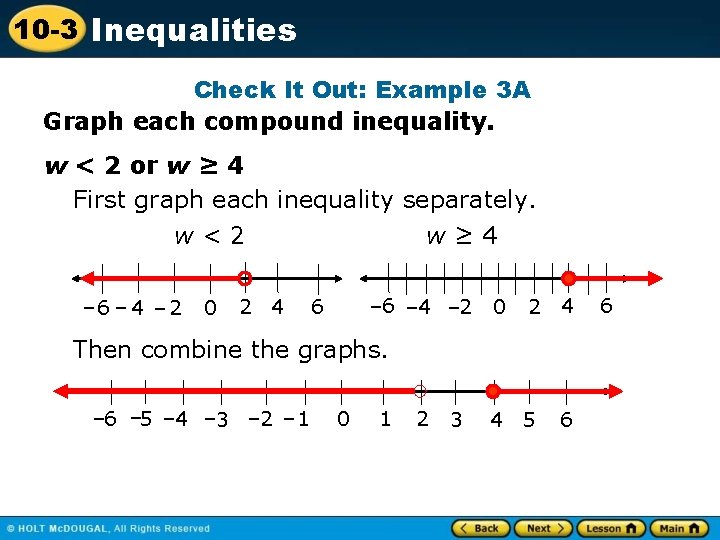
10 -3 Inequalities Check It Out: Example 3 A Graph each compound inequality. w < 2 or w ≥ 4 First graph each inequality separately. w<2 w≥ 4 – 6 – 4 – 2 0 2 4 – 6 – 4 – 2 6 0 2 4 Then combine the graphs. – 6 – 5 – 4 – 3 – 2 – 1 0 1 2 3 4 5 6 6
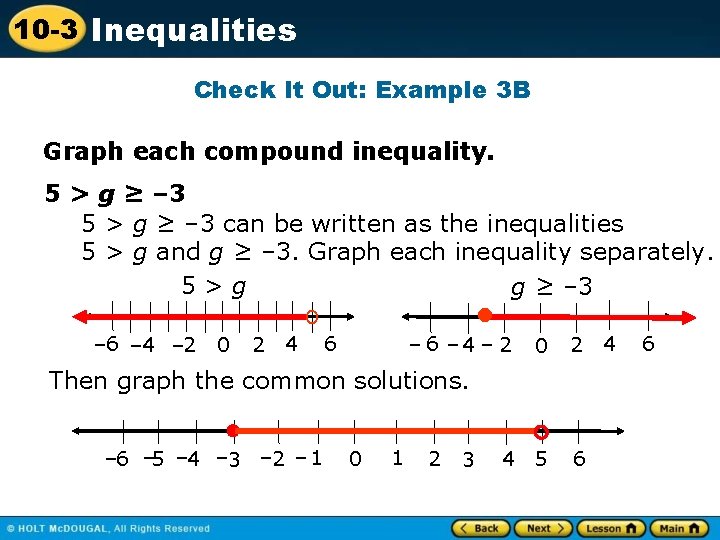
10 -3 Inequalities Check It Out: Example 3 B Graph each compound inequality. 5 > g ≥ – 3 can be written as the inequalities 5 > g and g ≥ – 3. Graph each inequality separately. 5>g g ≥ – 3 – 6 – 4 – 2 0 2 4 º • 6 – 4 – 2 0 2 4 5 6 Then graph the common solutions. – 6 – 5 – 4 – 3 – 2 – 1 0 1 2 3 4 6