10 1 Estimating with Confidence Chapter 10 Introduction


- Slides: 22
10. 1 Estimating with Confidence Chapter 10 Introduction to Inference
Statistical Inference Statistical inference provides methods for drawing conclusions about a population from sample data. Two most common types of statistical inference are confidence intervals and significance tests. Both report probabilities that state what would happen if we used the inference method many times. When you use statistical inference, you are acting as if the data are a random sample or come from a randomized experiment.
IQ and Admissions How would the sample mean vary if we took many samples of 50 freshmen from this same population? To estimate the mean of our population, we use the mean of our sample, x. Although our sample mean, x is an unbiased estimator of our population mean μ, it will rarely be exactly equal to it, so our estimate has some error. The sampling distribution of x tells us how big the error is likely to be when we use x to estimate μ.
Interpreting a confidence interval Our sample of 50 freshmen gave a sample mean of 112. And a standard deviation of σ = 15. The resulting interval is 112 +/- 4. 2, which can be written as (107. 8, 116. 2). We say that we are 95% confident that the unknown mean IQ score for all Big City University freshmen is between 107. 8 and 116. 2.
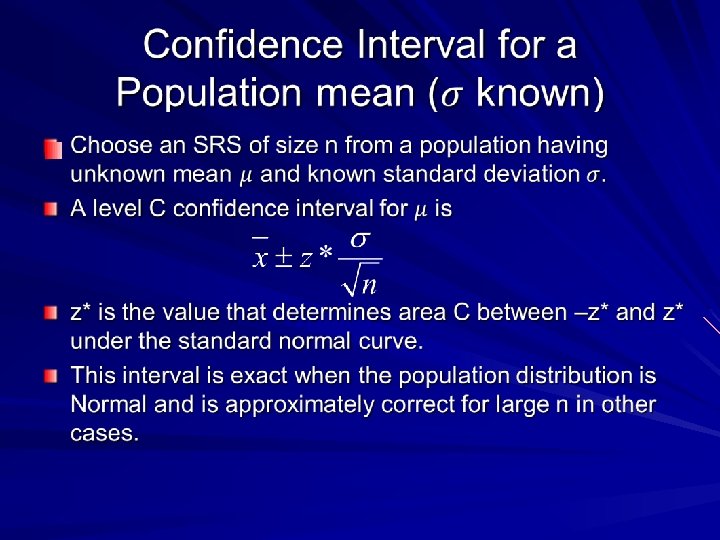
Confidence interval and confidence level A level C confidence interval for a parameter has two parts: A confidence interval calculated from the data, usually of the form estimate +/- margin of error A confidence level C, which gives the probability that the interval will capture the true parameter value in repeated samples. That is, the confidence level is the success rate for the method.
Caution! Probabilities are long-run relative frequencies, and the idea simply doesn’t apply to a found interval. An already constructed interval either does or does not contain the population value. It is correct to give the meaning of “confidence” in terms of probability (e. g. “the probability that my method of constructing intervals will capture the true population value is. 95”) It is never correct to interpret a found interval using the language of probability.
Assignment P. 624 exercises 10. 1 – 10. 3, 10. 5
Conditions for constructing a Confidence Interval SRS Normality Independence
Critical Values The number z* with probability p lying to the right under the standard Normal curve is called the upper p critical value of the standard Normal distribution. z* can be found using either Table A or Table C.
Inference Toolbox Step 1: Parameter Step 2: Conditions Step 3: Calculations Step 4: Interpretation
Assignment P. 632 exercises 10. 7 – 10. 12
How Confidence Intervals Behave: We would like high confidence and a small margin of error High confidence says that our method almost always gives correct answers A small margin of error says that we have pinned down the parameter quite precisely
The margin of error gets smaller when… z* gets ______ smaller σ gets ______ smaller n gets ______ larger
Example 10. 6 Changing the confidence level What effect does changing the confidence level have?
Choosing the sample size You can arrange to have both high confidence and a small margin of error by taking enough observations. To obtain a desired margin of error, substitute the value of z* for your desired confidence level, set the expression for m less than or equal to the specified margin of error, and solve the inequality for n. Example 10. 7
The required sample size may not be practical due to the time and money involved. The size of the sample determines the margin of error…the size of the population does not influence the sample size needed.
Some Cautions on using the formula for confidence intervals pg 636 The data must be from an SRS from the population. This formula does not work for more complex probability sampling designs. Fancy formulas cannot rescue badly produced data. Beware of outliers. Be careful of small samples and non-normal populations. You must know the standard deviation of the population.
The most important caution concerning confidence intervals is that the margin of error in a confidence interval covers only random sampling errors. Undercoverage and nonresponse in a sample survey can cause additional errors that may be larger than the random sampling error.
Assignment P. 637 exercises 10. 13 – 10. 18
What statistical confidence does and does not say: A 95% confidence interval means that we are 95% confident that the mean score for the population lies in the interval. These numbers were calculated by a method that gives correct results in 95% of all possible samples. The probability is 95% that the true mean falls in that interval. No randomness remains after we draw one particular sample and get from it one particular interval. The true mean either is or is not in the interval. The probability calculations of standard statistical inference describe how often the method gives correct answers.
Exercises Section 10. 1 exercises on page 640, 10. 19 - 10. 26 Make sure you do 10. 26!