10 1 A Comparing two population proportions Stat


 ≥ 10")


 ≥ 10")


 (Shape b/c we met the")


- Slides: 47
10. 1 A Comparing two population proportions Stat shirt vote on Feb 26 th so submit any ideas!
Is yawning contagious? Yawn Seed? Subject Yawned? Yes No Total Yes 10 4 14 No 24 12 36 Total 34 16 50
Trial Number who yawned in yawn seed group Number who yawned in no yawn seed group Difference in proportions (yawn seed-no yawn seed) 1 8 6 8/34 -6/16= -0. 14 2 3 4 5
Trial Number who yawned in yawn seed group Number who yawned in no yawn seed group Difference in proportions (yawn seed-no yawn seed) 1 8 6 8/34 -6/16= -0. 14 2 3 4 5
Trial Number who yawned in yawn seed group Number who yawned in no yawn seed group Difference in proportions (yawn seed-no yawn seed) 1 8 6 8/34 -6/16= -0. 14 2 10 4 10/34 -4/16= 0. 044 3 11/34 -3/16= 0. 14 4 8 6 -0. 14 5 9 5 -. 048 1) 2) 3) 4) 5) In what percent of trials did the difference in proportions equal or exceed. 0441? How surprising would it be to get a result this large or larger simply due to chance? Is this statistically significant? Conclusion? Type 1 error? Type 2 error?
10. 1 Objectives: Ø Check your conditions Ø Construct & Interpret a confidence interval to compare two proportions Ø Perform a significance test to compare two proportions Ø Interpret your results
Imagine we want to compare the true proportion of lefthandedness in two populations— Americans and Canadians. This is an observation…. no imposition of treatment!
Imagine we want to compare the effectiveness of two medicines. We design an experiment and then we compare the proportion of successes in each treatment group.
In BOTH cases, we have the following statistical variables. Population or Parameter Treatment Statistic Sample Size 1 2 So, how do we compare them?
Let’s start with this scenario: At school #1, 70% of the entire student body did their homework last night. At school #2, 50% of the entire student body did their homework last night.
Suppose we take a SRS of 100 students from school #1 and record the sample proportion of students who did their homework.
Shape Approx Normal if np ≥ 10 and n(1 - p) ≥ 10
Sampling Distribution School #1 we’ve met RIN, so…
Now we take a SRS of 200 students from school #2 and record the sample proportion of students who did their homework.
Shape Approx Normal if np ≥ 10 and n(1 - p) ≥ 10
Sampling Distribution School #2 we’ve met RIN, so…
We would like to compare the sample proportions of students who do their homework at these two schools….
(Spread b/c we met the indep condition for both) (Shape b/c we met the norm condition for both!) (Center, always true)
The two-sample z-interval for the difference in proportions
Recap of the Conditions Random—data are produced by taking random samples from both populations or by having two groups in a randomized experiment
Recap of the Conditions Independent— Ø Both the samples or groups themselves AND the individual observations in each sample or group are independent. Ø When sampling w/o replacement, be sure that you meet the 10% condition for both samples.
Test Info: I have a few people who haven’t taken the test yet, so I’m not passing it back. We will go over the answers on Wed. You can see the scores on Student. Vue You have got to organize your work better. Some of you are all over the place and/or Have hard to read handwriting. P-value cannot be greater than 1. It is a probability A really high p-value should be a red-flag.
Recap of the Conditions
Recap of the Conditions
Example Are older people more likely to perceive the color of “the dress” as white and gold? https: //www. youtube. com/watch? v=jexnh. Nf. Oz. Hg https: //www. youtube. com/watch? v=ev. Qs. O FQju 08
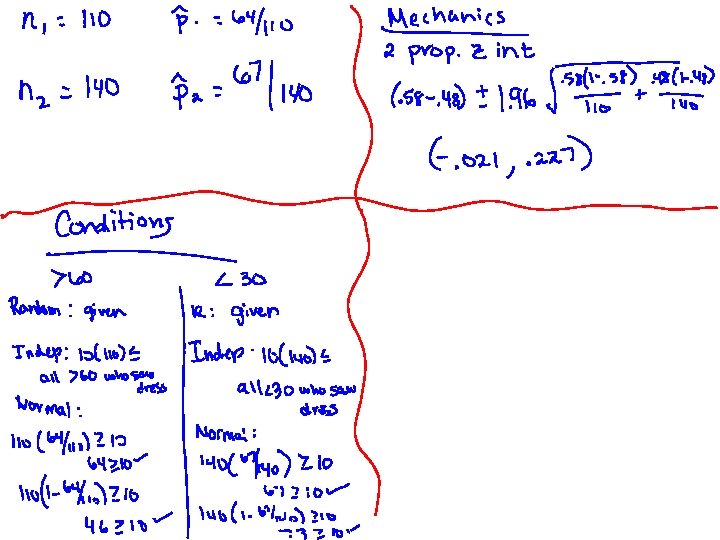
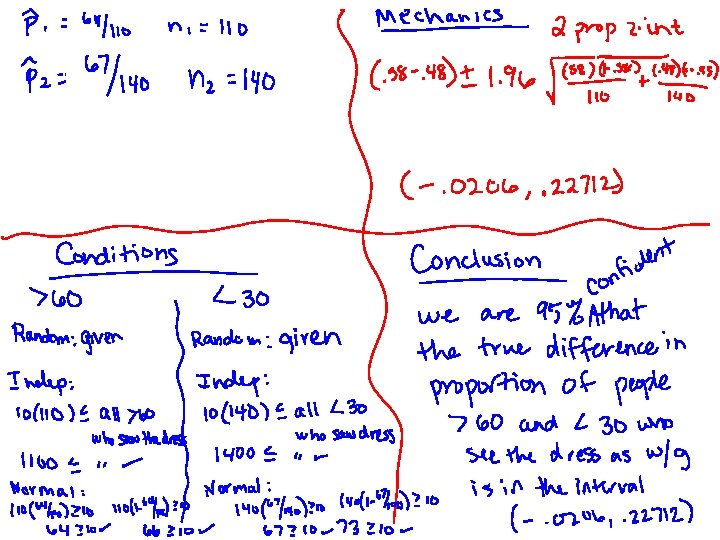
Separate random samples, one of people over the age of 60 and the other of people under 30, were shown a picture of “the dress” and the number in each group who identified it as white and gold was recorded. The results are listed in the table below: Group Over 60 Under 30 Sample size 110 140 Saw Gold and White 64 67
Group Over 60 Under 30 Sample size 110 140 Saw Gold and White 64 67 Use these results to construct and interpret a 95% confidence interval for the difference in population proportion of those over 60 and those under 30 years of age who would see “the dress” as white and gold.
10. 1 B Comparing two population proportions
Objectives: • Perform a significance test to compare two proportions. • Interpret the results of inference procedures in a randomized experiment.
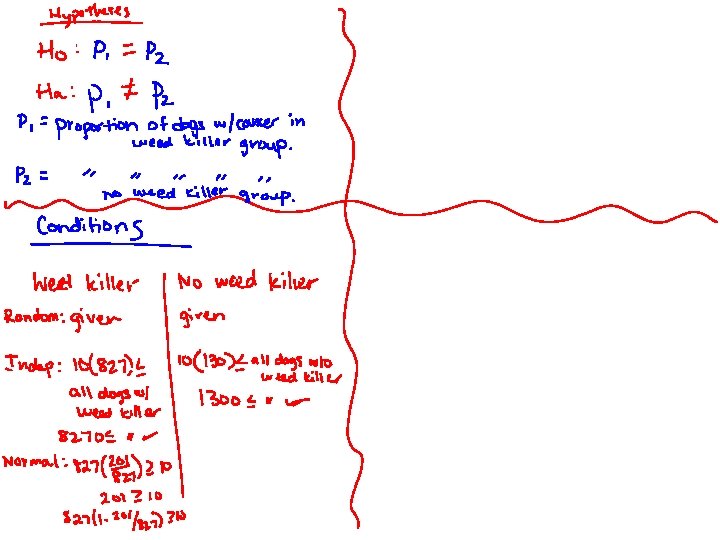
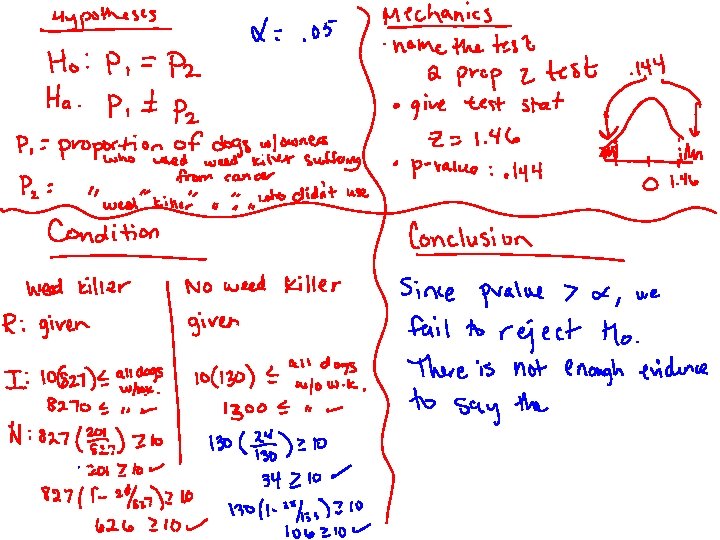
Example 1 Weed Killer & Canine Cancer A vet wanted to know if exposure to weed killers was a health risk to dogs. She gathered data on random samples of dog owners and recorded weed killers and canine cancer.
Weed Killer and Canine Cancer Is this an experiment? Has there been random assignment? What kind of conclusions would we be able to make?
Ex. 1 con’t Group Dogs with owners who used weed killer Dogs with owners who used no weed killer N X 827 201 130 24 N represents the number in the sample. X represents the number of dogs in the sample who suffered from canine cancer
Ex. 1, con’t Is there a statistically different proportion of dogs with cancer in homes that use weed killer compared to those which do not? Hypotheses Conditions Mechanics Decision linked in context
Example 2—Carpal Tunnel Say you suffer from carpal tunnel. Would it be better to have immediate surgery or to splint your wrists and let nature take its course? 176 patients with CT were randomly assigned to either surgery or splints. After 3 months, their progress was measured.
Is this an experiment? Has there been random assignment? What kind of conclusions would we be able to make?
Ex. 2 con’t Group N P-hat Carpal Tunnel with surgery Carpal Tunnel with wrist splints 88 80% 88 54% P-hat represents the % of the sample whose symptoms had improved after 3 months.
Ex. 2, con’t Is the proportion of CT suffers whose symptoms improved after surgery greater than those who let nature take its course? Hypotheses Conditions Mechanics Decision linked in context
Ex 3—A Fertility Clinic A clinic is interested in its effectiveness at treating infertility. Specifically, they are interested in whether methods are more successful with younger women.
Is this an experiment? Has there been random assignment? What kind of conclusions would we be able to make?
Ex. 3 con’t Age of patients N Less than 38 yrs 157 # of live births 42 38 yrs or older 89 7
Ex 4—PBS Fund Drive A local PBS station wishes to see if asking current members to donate additional money is more effective via email or via regular mail. It contacted a random sample of donors via one of the two methods, randomly assigned. Is the proportion of donors who respond different for the groups?
Ex. 4 con’t Type of Ask N X Email 70 11 Regular Mail 76 16 X represents the number of donors who contributed additional money via the type of “ask” mode.