1 Why do we need domains and ranges


 we call")

")


 = x 2 - 1, g(x) = x +1, find (f.")


")


 and (x 2, y 2), determine")

=ax 2 + bx + c are called quadratic functions because they")

= x 2 -2 ax+2 a+3 Find the")


- Slides: 47
1
Why do we need domains and ranges? Domains and ranges are important ideas that will help us to understand the relationship between two variables in an equation, especially when we begin graphing. 4
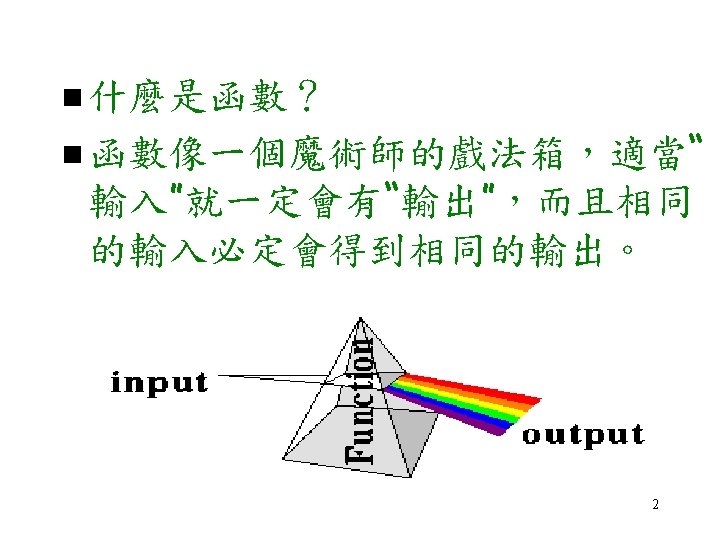
What is a function? In general, a compact description of the data, that gives the values of some of the fields in terms of the others, is called a function. A variable y is a function of x if a relation between x and y produces exactly one value of y for each value of x. 11
The variable x is called the independent variable. If y = f(x) we call y the dependent variable. A function can be specified: numerically: by means of a table algebraically: by means of a formula graphically: by means of a graph 12
A Numerically Specified Function: Ex: Suppose that the function f is specified by the following table. x 0 1 2 3 f(x) 3. 01 -1. 03 2. 22 0. 01 Then, f(0) is the value of the function when x = 0. f(0) = 3. 01 Look on the table where x = 0 f(1) = -1. 03 Look on the table where x = 1 and so on. 13
An Algebraically Specified Function: Ex: Suppose that the function f is specified by f(x) = 3 x 2 - 4 x + 1. Then f(2)= 3(2)2 - 4(2) + 1 Substitute 2 for x= 12 - 8 + 1 = 5 f(-1)= 3(-1)2 - 4(-1) + 1 Substitute -1 for x= 3 + 4 + 1 = 8 14
In other words, a function "maps" one type of value to another. The set X is the domain and the set y is the range of the function. How do we find Domains & Ranges Let's take a look at an equation that has two unknown variables. In order to graph or plot this function, we have to give X a fixed value and substitute X into the equation to find out what the value of Y would be. 15
Suppose that we let X be 0, then Similarly, if we let X be 1, then 16
If we let X be -3, -2, -1, 0, 1, 2, 3 respectively and substitute each value of X into the equation, then the set of ordered pairs would be: If we use the set of ordered pairs above to plot the graph, the graph would be: 17
What is the domain and range associated with the given function? 18
n n The domain for the above function is the set of all real numbers. If we examine the set of ordered pairs, it will include {. . . , -3, -2, -1, 0, 1, 2, 3, . . . }. The range for the above function is the set of all real numbers greater than or equal to -3. If we examine the set of ordered pairs, it will include {. . . , 6, 1, -2, -3, -2, 1, 6, . . . }. 19
What is a Linear Function? A linear function is one whose graph is a straight line. f(x) = mx + b y = mx + b Function form Equation form 20
What is a Non-Linear Function? Did you notice that the linear function is a polynomial function of degree 1? A quadratic function is a polynomial function of degree 2, defined by an equation of the form y = a x 2 + b x + c 21
Basic operations on functions We can define the four basic operations --sum, difference, product, and quotient --as follows: If the ranges of functions f and g are subsets of the real numbers, then n n The sum of f and g, denoted as f+g, is defined as (f+g)(x)= f(x) + g(x) The difference of f and g, denoted as f-g, is defined as (f-g)(x)= f(x) - g(x) 22
Basic operations on functions n n The product of f and g, denoted as f. g, is defined as (f. g)(x) =f(x). g(x) The quotient of f and g, denoted as f/g, is defined as (f/g)(x) = f(x)/g(x) Did you realize that the basic operations on functions are so simple and straightforward? 23
Ex: If f(x) = x 2 - 1, g(x) = x +1, find (f. g)(x) and (f/g)(x) Sol: (f. g)(x) = f(x). g(x) = (x 2 - 1)(x+1) =x 3 + x 2 - x - 1 (f/g)(x) = f(x)/g(x) = (x 2 - 1)/(x + 1) = (x +1)(x -1)/(x+1) = (x - 1) 24
n What is a function? n What is a linear function? n Find (f- g)(x) if f(x)= x 3+x and g(x)= x 2 +1 25
The Role of b in the equation y = mx + b Ex: y = 3 x - 1 This linear equation has m = 2 and b = -1. setting x = 0 gives y = -1, the value of b. Numerically, b is the value of y when x = 0 Graphically, b is the y-intercept of the grap 26
Ex: y = 0. 5 x + 2 so that b = 2 (y-intercept) and m = 0. 5 (slope). the graph cuts the y-axis at b = 2, and goes up 0. 5 units for every one unit to the right. 27
Graph of y = mx + b positive slope negative slope 28
Ex: y = 3 x – 1 Now we know that y increases by 3 for every 1 -unit increase in x. Similarly …. In general, y increases by 3 x units for every x-unit change in x. Using symbols, y=3 x y x =3 = slope 29
m= Change in y y= Change in x Rise = Run 30
Ex: Fill in the slopes of the following lines. 31
Ex: Two points, say (x 1, y 1) and (x 2, y 2), determine a line in the xy-plane. How do we find its slope? the rise is y = y 2 - y 1 the Run is x = x 2 - x 1 32
We can compute the slope m of the line through the points (x 1, y 1) and (x 2, y 2) using y 2 - y 1 Y m= = x x 2 - x 1 33
Quadratic Functions f(x)=ax 2 + bx + c are called quadratic functions because they involve the second power or square of the variable. Any quadratic function ax 2 + bx + c can be written in the form a (x - h)2 + constant. In fact, we have ax 2 + bx + c = a[x + b/(2 a)]2 + c - b 2/(4 a 2). 34
Ex: Animation of the method 3 x 2 +5 x+2 Ex: Animation of the method 6 x 2 +9 x+7 35
Minimum Value of Quadratic Functions Ex: f(x)= x 2 -2 ax+2 a+3 Find the minimum value of the function. Sol: The graphs of the quadratic functions f(x)= x 2 -2 ax+2 a+3 depend on the parameter "a". 36
37
If y = x 2 - ax + a and the interval of x is 0 ≤ x ≤ 2, let M(a)= maximum value of y and m(a)= minimum value of y n Find M(a) and m(a) n. Draw the graph of b=M(a) and b=m(a) 38
39
x-y graph 40
41
Ex: y= x 2 -2 x+2 Find the minimum value of y. Ex: y= -3/2(x 2 -2 x+2)2 +2(x 2 -2 x+2) +3 Find the maximum value of y. 42
43
44
Exponential Rules n To multiply identical bases, add the exponents. Ex: 27 • 29 means Ex: 370 • 319 can be simplified to 45
To divide identical bases, subtract the exponents. Ex: 47 can be written 43 n Ex: Simplify 7 a 10 b 2 c 4 14 a 9 bc 5 46
n When there are two or more exponents and only one base, multiply the exponents. Ex: (57)3 can be written 57 • 57 Ex: Simplify ((27)10)6 Ex: Simplify (57)10 • (52)7 • (520)50 (510)25 47