1 The standard form of a quadratic equation


,")


- Slides: 9
1. The standard form of a quadratic equation is y = ax 2 + bx + c. 2. The graph of a quadratic equation is a parabola. 3. When a is positive, the graph opens up. 4. When a is negative, the graph opens down. 5. Every parabola has a vertex. For graphs opening up, the vertex is a minimum (low point). For graphs opening down, the vertex is a maximum (high point). 6. The x-coordinate of the vertex is equal to .
To find the x coordinate of the vertex, use the equation Then substitute the value of x back into the equation of the parabola and solve for y. You are given the equation y=-x 2 + 4 x – 1. Find the coordinates of the vertex. y = - x 2 + 4 x - 1 a = - 1, b= 4 b = x 2 a 4 x= ( 2 )( - 1 ) x = 2 Substitute and solve for y y = - ( 2) 2 + 4 ( 2) – 1 y = -4 + 8 - 1 y=3 The coordinates of the vertex are (2, 3)
ØChoose two values of x that are to the right or left of the x-coordinate of the vertex. ØSubstitute those values in the equation and solve for y. ØGraph the points. (Keep in mind the value of a as this will help you determine which way the graph opens. ) ØSince a parabola is symmetric about the vertical line through the vertex, you can plot mirror image points with the same y-values on the “other side” of the parabola. x y = -x 2 + 4 x – 1 2 + 4(1) – 1 y = -(1) 1 -1 y = -1 +4 – 1 y = -(-1)2 + 4(-1) – 1 y = -1 – 4 – 1 y 2 -6
y Plot the vertex and the points from your table of values: (2, 3), (1, 2), ( -1, -6). Use the symmetry of parabolas to plot two more points on the “other side” of the graph. The point (1, 2) is one unit away from the line of symmetry, so we can also plot the point (3, 2). The point (-1, -6) is three units away from the line of symmetry, so we can also plot the point (5, -6). Sketch in the parabola. x
Find the vertex of the following quadratic equations. Make a table of values and graph the parabola.
Notice, a is positive, so the graph opens up. y x The vertex is at (2, -4)
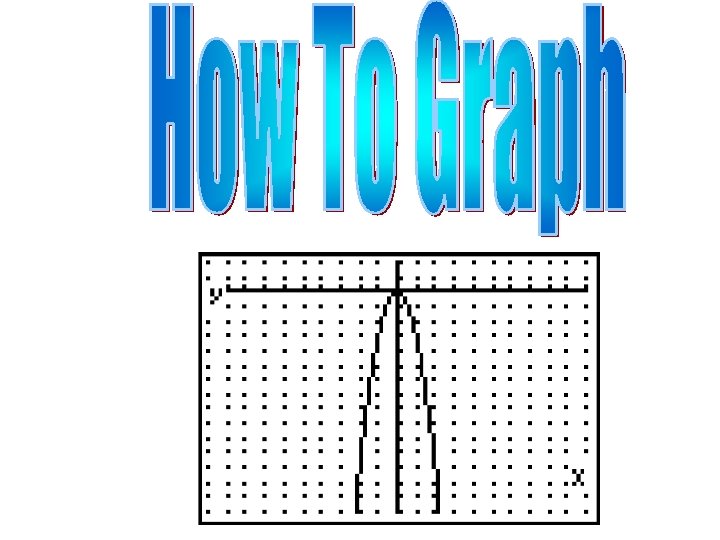
Notice, a is negative, so the graph opens down. y x The vertex is at (0, 3)
Notice, a is positive, so the graph opens up. y x The vertex is at (3, -5)