
1 The Elecrocardiogram ECG By Dr Maha Alenazy
1 The Elecrocardiogram (ECG) By Dr. Maha Alenazy
Points of Discussion 2 � What is ECG? � How to preform ECG? � Interpretation of ECG results: � waves and segments � Their clinical applications � Some ECG abnormalities � HR � How to calculate Cardiac axis

3 �Learn basics of ECG to interpret results for clinical significance.
What is ECG? 4 �ECG = electro + cardio + graphy. �A recording of the electrical activity of the heart. �Cardiac impulse passes through the heart forming an electrical current spreading in the surrounding tissue which in turn generate electrical potentials. �ECG measures the differences in these electrical potentials.
Why Is The ECG Important? 5 �It is a widely used & useful investigation in medicine. �Used for: Identification of cardiac rhythm disturbances. Diagnosis of cardiac disorders e. g. MI. Generalized disorders that affect the body e. g. electrolyte disturbances.
How is the ECG recorded? 6 �It is recorded by electrodes placed on the surface of the body. �The electrocardiograph (the ECG machine) measures the potential differences between the electrodes and records them. �The arrangement of a pair of electrodes constitute a lead.
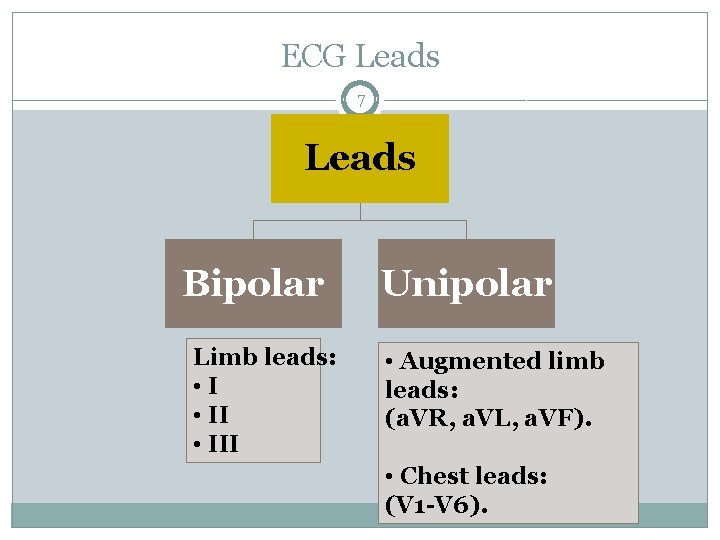
ECG Leads 7 Leads Bipolar Limb leads: • III Unipolar • Augmented limb leads: (a. VR, a. VL, a. VF). • Chest leads: (V 1 -V 6).
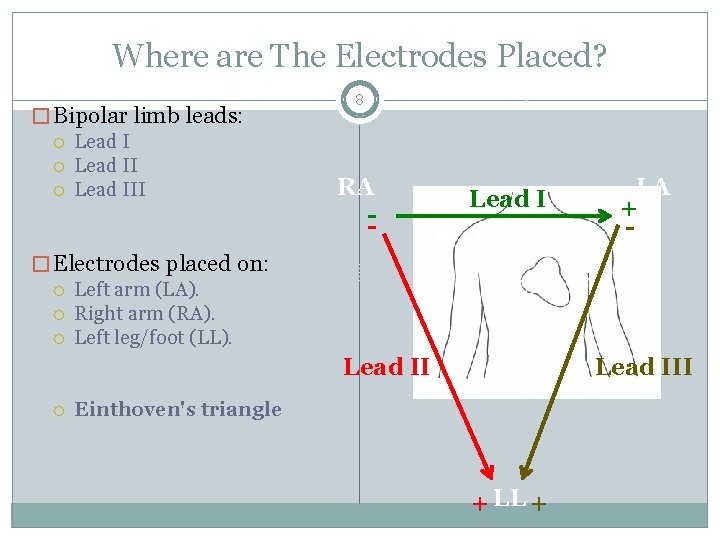
Where are The Electrodes Placed? � Bipolar limb leads: Lead III 8 RA -- Lead I LA + - � Electrodes placed on: Left arm (LA). Right arm (RA). Left leg/foot (LL). Lead III Einthoven's triangle + LL +
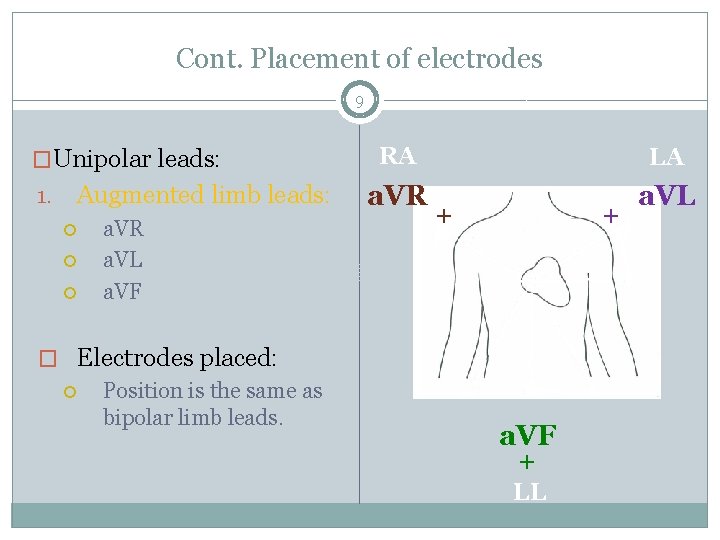
Cont. Placement of electrodes 9 �Unipolar leads: Augmented limb leads: 1. a. VR a. VL a. VF � Electrodes placed: Position is the same as bipolar limb leads. RA LA a. VR a. VL + + a. VF + LL
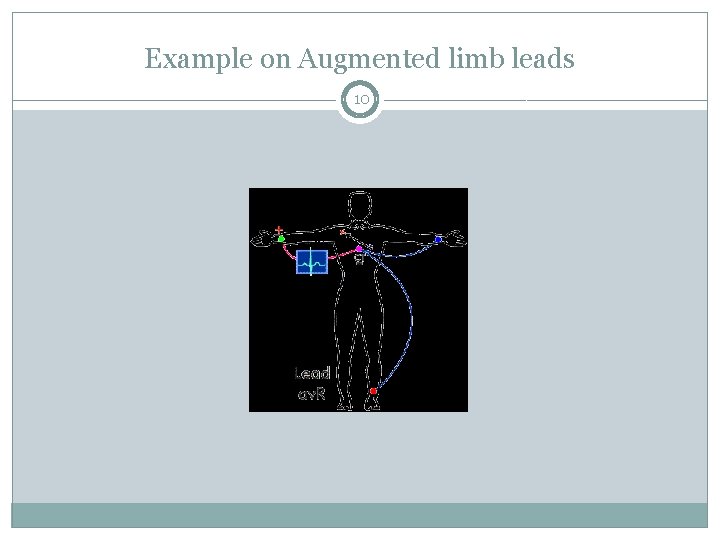
Example on Augmented limb leads 10
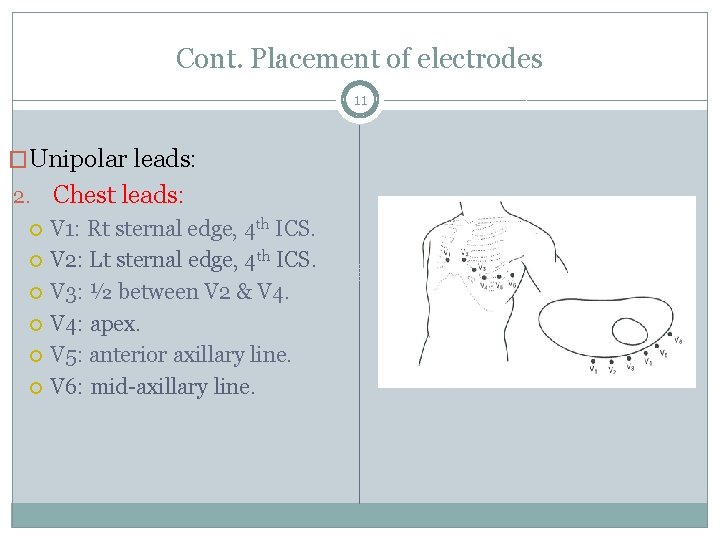
Cont. Placement of electrodes 11 �Unipolar leads: 2. Chest leads: V 1: Rt sternal edge, 4 th ICS. V 2: Lt sternal edge, 4 th ICS. V 3: ½ between V 2 & V 4: apex. V 5: anterior axillary line. V 6: mid-axillary line.
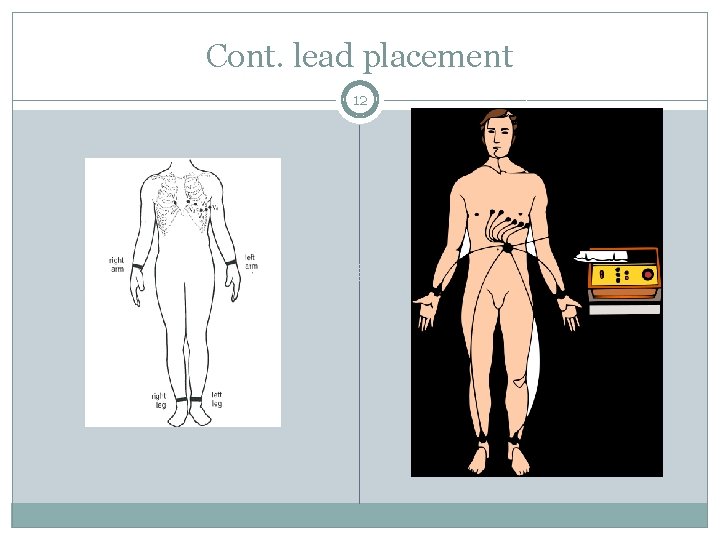
Cont. lead placement 12
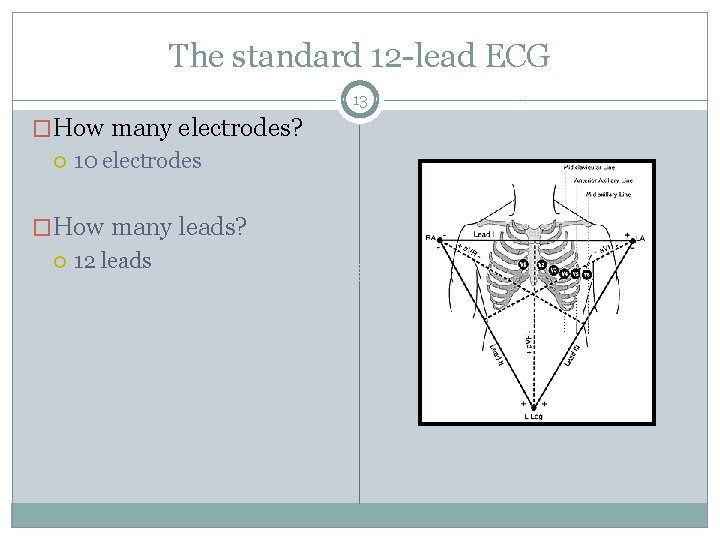
The standard 12 -lead ECG 13 �How many electrodes? 10 electrodes �How many leads? 12 leads
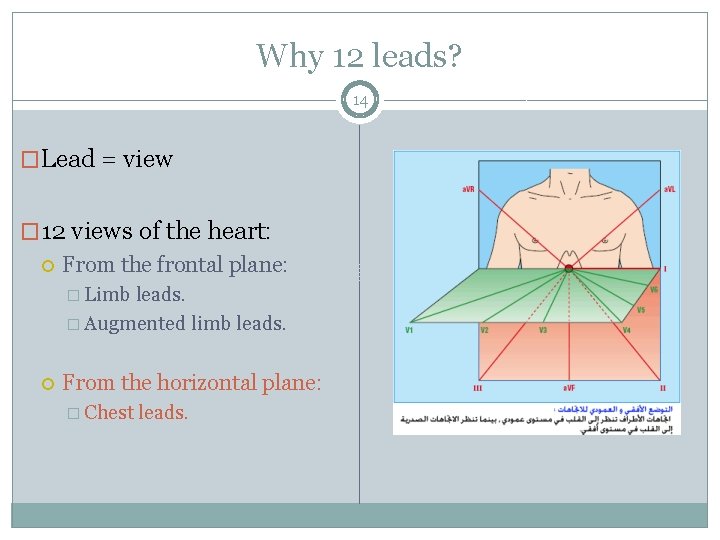
Why 12 leads? 14 �Lead = view � 12 views of the heart: From the frontal plane: � Limb leads. � Augmented limb leads. From the horizontal plane: � Chest leads.
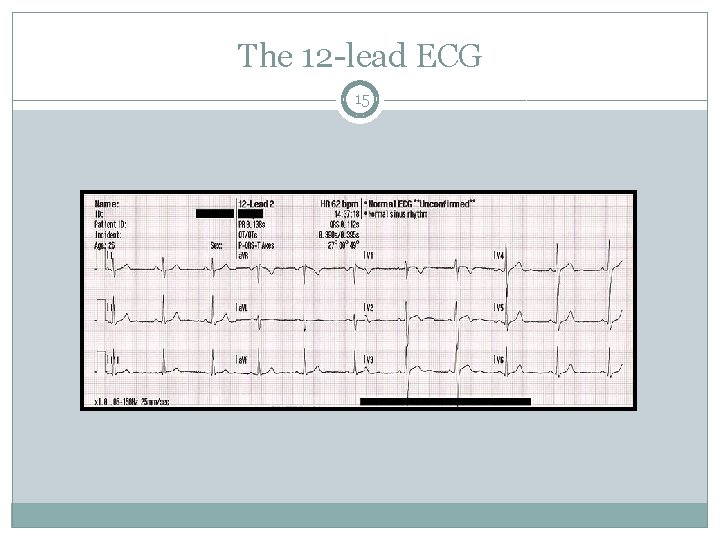
The 12 -lead ECG 15
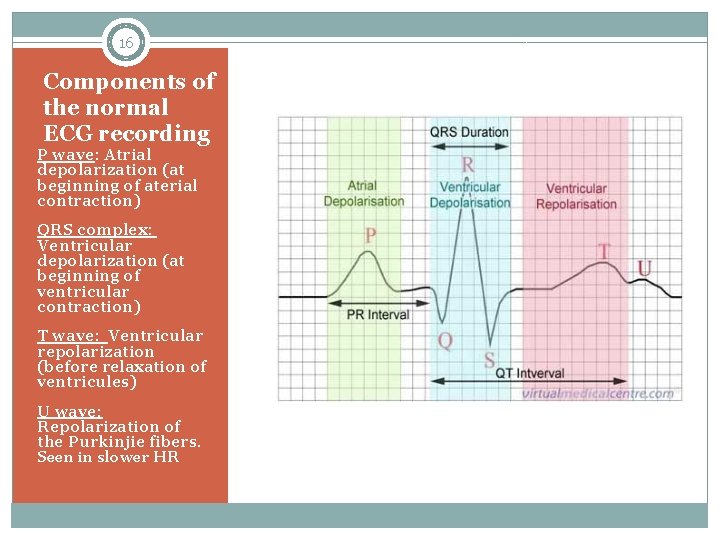
16 Components of the normal ECG recording P wave: Atrial depolarization (at beginning of aterial contraction) QRS complex: Ventricular depolarization (at beginning of ventricular contraction) T wave: Ventricular repolarization (before relaxation of ventricules) U wave: Repolarization of the Purkinjie fibers. Seen in slower HR
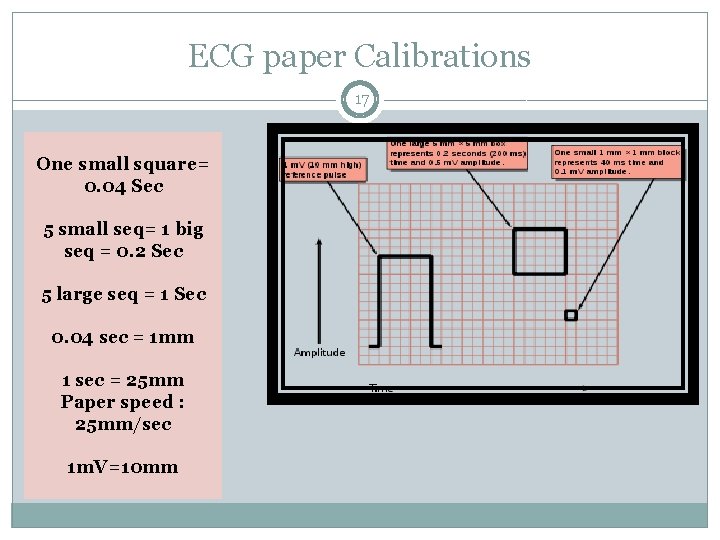
ECG paper Calibrations 17 One small square= 0. 04 Sec 5 small seq= 1 big seq = 0. 2 Sec 5 large seq = 1 Sec 0. 04 sec = 1 mm 1 sec = 25 mm Paper speed : 25 mm/sec 1 m. V=10 mm
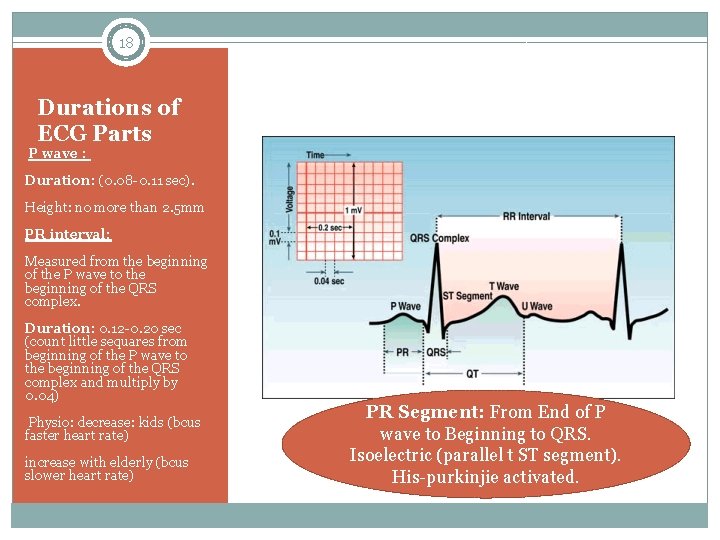
18 Durations of ECG Parts P wave : Duration: (0. 08 -0. 11 sec). Height: no more than 2. 5 mm PR interval: Measured from the beginning of the P wave to the beginning of the QRS complex. Duration: 0. 12 -0. 20 sec (count little sequares from beginning of the P wave to the beginning of the QRS complex and multiply by 0. 04) Physio: decrease: kids (bcus faster heart rate) increase with elderly (bcus slower heart rate) PR Segment: From End of P wave to Beginning to QRS. Isoelectric (parallel t ST segment). His-purkinjie activated.
Abnormalities 19 P WAVE �If taller/pointed or wider than normal, this may indicate: � COPD �CHF �valvular disease �Aterial enlargement �Inverted P wave: ectopic P wave in AV junction. PR Interval �Long PR interval (+0. 20 sec): impluse is delayed through ateria or AV node as in: � 1 st degree HB �Hypothyroidism �Digitalis toxicity �Short PR interval (0. 12): ectopic pacemaker.
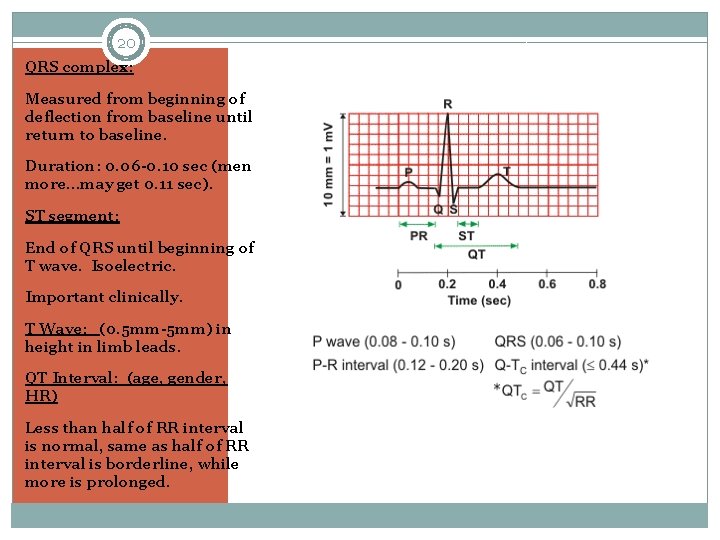
20 QRS complex: Measured from beginning of deflection from baseline until return to baseline. Duration: 0. 06 -0. 10 sec (men more…may get 0. 11 sec). ST segment: End of QRS until beginning of T wave. Isoelectric. Important clinically. T Wave: (0. 5 mm-5 mm) in height in limb leads. QT Interval: (age, gender, HR) Less than half of RR interval is normal, same as half of RR interval is borderline, while more is prolonged.
Abnormalities 21 �QRS: �Ectopic pace maker can cause longer QRS (more than 0. 12…around 0. 16 or more). �Enlargement of right Ventricle causes abnormal large R wave while enlargement of the left ventricle causes abnormally prominent S wave.
Cont. Abnormalities 22 �ST segment: �Depression: Myocardial ischemia or Hypokalemia, digitalis. �Elevation: Myocardial injury, pericarditis, ventricular aneurysm �T wave: �If opposite to QRS and –ve: MI �Tall and peaked: hyperkalemia �Inverted: Cereberal.
U Wave 23 �Average height is 0. 33 mm. If taller than 1. 5 mm: electrolyte imbalance (hypokalemia, hypomagnesemia, hypercalcemia), medications (digitlalis, etc), hyperthyrodisim, NS disease. � -ve U wave: heart disease such as ischemic heart disease.
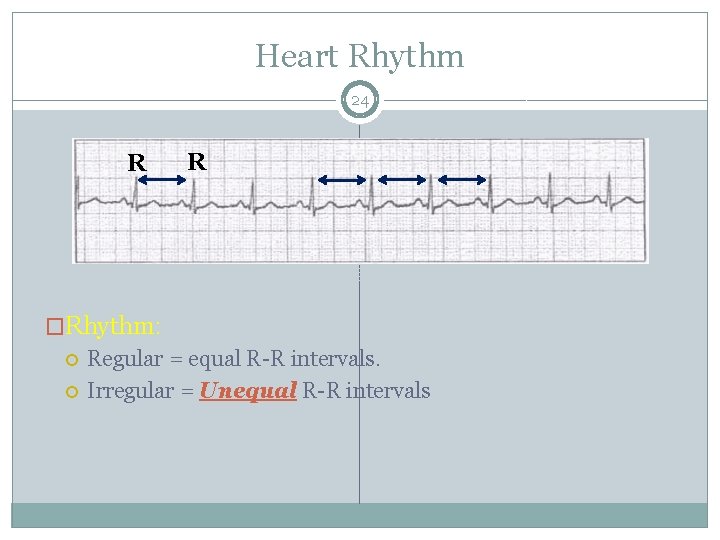
Heart Rhythm 24 R R �Rhythm: Regular = equal R-R intervals. Irregular = Unequal R-R intervals
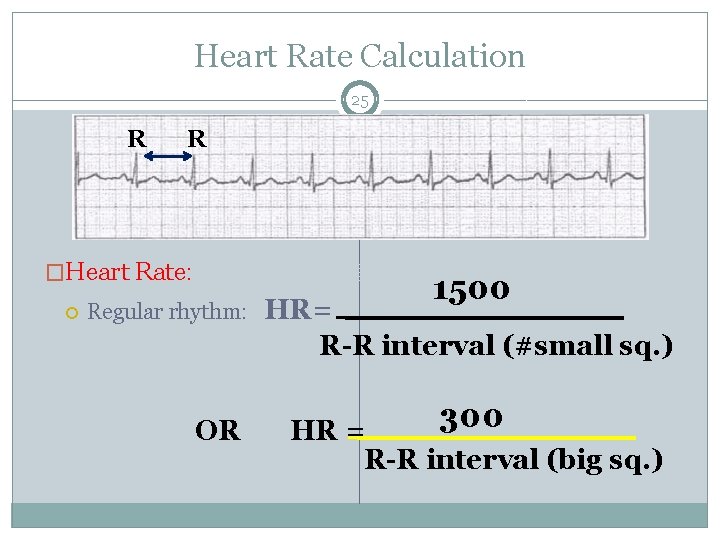
Heart Rate Calculation 25 R R �Heart Rate: Regular rhythm: OR 1500 HR= R-R interval (#small sq. ) 300 HR = R-R interval (big sq. )
Cont. HR calculation 26 �Irregular rhythm: Count number of QRS complexes in 30 big sq. = no. of QRS in 6 seconds. Multiply by 10.
Heart Rate 27 �Normal = 60 -100 bpm (beats per minute). �< 60 bpm = bradycardia. �> 100 bpm = tachycardia. �Sinus Arrhythmia: occurs when SA node discharges irregularly. If associated with respiration changes, it is called respiratory sinus arrhythmia. Inspiration causes HR is up, R-R shortens. Opposite in expiration.
Heart Block (AV Block) 28 �May occur at the AV node, Bundle of His, r Purkinjie fibers. �PR interval duration is used to determine the type of HB �QRS width is used to assess the level of location of the block
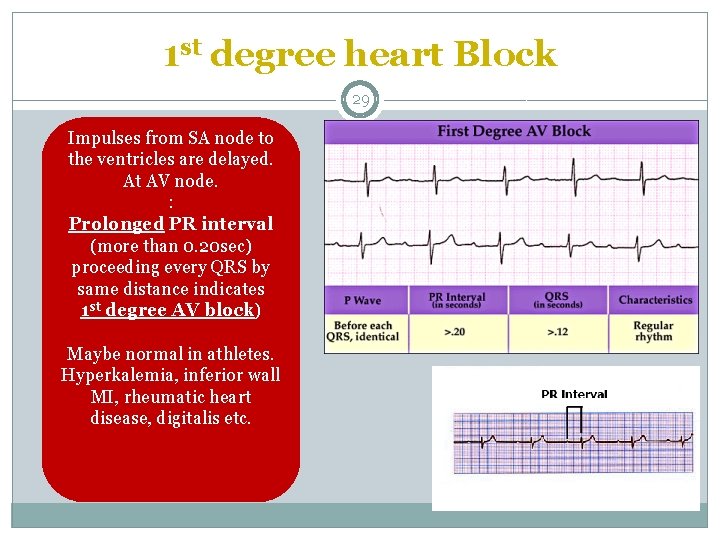
1 st degree heart Block 29 Impulses from SA node to the ventricles are delayed. At AV node. : Prolonged PR interval (more than 0. 20 sec) proceeding every QRS by same distance indicates 1 st degree AV block) Maybe normal in athletes. Hyperkalemia, inferior wall MI, rheumatic heart disease, digitalis etc.
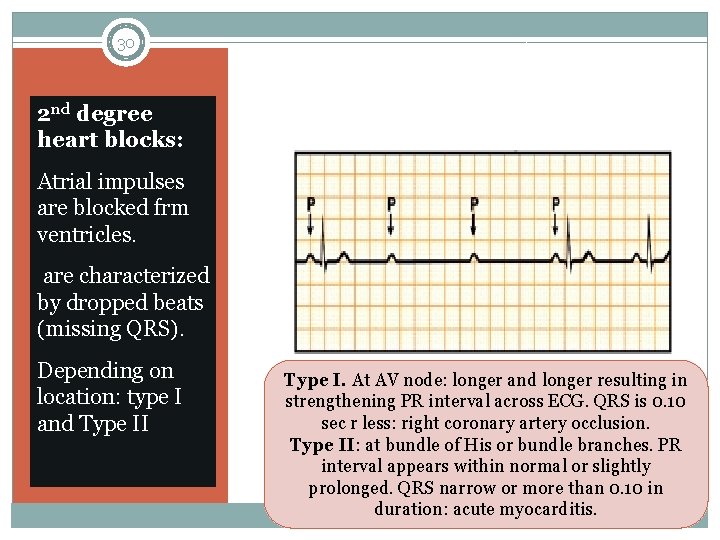
30 2 nd degree heart blocks: Atrial impulses are blocked frm ventricles. are characterized by dropped beats (missing QRS). Depending on location: type I and Type II Type I. At AV node: longer and longer resulting in strengthening PR interval across ECG. QRS is 0. 10 sec r less: right coronary artery occlusion. Type II: at bundle of His or bundle branches. PR interval appears within normal or slightly prolonged. QRS narrow or more than 0. 10 in duration: acute myocarditis.
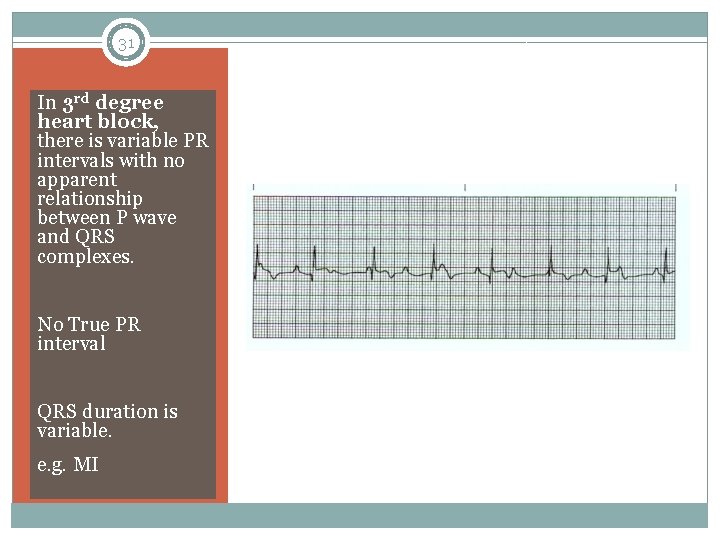
31 In 3 rd degree heart block, there is variable PR intervals with no apparent relationship between P wave and QRS complexes. No True PR interval QRS duration is variable. e. g. MI
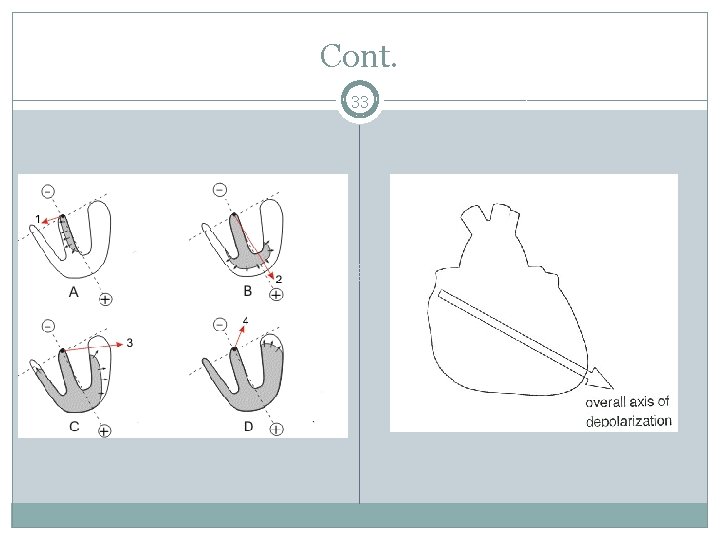
Cardiac Axis 32 �What is cardiac axis? The sum (average) of all the individual vectors occurring sequentially during depolarization of the ventricles. �It represents the net depolarization through the myocardium and is worked out using the limb leads, in particular leads I and III. The directions of each of these leads is called the cardiac vector �By convention, the direction of lead I is 0; and III points down.
Cont. 33
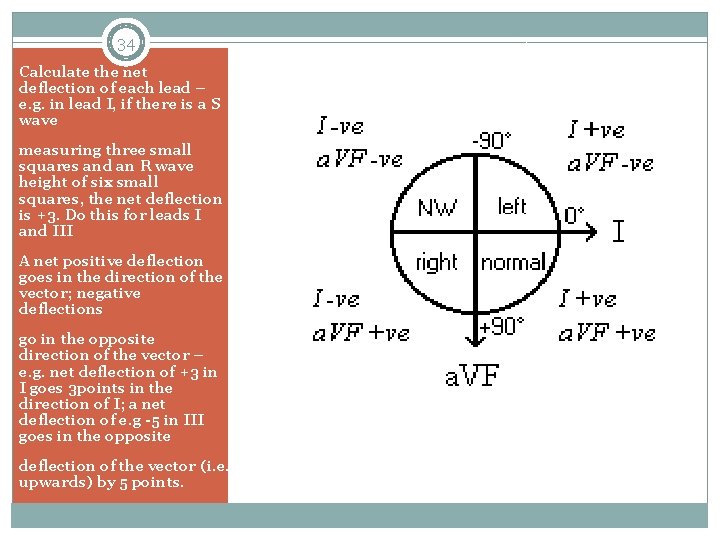
34 Calculate the net deflection of each lead – e. g. in lead I, if there is a S wave measuring three small squares and an R wave height of six small squares, the net deflection is +3. Do this for leads I and III A net positive deflection goes in the direction of the vector; negative deflections go in the opposite direction of the vector – e. g. net deflection of +3 in I goes 3 points in the direction of I; a net deflection of e. g -5 in III goes in the opposite deflection of the vector (i. e. upwards) by 5 points.
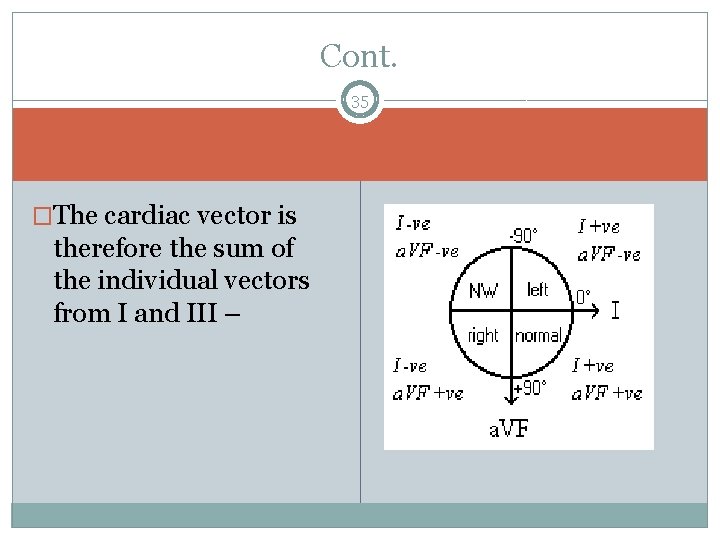
Cont. 35 �The cardiac vector is therefore the sum of the individual vectors from I and III –
Causes Of Abnormal Axis � Left Axis deviation: � Normal variation (physiologic, often with age) � Mechanical shifts, (pregnancy, ascites, abdominal tumor) � Left ventricular hypertrophy � Left bundle branch block � Congenital heart disease (e. g. atrial septal defect) � Emphysema � Hyperkalemia � Ventricular ectopic rhythms � Inferior myocardial infarction 36 � Right Axis Deviation: � Right ventricular hypertrophy � Right bundle branch block � Dextrocardia � Ventricular ectopic rhythms � Lateral wall myocardial infarction � Right ventricular load, for example Pulmonary Embolism or COPD
- Slides: 36