1 SEDIMENTATION IN THE RIVERS AND RESERVOIRS OF


- Slides: 26
1 SEDIMENTATION IN THE RIVERS AND RESERVOIRS OF THE MISSOURI RIVER BASIN 255 255 237 237 217 217 200 200 0 163 163 131 132 122 239 65 53 80 119 27 252 174. 59 110 135 120 112 92 56 62 102 130 Paul M. Boyd, Ph. D. , P. E. Hydraulic Engineer – River and Reservoir Engineering Section Omaha District – US Army Corps of Engineers “The views, opinions and findings contained in this report are those of the authors(s) and should not be construed as an official Department of the Army position, policy or decision, unless so designated by other official documentation. ” File Name 102 56 48 130 120 111
NORTHWESTERN DIVISION – OMAHA DISTRICT
FEDERAL AUTHORIZATIONS Authorized Purposes Recreation Irrigation Fish & Wildlife Water Quality Hydroelectric Power Navigation Flood Control Water Supply Authorizing Laws PL 78 -534 / PL 93 -205 PL 78 -534 PL 78 -534
SEDIMENT BALANCE – DISRUPTING THE PROCESS OF FLOOD AND DROUGHT
TYPICAL MAINSTEM DAM OPERATIONS Dams alter both flow and sediment Flow – Decreased peak flows (Flood Control) – Increased base flows (Water Supply, Navigation, Hydro Power) – Other purposes (Recreation, Water Supply, etc) Sediment – Aggradation / increased stage in headwaters – Degradation downstream of dams – Storage loss in reservoirs
OMAHA DISTRICT’S SEDIMENTATION PROGRAM • Comprehensive sediment monitoring program since 1950’s. • Includes collecting cross section data at 700+ established sediment ranges from below Gavins Point Dam, NE & SD through Fort Peck Lake, MT (1, 300 miles), aerial photographs, and Li. DAR data sets • Includes collecting river stage data, water surface profiles, bed & suspended sediment samples, density of deposits, core samples of the lake bed, and shore line erosion • Aggradation zone (reservoir) above dam associated with each project • Degradation zone below dam associated with each project (No degradation zone below Big Bend Dam) • Reports documenting the sedimentation process for each project
7/30 Paonia Reservoir, 1961
8/30 PAONIA RESERVOIR, OCTOBER 2014 Reservoir is 25% full of sediment Source: Collins and Kimbrel, 2015 http: //acwi. gov/sos/pubs/3 rd. JFIC/Contents/9 C-Collins. pdf
Downstream Sediment Load Change Missouri River at Omaha, NE
TYPICAL RESERVOIR POOL ZONE TERMINOLOGY
MISSOURI RIVER MAINSTEM RESERVOIRS RESERVOIR STORAGE CAPACITY LOSS Latest Reservoir Survey Original Reservoir Storage (AF) Total Storage Loss (AF) Annual Storage Loss (AF/YR) % Loss Expected Life (Years) Fort Peck Dam Fort Peck Lake 2007 19, 557, 000 1, 185, 000 17, 000 6. 1% 1, 100 Garrison Dam Lake Sakakawea 2012 24, 458, 000 1, 020, 000 17, 000 4. 2% 1, 400 Oahe Dam Lake Oahe 2010 23, 784, 000 813, 000 16, 000 3. 4% 1, 500 Big Bend Dam Lake Sharpe 2012 1, 980, 000 169, 000 3, 400 8. 5% 540 Fort Randall Dam Lake Francis Case 2011 6, 209, 000 915, 000 16, 000 14. 7% 340 Gavins Point Dam Lewis & Clark Lake 2012 575, 000 149, 000 2, 700 25. 9% 160 Dam/Reservoir
MISSOURI RIVER MAINSTEM RESERVOIRS CHANGES IN RESERVOIR STORAGE CAPACITY
13 RESERVOIR DESIGN • How was sediment addressed in the design? • Storage in ‘permanent’ or ‘dead’ or ‘sediment’ pool • No infrastructure to manage sediment – low level gates • How was sediment yield from the water shed determined? • Estimated from gage measurements and watershed studies • How close are current rates to design rates? File Name
ESTIMATED VS. MEASURED RESERVOIR SEDIMENTATION 120, 000 100, 000 80, 000 60, 000 40, 000 20, 000 FP - Fort Peck Lake GA - Lake Sakakawea OA - Lake Oahe BB - Lake Sharpe Estimated FR - Lake Francis Case Measured Sediment deposited above reservoir pool not included File Name GP - Lewis & Clark Lake Total
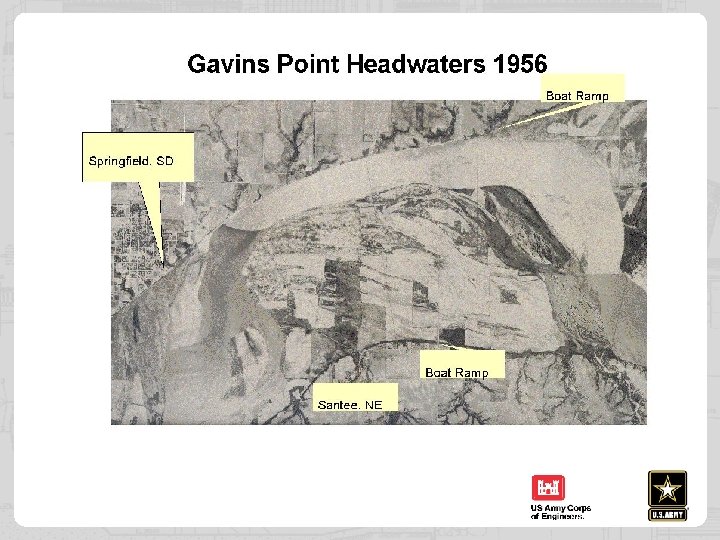
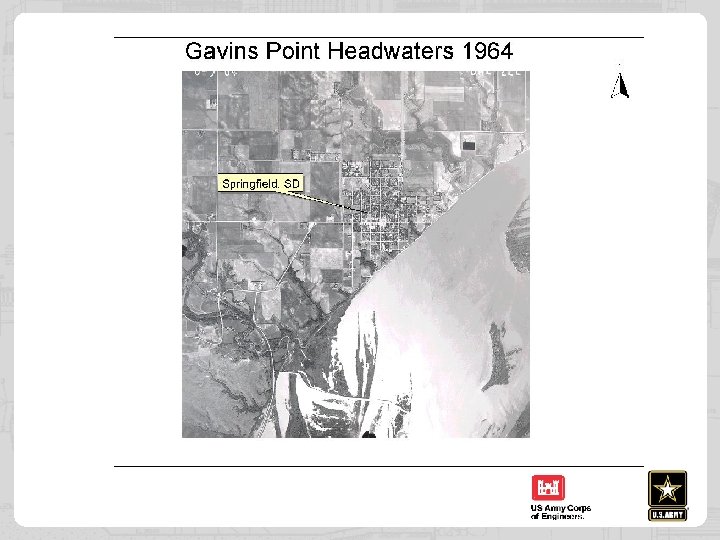
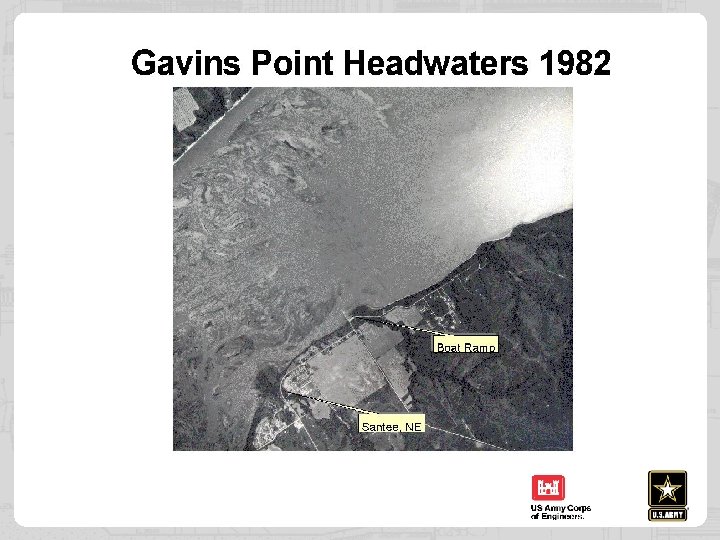
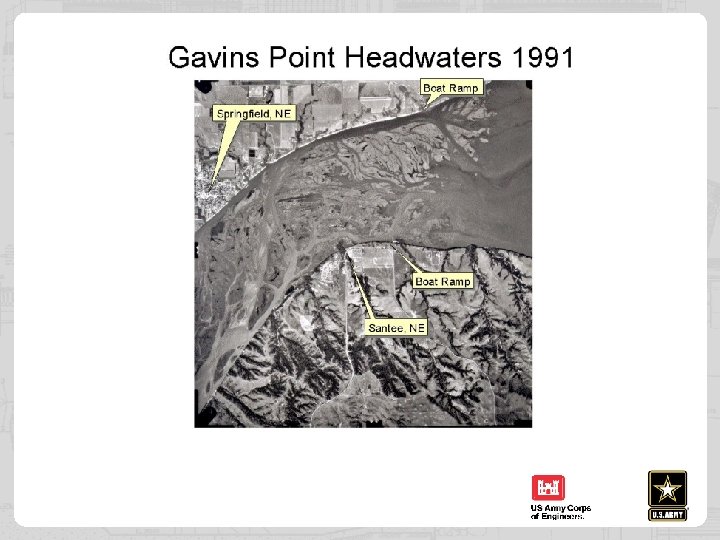
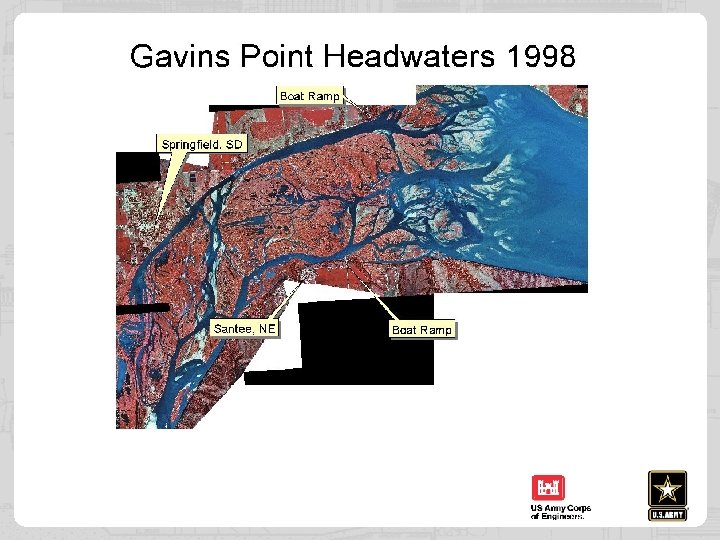
20 GAVINS POINT HEADWATERS 2016
HISTORICAL GAVINS POINT DELTA
22 MAGNITUDE OF SEDIMENTATION
AGGRADATION ZONE STAGE TRENDS
24 THE COST OF RESERVOIR SEDIMENT MANAGEMENT • Cost of management must be compared to the value of benefits lost due to sedimentation • Watershed solutions have fixed costs – land management, retention ponds, terracing • Solutions that keep sediment moving may have no direct costs but cost of lost benefits and downstream impacts – sluicing, bypass, flushing • Direct removal by dredging/excavation have fixed costs: Example: 4 million CY of sediment deposited in Gavins Point annually. Long distance dredging will no disposal costs is $10 -20/CY (from Great lakes and coastal projects) File Name
IMPACTS TO HYDROPOWER GENERATION In-Reservoir Sedimentation • Minimal current and near future impact to generation (50 yr horizon) • The long term impacts are continually being addressed through studies • Long term prediction of impacts have high uncertainty Downstream Channel Degradation • Drop in tailwater elevation can result in increased total head, increasing the maximum possible generation • Risk of cavitation in turbines increases with lower tailwater elevation (turbines designed for specific tailwater elevation) • Upgrades will mitigate some impacts
SEDIMENT AND HYDROPOWER At a 1000 MW power station, Pelton needle valves under 800 meters of head. (A) 10, 000 hours normal operations. (B) less than 24 hours passing sand. (Source: Morris, 2016) 26/30