1 PASSPORT RESEARCH FROM EUROMONITOR INTERNATIONAL NEW POSSIBILITIES

1 PASSPORT RESEARCH FROM EUROMONITOR INTERNATIONAL: NEW POSSIBILITIES GOTOVSKI VALERJAN 2013 © Euromonitor International

PASSPORT ПЛАН ПРЕЗЕНТАЦИИ 1 Euromonitor International Ведущий в мире издатель международной бизнес-информации 2 New Possibilites: Centre for analytics, modelling and innovation (CAMI) 3 Passport City 4 Research Monitor © Euromonitor International 2
 OBJECTIVES 5 Involving academic community Interdisciplinary approach,")
CENTRE FOR ANALYTICS, MODELLING AND INNOVATION (CAMI) OBJECTIVES 5 Involving academic community Interdisciplinary approach, crosspollination of ideas Cutting edge methodologies technologies and innovation Deep scientific knowledge to instil robustness to business decisions in the complex world Where science meets business: complex ideas made simple for every day business use Economics Machine learning © Euromonitor International
 TEAM COMPETENCES APPLIED TO RESEARCH TOPICS Economic")
CENTRE FOR ANALYTICS, MODELLING AND INNOVATION (CAMI) TEAM COMPETENCES APPLIED TO RESEARCH TOPICS Economic modelling Forecasting Econometrics and statistics Data mining and visualisation Scenario planning and futurology Consumer demand drivers Macro economics Global trends Value chains and global trade Wealth distribution System. Dynamics Machinelearning © Euromonitor International Urban economics 6
 CAMI: WHAT IS THE CONTENT? Interactive Models")
CENTRE FOR ANALYTICS, MODELLING AND INNOVATION (CAMI) CAMI: WHAT IS THE CONTENT? Interactive Models Data-driven dashboards and user-generated scenarios, allowing exploration of complex data relationships and for more effective opportunity identification. Insightful. Analysis In-depth macro-economics articles and cross-industry trends analysis, based on economic science and intended to provide new perspectives and challenge conventional wisdom. © Euromonitor International 7
 CAMI: HOW IS THIS DIFFERENT FROM CURRENT")
CENTRE FOR ANALYTICS, MODELLING AND INNOVATION (CAMI) CAMI: HOW IS THIS DIFFERENT FROM CURRENT CONTENT? § CAMI is unique among Euromonitor research offerings with an emphasis on the application of quantitative methods and scientific methods to existing data. § CAMI filters and analyses the more than 115 million available Euromonitor data points to find patterns and generate new insights, often via proprietary models created by our experienced team of econometricians. § CAMI is not an additional industry or additional data. C&C: C&C provides qualitative insights and analysis of key economic topics and events © Euromonitor International CAMI: CAMI uses models and theoretical frameworks to produce new insights and analyse multiple scenarios 8

CAMI PASSPORT PAGE INTERACTIVE MODELS Global macro modelfor 58 countries: • play future scenarios; • measure international spillovers If real estate bubble bursts in China, how other countries will be affected? Commodity price model for 38 commodities: play scenarios; check if Metal prices are going to fall? © Euromonitor International 9

10 § Why cities are interesting? §More than 50% of world’s population today lives in cities; §A lot of customers of our clients live in cities; §Cities are economic engines of their countries; §A lot of business activities of our clients take place in cities; © Euromonitor International

11 § How could Cities data be used – Moscow How many luxury vehicles could we sell in Moscow in 2017? § 25% households with annual disposable income above 250 000 USD in Russia live in Moscow; § There will be 121 000 such households in Moscow by 2017; § There are 0. 79 passenger cars per household in Moscow, compared to 0. 65 average in Russia; § Average household in Moscow spends around 4000 USD on transport, © Euromonitor International almost twice the average of Russia; This is comparable to the expenditure level of Berlin.

PASSPORT: CITIES SYSTEM OVERVIEW §Pan-city analysis § Datagraphics § Dashboard § Visual apps © Euromonitor International 12

PASSPORT: CITIES SYSTEM OVERVIEW §Cities coverage – 850 cities § 120 Tier 1 cities: • 270 indicators data in the database • Historic data 2005 -2011 • • § Forecasts for selected indicators until 2020 120 City reviews for each city 730 Tier 2 cities: • 170 indicators in the database • Historic data 2005 -2011 • Forecasts until 2020 © Euromonitor International 13
 Economic Income and Expenditure Infrastructure GDP")
14 § Indicators for Tier 1 (120 cities) Economic Income and Expenditure Infrastructure GDP Annual disposable income of households Total land area Real GDP growth Average disposable income per household Air pollution concentration GVA by main industry breakdown Households by income band Passengers in public transport GDP deflator Consumer expenditure National highways CPI inflation Consumer expenditure by groups of goods and services Traffic accidents CPI by main commodity group Gini coefficient Vehicles registered by type Export Airline passengers Labour force Demographic Total employed population Total population Employed population by industry Unemployed population Population by sex and broad age groups (0 -14, 15 -64, 65+) Hotels Population by educational attainment Hotel occupancy rate Unemployment rate Births Productivity Deaths Average wage Net migration Business establishments by industry Foreign population Households Average household size © Euromonitor International Population density Land area per capita Tourism International and domestic tourists
 Demographic Income bands Population In current,")
15 § Indicators for Tier 2 (730 cities) Demographic Income bands Population In current, constant and PPP terms: Over US$500 Households Over US$750 Income Over US$1, 000 Households by annual disposable income band Over US$1, 750 Households (% of Total) by Annual Disposable Income Band Over US$2, 500 Average Household Annual Disposable Income by Decile Over US$5, 000 % of Household Annual Disposable Income by Decile Over US$7, 500 Disposable Income of a Decile 1 Household as a percentage of Decile 5 Over US$10, 000 Disposable Income of a Decile 1 Household as a percentage of Decile 10 Over US$15, 000 Over US$25, 000 Over US$35, 000 Over US$45, 000 Over US$55, 000 Over US$65, 000 Over US$75, 000 Over US$100, 000 Over US$125, 000 Over US$150, 000 Over US$200, 000 Over US$250, 000 © Euromonitor International Over US$300, 000
 are the most important cities (capital cities,")
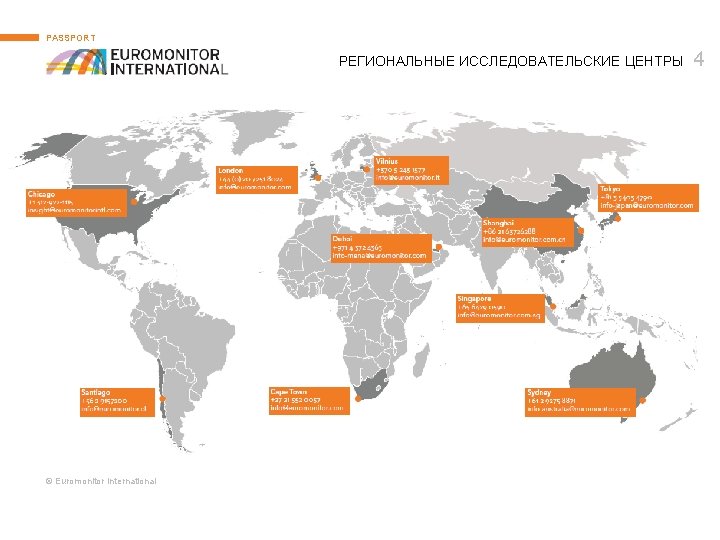
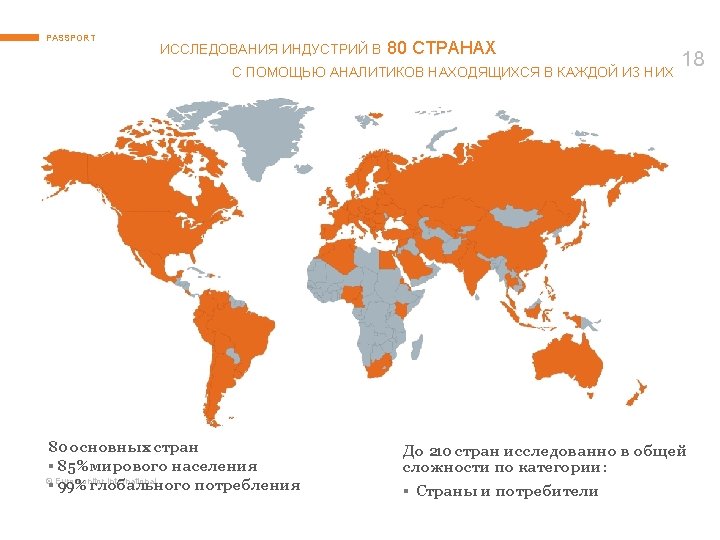
§ Geographic coverage Tier 1 cities (120) are the most important cities (capital cities, economic and political centers) in each of 80 world’s major countries. Tier 2 cities (730) are further largest cities in each of 80 world’s major countries in terms of population. © Euromonitor International 16

17 © Euromonitor International

PASSPORT 2. © Euromonitor International METHODOLOGY 19

DATA SOURCES, DEFINITIONS, METHODOLOGIES §Data sources: challenges © Euromonitor International 20

DATA SOURCES, DEFINITIONS, METHODOLOGIES § Methodologies: example © Euromonitor International 21

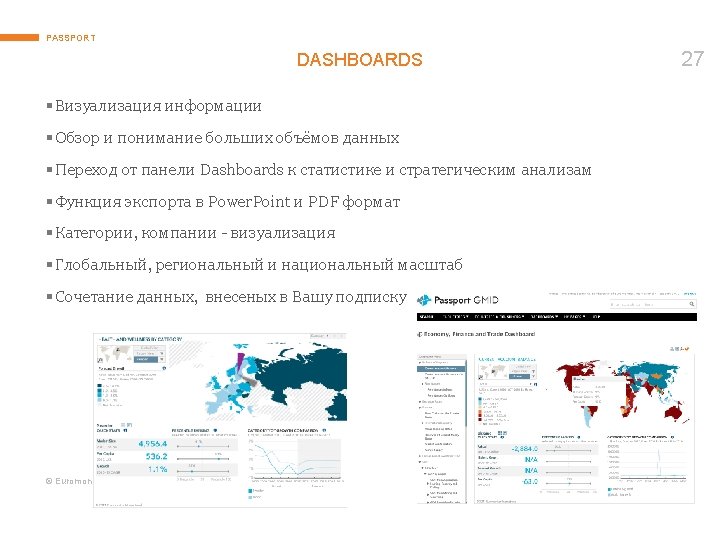
PASSPORT В КАКОЙ ФОРМЕ ВЫ ПОЛУЧАЕТЕ ИНФОРМАЦИЮ. . . Statistics Global Reports/Briefin gs City Briefings Country Reports/Briefin gs 22 Company Profiles Dashboards © Euromonitor International + links to real time news sites

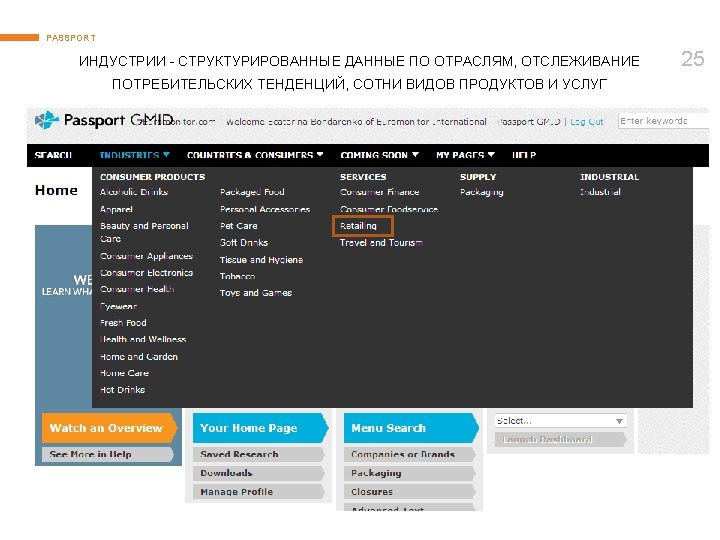
PASSPORT ДОМАШНЯЯ СТРАНИЧКА СИСТЕМЫ ИНФОРМАЦИИ PASSPORT © Euromonitor International 24

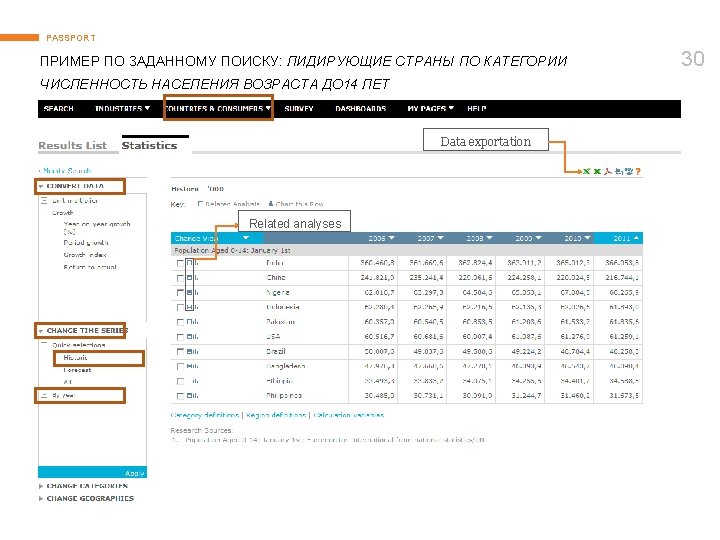
PASSPORT VISUALS: ПРОСЛЕЖИВАНИЕ РАЗВИТИЯ ПРОДУКТОВОЙ РОЗНИЧНОЙ ТОРГОВЛИ В РОССИИ Data exportation Analyses & Statistics © Euromonitor International 28

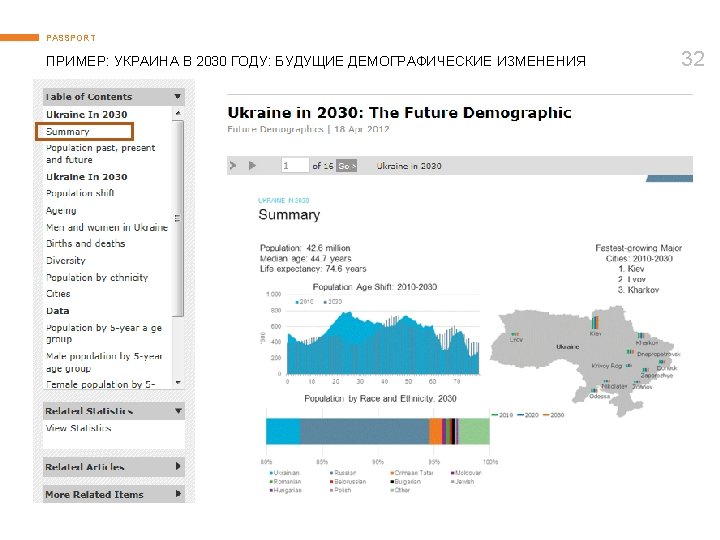
PASSPORT VISUALS: POPULATION AND HOMES: СРЕДНИЙ ВОЗРАСТ МУЖСКОГО НАСЕЛЕНИЯ © Euromonitor International 31

PASSPORT 33 © Euromonitor International

EUROMONITOR INTERNATIONAL SPLIT SCREEN © Euromonitor International 37

PASSPORT HOW TO START? • Contact KONEK • Click on the link to access Passport http: //www. portal. euromonitor. com • Video tutorial about Passport © Euromonitor International (click Help and Help Videos) 42

PASSPORT КОНТАКТНЫЕ ДАННЫЕ: Valerjan Gotovski Regional Manager Euromonitor International - Eastern Europe E-mail: valerjan. gotovski@euromonitor. lt Tel: +370 5 243 1577 ext: 4580 Fax: +370 5 243 1599 www. euromonitor. com Passportaccess: http: //www. portal. euromonitor. com/portal/server. pt Спасибо за внимание! © Euromonitor International 43
- Slides: 43