1 Medical Nutrition Therapy MNT in Diabetes Golaleh

1
 in Diabetes Golaleh Asghari, Ph. D Nutrition and Endocrine Research")
Medical Nutrition Therapy (MNT) in Diabetes Golaleh Asghari, Ph. D Nutrition and Endocrine Research Center Research Institute for Endocrine Sciences Shahid Beheshti University of Medical Sciences 2
 – Optimal MNT – Weight management")
Content – Effectiveness of medical nutrition therapy (MNT) – Optimal MNT – Weight management – Macronutrient recommendation – Carbohydrate – Case studies 3

Effectiveness of MNT in T 2 DM Top 10 Take-Home Messages for the Primary Prevention of Cardiovascular Disease All adults should consume a healthy diet: – Emphasizes vegetables, fruits, nuts, whole grains, lean vegetable or animal protein, and fish – Minimizes trans fats, processed meats, refined carbohydrates, and sweetened beverages. Arnett DK. Circulation 2019 4
 5")
Effectiveness of MNT in T 2 DM (cont’) 5
 For adults with type 2 diabetes")
Effectiveness of MNT in T 2 DM (cont’) For adults with type 2 diabetes mellitus, lifestyle changes, such as improving dietary habits and achieving exercise recommendations, are crucial. Arnett DK. Circulation 2019 6
 7")
Effectiveness of MNT in T 2 DM (cont’) 7
 Diabetes self-management education and support (DSMES):")
Effectiveness of MNT in T 2 DM (cont’) Diabetes self-management education and support (DSMES): – Medical nutrition therapy (MNT) – Physical activity – Smoking cessation counseling – Psychosocial care Diabetes Care 2019; 41(Suppl. 1): S 38–S 50 8

All individuals who have prediabetes or diabetes should be offered a referral for individualized MNT, preferably provided by a registered dietitian who is knowledgeable and skilled in providing diabetes-specific MNT (A) Diabetes Care 2019; 41(Suppl. 1): S 38–S 55 9
 MNT: v. A simple and effective")
Effectiveness of MNT in T 2 DM (cont’) MNT: v. A simple and effective approach to glycemia and weight management emphasizing portion control and healthy food choices (B) v. Results in cost savings (B) and improved outcomes (e. g. , A 1 C reduction) (A) Diabetes Care 2019; 41(Suppl. 1): S 38–S 55 10
 J Acad Nutr Diet 2017; 117(10):")
Effectiveness of MNT in T 2 DM (cont’) J Acad Nutr Diet 2017; 117(10): 1659 -1679. 11
 12")
Effectiveness of MNT in T 2 DM (cont’) 12

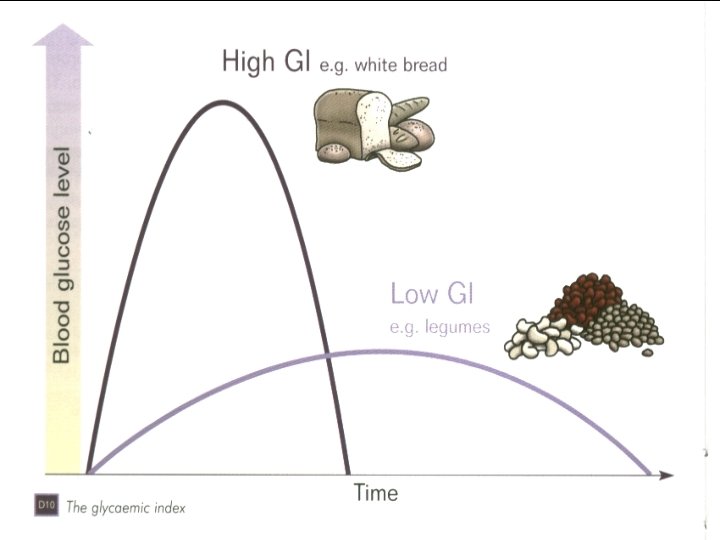
Optimal MNT • Eating patterns: – Low carbohydrate – Low fat – Low GI (glycemic index) – Mediterranean (more vegetables, whole grains, fruit, legumes, nuts, fish, low-fat dairy, olive, and MUFA/PUFA; less red meat and SFAs) – Vegetarian JD Krebs. British J Diab Vasc Dis 2013; 13(2): 60 -66 Salas-Salvadó J. Nutr Metab Cardiovasc Dis 2011; 21(Suppl 2): B 32 -48. Wheeler ML. Diabetes Care 2012; 35(2): 434 -45. 13

Optimal MNT • The evidence supports flexibility in dietary composition with no approach superior to another for weight loss, glycaemic control or cardiovascular risk management. • There is evidence that adherence to any given dietary approach is more important than the macronutrient prescription. • So the best diet for those with type 2 diabetes is the one that works for them, and critically the one that they can maintain in the long term JD Krebs. British J Diab Vasc Dis 2013; 13(2): 60 -66 Salas-Salvadó J. Nutr Metab Cardiovasc Dis 2011; 21(Suppl 2): B 32 -48. Wheeler ML. Diabetes Care 2012; 35(2): 434 -45. 14

Optimal MNT • Together with the maintenance of desirable body weight – Prudent diet (higher intake plant-based foods, and a lower intake of red meat, meat products, sweets, highfat dairy and refined grains) – Mediterranean dietary pattern – Dietary Approaches to Stop Hypertension (DASH) • appears as the best strategy, especially if dietary recommendations take into account individual preferences, thus enabling long-time adherence JD Krebs. British J Diab Vasc Dis 2013; 13(2): 60 -66 Salas-Salvadó J. Nutr Metab Cardiovasc Dis 2011; 21(Suppl 2): B 32 -48. Wheeler ML. Diabetes Care 2012; 35(2): 434 -45. 15

Optimal MNT • Carbohydrates (by limiting them to what fits in onequarter of the plate) • An emphasis on low-carbohydrate (or non-starchy) vegetables Diabetes Care 2018; 41(Suppl. 1): S 38–S 55 J Am Diet Assoc 1998; 98: 1155– 1158. 16
 among individuals with overweight/obesity")
Weight management Clinically meaningful weight loss (≥ 5% initial weight) among individuals with overweight/obesity is associated with moderate improvement in: § Glucose levels § Blood pressure § low-density lipoprotein cholesterol § Triglyceride Arnett DK. Circulation 2019 17
 comprehensive weight loss interventions provided")
Weight management High-intensity (≥ 14 sessions in 6 months) comprehensive weight loss interventions provided by a trained interventionist work best Arnett DK. Circulation 2019 18

Weight management To reverse T 2 DM into a non-diabetic state: requires intentional weight losses >15 kg – Metabolic effect is consistent – Remission for 70– 80% of people with T 2 DM – Without requiring the extreme weight losses targeted by bariatric surgery – It is associated with extended survival Lean MEJ. Nat Rev Endocrinol 2019; 15(5): 251 -252. 19

Macronutrient recommendation Energy intake = carbohydrate + protein + fat Macronutrient Distribution range Carbohydrate Protein Fat 20

Macronutrient recommendation • No universal dietary strategy to prevent diabetes or delay its onset. – For people with diabetes, it is unlikely one optimal mix of macronutrients for meal plans exists – The best mix of carbohydrate, protein, and fat appears to vary depending on individual circumstances Diabetes Care 2019; 41(Suppl. 1): S 38–S 55 JD Krebs. British J Diab Vasc Dis 2013; 13(2): 60 -66 Salas-Salvadó J. Nutr Metab Cardiovasc Dis 2011; 21(Suppl 2): B 32 -48. Wheeler ML. Diabetes Care 2012; 35(2): 434 -45. 21

Macronutrient recommendation Ø No ideal percentage of calories from carbohydrate, protein, or fat for individuals with diabetes Ø Macronutrient distribution to be based on individualized assessment of ü Current eating patterns ü Preferences ü Metabolic goals Diabetes Care 2019; 41(Suppl. 1): S 38–S 55 JD Krebs. British J Diab Vasc Dis 2013; 13(2): 60 -66 Salas-Salvadó J. Nutr Metab Cardiovasc Dis 2011; 21(Suppl 2): B 32 -48. Wheeler ML. Diabetes Care 2012; 35(2): 434 -45. 22
![Properties of Macronutrients Dietary interventions A 1 C Advantages Disadvantages Hi-CHO (low-glycemic index [GI])](http://slidetodoc.com/presentation_image_h2/a7d6345c629dad990d998ee99e533b1d/image-23.jpg "Properties of Macronutrients Dietary interventions A 1 C Advantages Disadvantages Hi-CHO (low-glycemic index [GI])")
Properties of Macronutrients Dietary interventions A 1 C Advantages Disadvantages Hi-CHO (low-glycemic index [GI]) 0. 3– 0. 5% HDL-C, CRP, hypoglycemia - Hi-CHO (high fiber) 0. 3– 0. 5% TC, LDL-C HDL-C, GI side effects Hi-MUFA <0. 3% TG - Lo-CHO TG Micronutrients, renal load Hi-protein BP, TG, preserve lean mass Micronutrients, renal load Long chain omega 3 fatty acids TG Methyl-Hg exposure, environmental impact Can J Diab 2009; 32 (Suppl 1) 23
 showing no")
Macronutrient recommendation • Most randomized controlled trials (6 out of 7 studies) showing no difference between a high-protein diet (around 30% of total energy) and control. • Many randomized controlled trials were limited by low compliance and high dropout rates >15%. Malaeb S, et al. Adv Nutr. 2019; 10(4): 621 -633. 24
: 1659 -1679. 25")
Macronutrient recommendation J Acad Nutr Diet 2017; 117(10): 1659 -1679. 25

Macronutrient recommendation American Diabetes Association 2014 Use of individualized assessment; evidence suggests no one ideal distribution for all people Canadian Diabetes Association 2013 Individualization within ranges of 50– 60% carbohydrate, 15– 20% protein, 20– 35% fat of total energy Diabetes and Nutrition Study Group of the European Association for the Study of Diabetes 2004 Ranges of 45– 60% carbohydrate, 10– 20% protein, ≤ 35% fat of energy Lancet 2014; 383(9933): 1999 -2007. 26

Macronutrient recommendation BDA ADA EASD CDA NCEP 50– 55 50– 60 45– 60 50– 60 _ Not recommended for general use Recommended _ Fiber 30 g/d No specific amount Increase with low-GI foods 25– 35 g/d 20 -30 g/d Protein (%) 10– 15 15 -20 10 -20 15 Fat (%) 30– 35 25 -35 <35 20 -35 25 -35 Carbohydrate (%) GI Am J Clin Nutr 2013; 97: 505– 16
 ü Simple sugars ü Fiber ü Glycemic index")
Carbohydrate ü Carbohydrate counting (total amount) ü Simple sugars ü Fiber ü Glycemic index ü Glycemic load ü Carbohydrate distribution 28
: 1659 -1679. 29")
Carbohydrate J Acad Nutr Diet 2017; 117(10): 1659 -1679. 29

Carbohydrate Ø Monitoring total grams of carbohydrate by use of exchange system or carbohydrate counting is a key strategy and is essential all persons with type 1 and 2 DM Ø Carbohydrate counting allows flexibility in food choices, helps promote glycemic control and match food intake to insulin doses. Ø Carbohydrate counting uses a grouping method to place foods in categories of similar carbohydrate equivalency. Ø Carbohydrate counting estimates intake either by total grams of carbohydrate or by one serving, which is considered 15 g. Modern nutrition in health and disease. 2014, P: 819 Diabetes Care 2014; 37 (Suppl 1): S 120 -43 30
 The Exchange Lists Groups/ Lists Carbohydrate Protein Fat Calories Starch 15 3")
Carbohydrate (cont’) The Exchange Lists Groups/ Lists Carbohydrate Protein Fat Calories Starch 15 3 1 or less 80 Fruit 15 ___ 60 Milk Skim Low-fat Whole 12 12 12 8 8 8 0 -3 5 8 90 120 150 Other carbohydrates 15 varies Vegetables 5 2 ___ 25 ___ ___ 7 7 0 -1 3 5 8 35 55 75 100 ___ 5 45 Carbohydrate Group Meat and Substitute Group Very lean Lean Medium-fat High-fat Fat Group 31

Carbohydrate Foods that Contain Carbohydrates One Carbohydrate Choice Bread, cereals, pasta, and grains 1 slice of bread Rice, beans, and starchy vegetables: potatoes, corn, peas Fruit and fruit juices Milk and yogurt Sugars foods: regular soda, fruit drinks, jelly beans Sweets: cake, cookies, chocolate candy 15 grams of carbohydrate ½ cup pasta 1 small potato ½ cup legumes ½ cup cereal 1 fruit 1 cup yogurt 1 cup milk 32

Carbohydrate Simple sugars: ● Dietary sucrose does not increase glycemia more than isocaloric amounts of starch (bread, rice or potato) ● Sucrose and sucrose-containing foods does not need to be restricted; even though can be substituted for other carbohydrate in meal plan ● Simple sugars can be added up to 10% of total calories ● Fructose from fruits, vegetables, and other naturally rich fructose foods is not limited ● Added fructose as a sweetening agent is not recommended because it may adversely affect plasma lipid and metabolic syndrome Modern Nutrition in Health and Disease 2014; P: 53 33

Carbohydrate Because of the specific benefits of increased fiber intake for persons with diabetes, intake of 14 g/1000 kcal (25 g/d for women and 38 g/d for men) fiber is recommended Diabetes Care 2015; 38(Suppl. 1): S 20–S 30 Modern Nutrition in Health and Disease 2014; P: 1480 -9 34

35

Carbohydrate 36
: The increase above fasting in the blood glucose")
Carbohydrate Definition of Glycemic index (GI): The increase above fasting in the blood glucose area over 2 h after ingestion of a constant amount of specific food ÷ the response to a reference food (glucose or white bread) International table of glycemic index and glycemic load values 2002. Am J Clin Nutr 2002; 76: 5 -56 37

Carbohydrate • Low GI is < 55 : – • Moderate GI is 55 -70 : – • oats, barley, bulgur, beans, lentils, legumes, fructose, noodles , … tortilla chips High GI is > 70 : – refined starches, popcorn, In diabetes, GI diet vs. GI improved glycemic control International table of glycemic index and glycemic load values 2002. Am J Clin Nutr 2002; 76: 5 -56 38
: 1659 -1679. 40")
Carbohydrate J Acad Nutr Diet 2017; 117(10): 1659 -1679. 40

Carbohydrate Ø Dietary constituents that tend to Øfiber, Øfructose, ØLactose ØFat glycemic response 41
 of a food: GI of the food × amounts of")
Carbohydrate Glycemic load (GL) of a food: GI of the food × amounts of grams of CHO content of that food Both the amount (grams) and type of a carbohydrate are important International table of glycemic index and glycemic load values 2002. Am J Clin Nutr 2002; 76: 5 -56 42

Obesity Research Center 43

Carbohydrate v Recommended range of CHO is: 45 -60% of total calories v Low CHO diets are not recommended (<130 g/d ) § Unrefined carbohydrates such as whole grains, fruits, vegetables, and legumes vs. refined starchy foods produce: ü A lower glycemic index ü Greater satiety ü Cholesterol-lowering properties Diabetes Care 2015; 38(Suppl. 1): S 20–S 30 Modern Nutrition in Health and Disease 2014; P: 1480 -9 44
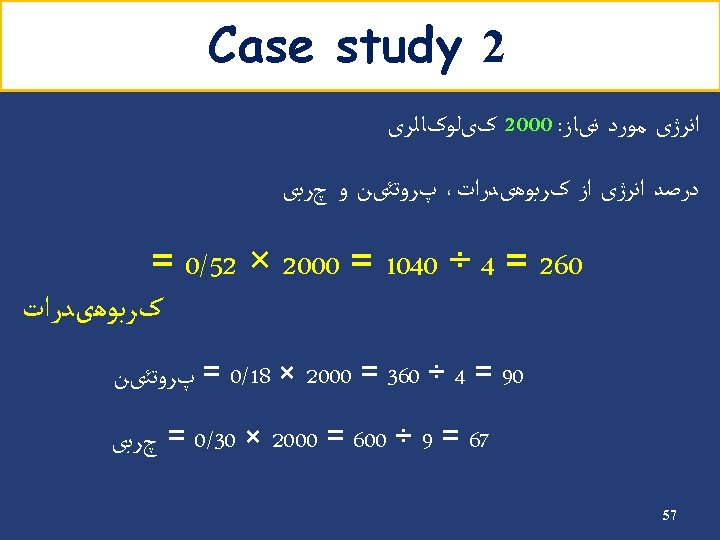
 • Energy requirement: 2000 kcal/d • Carbohydrate requirement: 1100 → 275")
Example Carbohydrate (cont’) • Energy requirement: 2000 kcal/d • Carbohydrate requirement: 1100 → 275 g/d kcal/d (55%) • Carbohydrate counts: 275 ÷ 15 = 18 Carbohydrate Group Exchange Starch 9 Fruit 4 Low fat milk 2 Other carbohydrates 2 Vegetables 5 45
 Insulin Breakfast % 15 Count 3 S 1 12. 5 2 Lunch")
Carbohydrate (cont’) Insulin Breakfast % 15 Count 3 S 1 12. 5 2 Lunch 22. 5 4 S 2 12. 5 2 Dinner 22. 5 4 S 3 15 3 Oral agents Breakfast % 15 Count 3 S 1 12. 5 2 Lunch 25 4. 5 S 2 12. 5 2 Dinner 25 4. 5 S 3 10 2 46

MNT in GDM • Primary goal of MNT is to achieve normal blood glucose levels while promoting adequate weight gain and nutritional status without ketosis 47
: 22. 48")
Moreno-Castilla C, et al. Curr Diab Rep 2016; 16(4): 22. 48

MNT in GDM • Excessive maternal gestational weight gain during dietary treatment → ↑ Hb. A 1 C from diagnosis of GDM to late pregnancy and ↑ infant birth weight-SD score • Restricted maternal gestational weight gain during dietary treatment → ↓ Hb. A 1 C and a close-to-normal infant birth weight-SD score, without an increased prevalence of SGA Kurtzhals et al, Diabetologia 2018; 61(12): 2528 -2538. 49

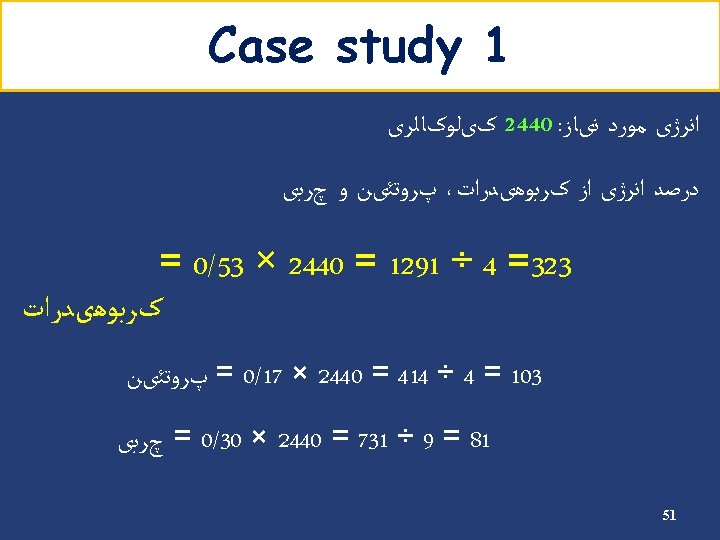
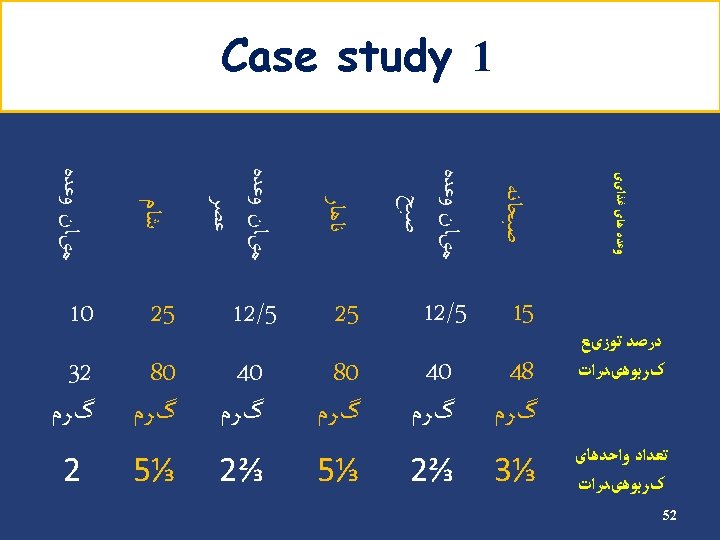
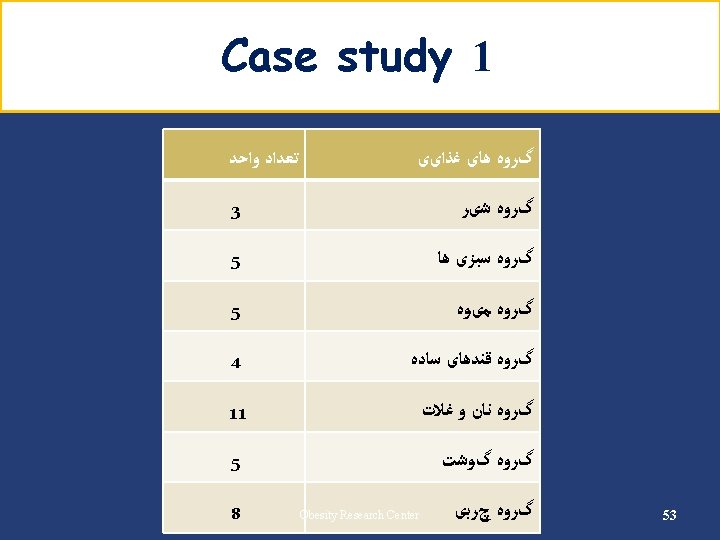
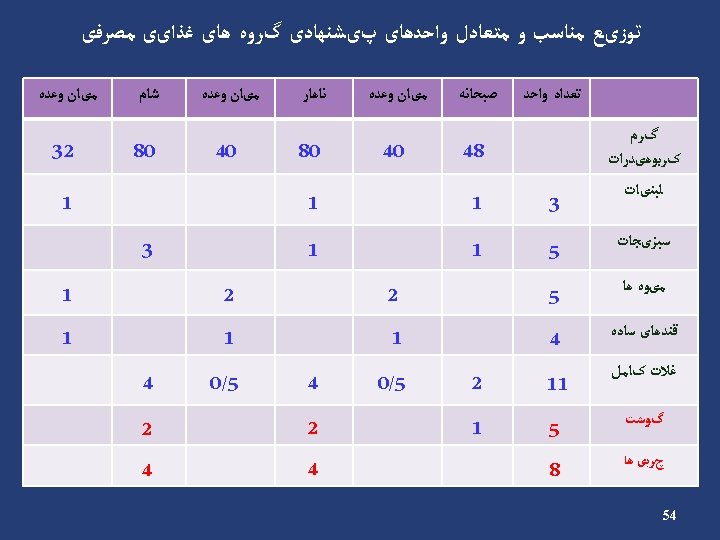
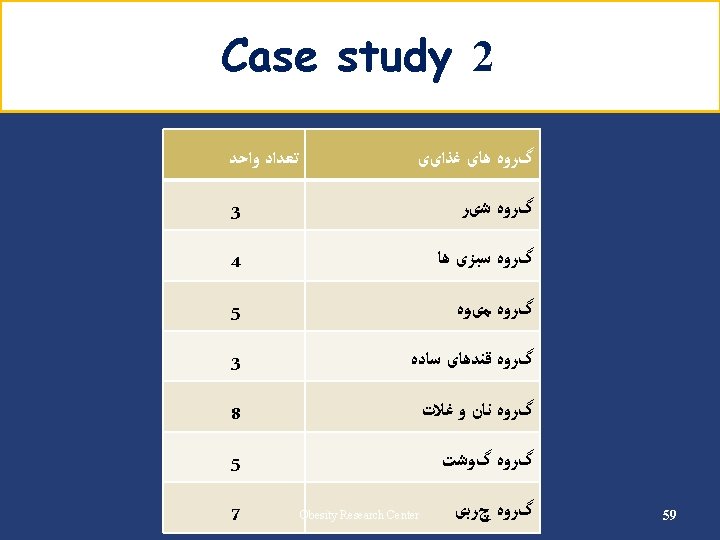
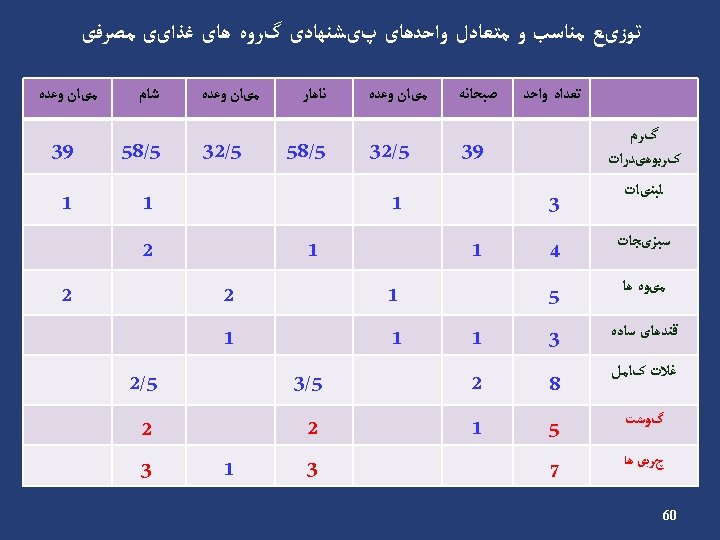
Case studies 50


Any question? 63
- Slides: 63