
1 Lecture13 CE312 Engineering Geology and Seismology Instructor





- Slides: 29
1
Lecture#13 CE-312 Engineering Geology and Seismology Instructor: Dr Amjad Naseer Department of Civil Engineering N-W. F. P University of Engineering and Technology, Peshawar 2
Outlines of the Presentation • Earthquake Intensity and Magnitude • Different Intensity and Magnitude Scale 3
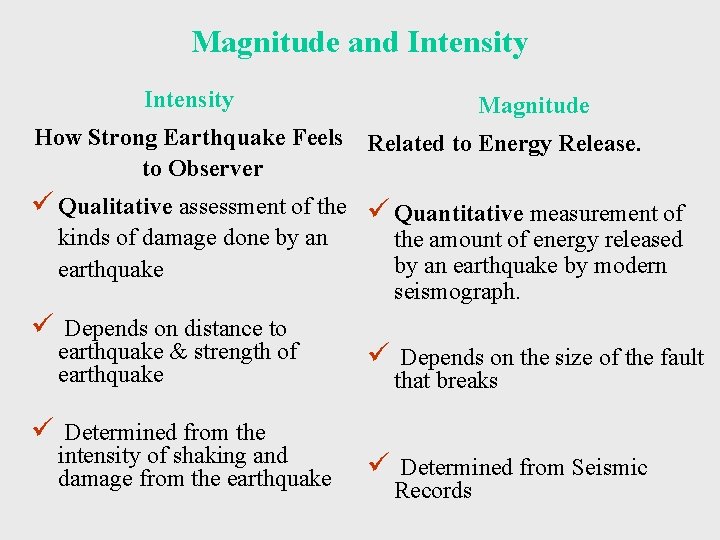
Magnitude and Intensity Magnitude How Strong Earthquake Feels Related to Energy Release. to Observer ü Qualitative assessment of the ü Quantitative measurement of kinds of damage done by an earthquake ü Depends on distance to earthquake & strength of earthquake the amount of energy released by an earthquake by modern seismograph. ü Depends on the size of the fault that breaks ü Determined from the intensity of shaking and damage from the earthquake ü Determined from Seismic Records
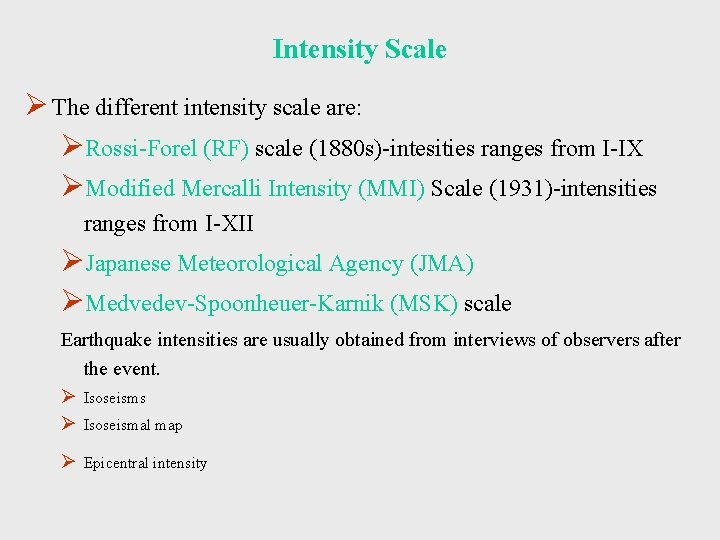
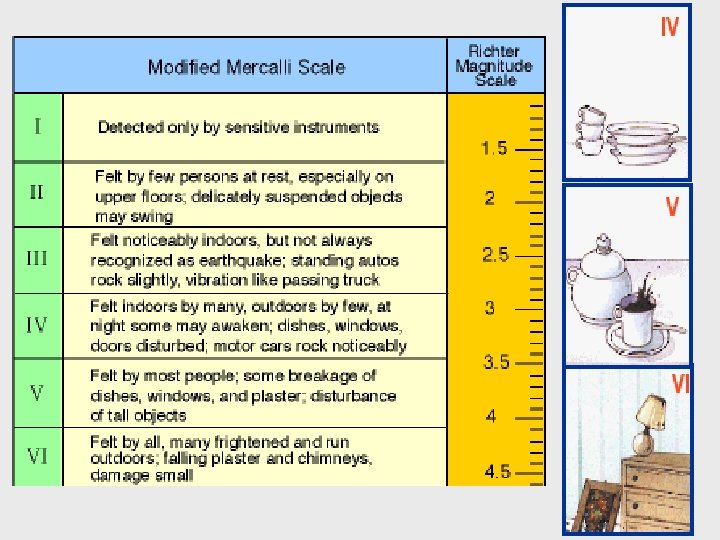
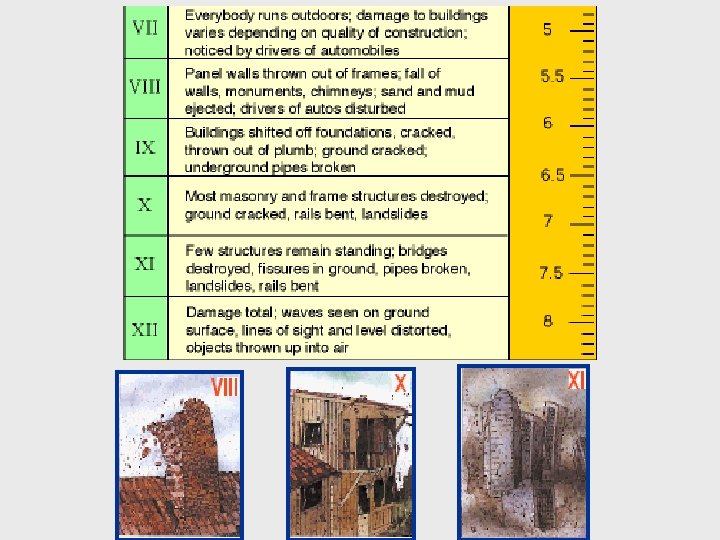
Intensity Scale Ø The different intensity scale are: ØRossi-Forel (RF) scale (1880 s)-intesities ranges from I-IX ØModified Mercalli Intensity (MMI) Scale (1931)-intensities ranges from I-XII ØJapanese Meteorological Agency (JMA) ØMedvedev-Spoonheuer-Karnik (MSK) scale Earthquake intensities are usually obtained from interviews of observers after the event. Ø Isoseisms Ø Isoseismal map Ø Epicentral intensity
Intensity How Strong Earthquake Feels to Observer Depends on: üDistance to Epicenter üGeology üType of Building üObserver! üVaries from Place to Place
Earthquake Magnitude 1. ML - Local (Richter) magnitude 2. MS - Surface wave magnitude 3. MB- Body wave magnitude 4. MW - Seismic Moment magnitude
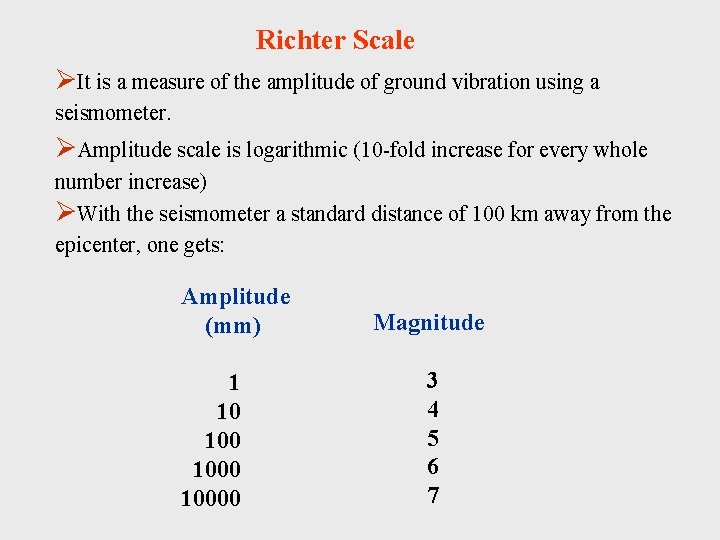
Richter Scale ØIt is a measure of the amplitude of ground vibration using a seismometer. ØAmplitude scale is logarithmic (10 -fold increase for every whole number increase) ØWith the seismometer a standard distance of 100 km away from the epicenter, one gets: Amplitude (mm) 1 10 10000 Magnitude 3 4 5 6 7
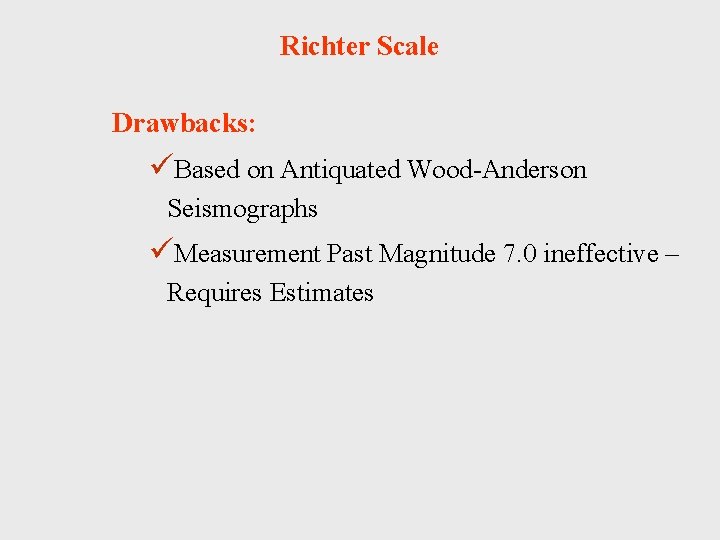
Richter Scale Drawbacks: üBased on Antiquated Wood-Anderson Seismographs üMeasurement Past Magnitude 7. 0 ineffective – Requires Estimates
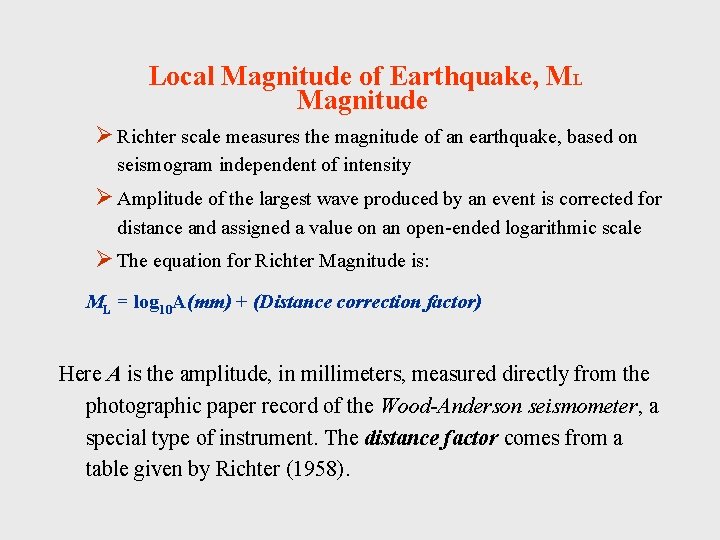
Local Magnitude of Earthquake, ML Magnitude Ø Richter scale measures the magnitude of an earthquake, based on seismogram independent of intensity Ø Amplitude of the largest wave produced by an event is corrected for distance and assigned a value on an open-ended logarithmic scale Ø The equation for Richter Magnitude is: ML = log 10 A(mm) + (Distance correction factor) Here A is the amplitude, in millimeters, measured directly from the photographic paper record of the Wood-Anderson seismometer, a special type of instrument. The distance factor comes from a table given by Richter (1958).
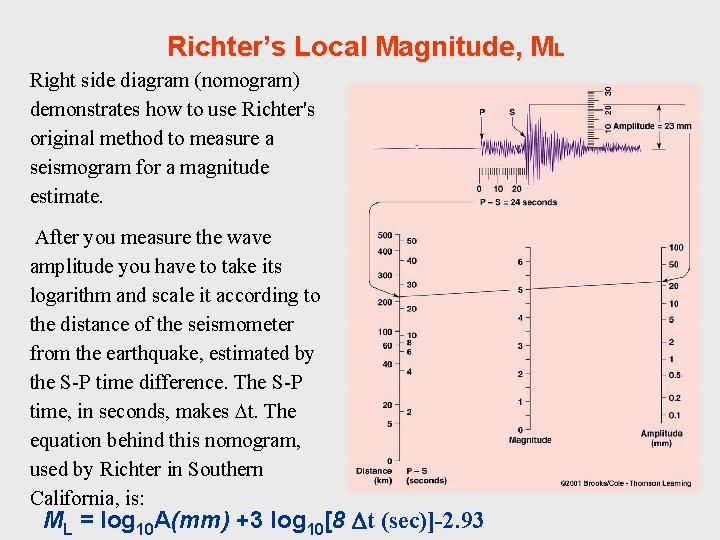
Richter’s Local Magnitude, ML Right side diagram (nomogram) demonstrates how to use Richter's original method to measure a seismogram for a magnitude estimate. After you measure the wave amplitude you have to take its logarithm and scale it according to the distance of the seismometer from the earthquake, estimated by the S-P time difference. The S-P time, in seconds, makes t. The equation behind this nomogram, used by Richter in Southern California, is: ML = log 10 A(mm) +3 log 10[8 t (sec)]-2. 93
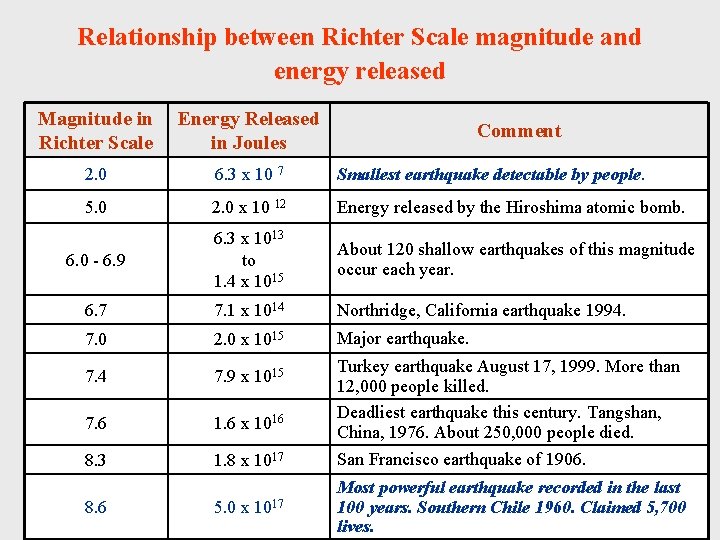
Relationship between Richter Scale magnitude and energy released Magnitude in Richter Scale Energy Released in Joules 2. 0 6. 3 x 10 7 Smallest earthquake detectable by people. 5. 0 2. 0 x 10 12 Energy released by the Hiroshima atomic bomb. 6. 0 - 6. 9 6. 3 x 10¹³ to 1. 4 x 10¹⁵ About 120 shallow earthquakes of this magnitude occur each year. 6. 7 7. 1 x 10¹⁴ Northridge, California earthquake 1994. 7. 0 2. 0 x 1015 Major earthquake. 7. 4 7. 9 x 10¹⁵ 7. 6 1. 6 x 10¹⁶ 8. 3 1. 8 x 10¹⁷ San Francisco earthquake of 1906. 8. 6 5. 0 x 1017 Most powerful earthquake recorded in the last 100 years. Southern Chile 1960. Claimed 5, 700 lives. Comment Turkey earthquake August 17, 1999. More than 12, 000 people killed. Deadliest earthquake this century. Tangshan, China, 1976. About 250, 000 people died.
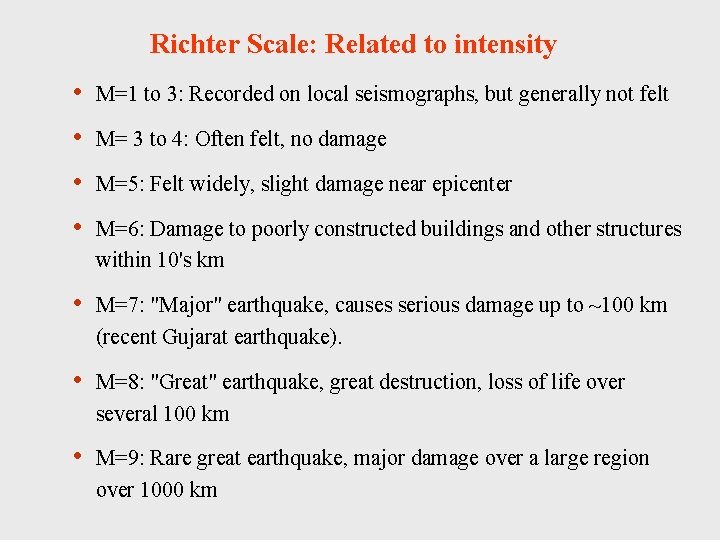
Richter Scale: Related to intensity • M=1 to 3: Recorded on local seismographs, but generally not felt • M= 3 to 4: Often felt, no damage • M=5: Felt widely, slight damage near epicenter • M=6: Damage to poorly constructed buildings and other structures within 10's km • M=7: "Major" earthquake, causes serious damage up to ~100 km (recent Gujarat earthquake). • M=8: "Great" earthquake, great destruction, loss of life over several 100 km • M=9: Rare great earthquake, major damage over a large region over 1000 km
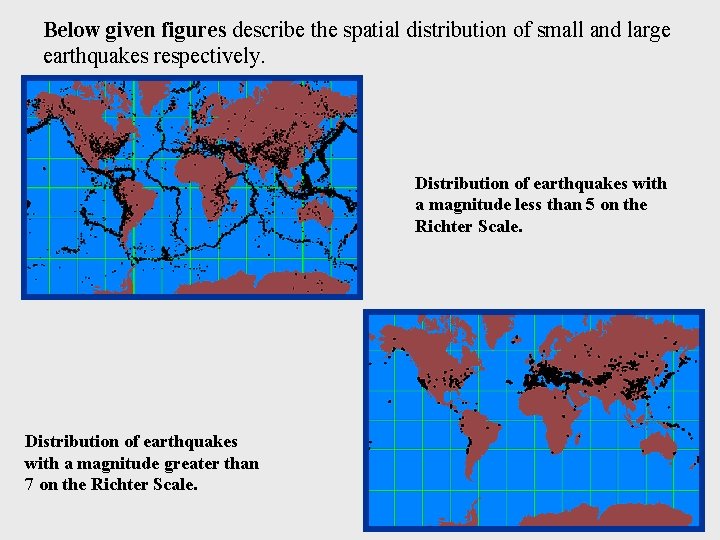
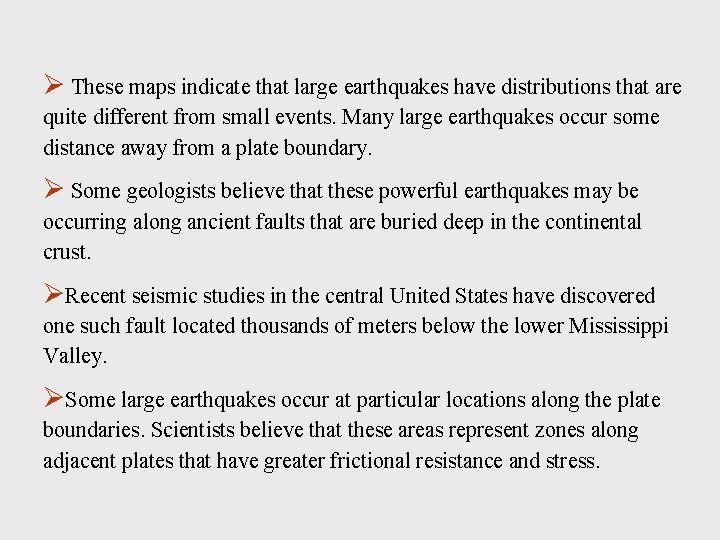
Below given figures describe the spatial distribution of small and large earthquakes respectively. Distribution of earthquakes with a magnitude less than 5 on the Richter Scale. Distribution of earthquakes with a magnitude greater than 7 on the Richter Scale.
Ø These maps indicate that large earthquakes have distributions that are quite different from small events. Many large earthquakes occur some distance away from a plate boundary. Ø Some geologists believe that these powerful earthquakes may be occurring along ancient faults that are buried deep in the continental crust. ØRecent seismic studies in the central United States have discovered one such fault located thousands of meters below the lower Mississippi Valley. ØSome large earthquakes occur at particular locations along the plate boundaries. Scientists believe that these areas represent zones along adjacent plates that have greater frictional resistance and stress.
Surface Wave Magnitude, MS ØRichter’s local magnitude does not distinguish between different types of waves. ØAt large distances from epicenter, ground motion is dominated by surface waves. ØGutenberg and Richter (1936) developed a magnitude scale based on the amplitude of Rayleigh waves. ØSurface wave magnitude Ms = log 10 A + 1. 66 log 10 +2 A = Maximum ground displacement in micrometers = Distance of seismograph from the epicenter, in degrees. ØSurface wave magnitude is used for shallow earthquakes
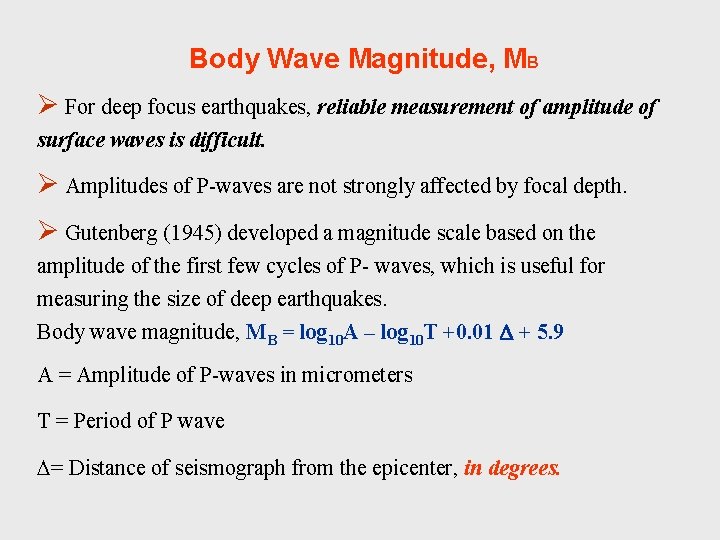
Body Wave Magnitude, MB Ø For deep focus earthquakes, reliable measurement of amplitude of surface waves is difficult. Ø Amplitudes of P-waves are not strongly affected by focal depth. Ø Gutenberg (1945) developed a magnitude scale based on the amplitude of the first few cycles of P- waves, which is useful for measuring the size of deep earthquakes. Body wave magnitude, MB = log 10 A – log 10 T +0. 01 + 5. 9 A = Amplitude of P-waves in micrometers T = Period of P wave = Distance of seismograph from the epicenter, in degrees.
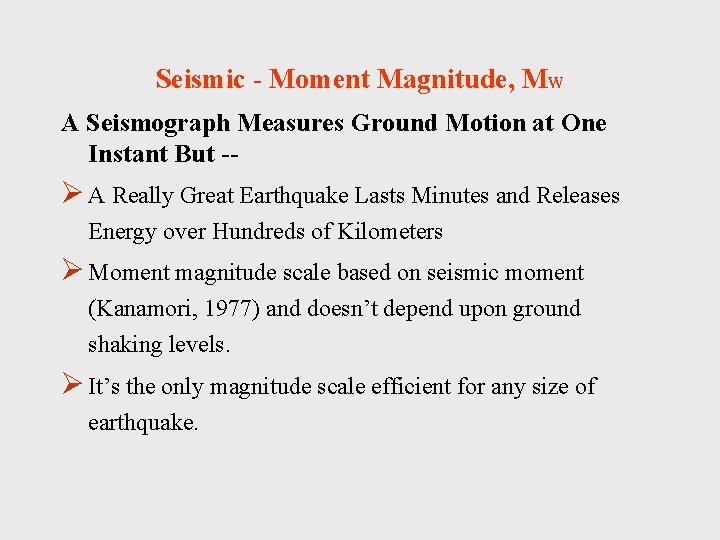
Seismic - Moment Magnitude, MW A Seismograph Measures Ground Motion at One Instant But -- Ø A Really Great Earthquake Lasts Minutes and Releases Energy over Hundreds of Kilometers Ø Moment magnitude scale based on seismic moment (Kanamori, 1977) and doesn’t depend upon ground shaking levels. Ø It’s the only magnitude scale efficient for any size of earthquake.
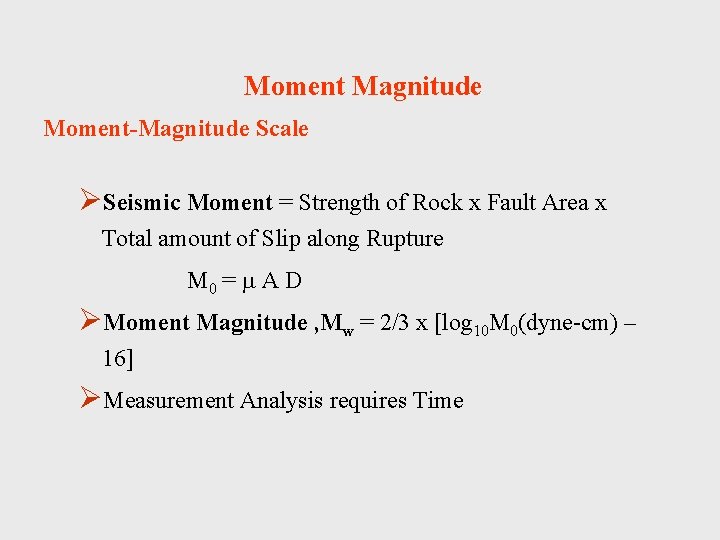
Moment Magnitude Moment-Magnitude Scale ØSeismic Moment = Strength of Rock x Fault Area x Total amount of Slip along Rupture M 0 = A D ØMoment Magnitude , Mw = 2/3 x [log 10 M 0(dyne-cm) – 16] ØMeasurement Analysis requires Time
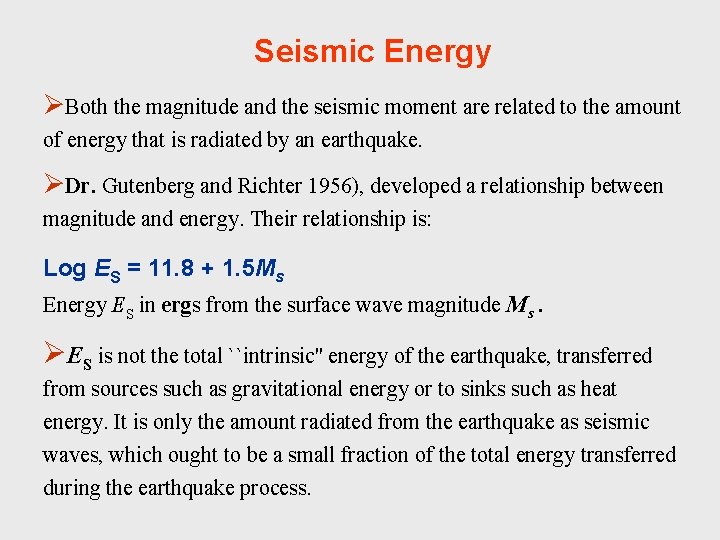
Seismic Energy ØBoth the magnitude and the seismic moment are related to the amount of energy that is radiated by an earthquake. ØDr. Gutenberg and Richter 1956), developed a relationship between magnitude and energy. Their relationship is: Log ES = 11. 8 + 1. 5 Ms Energy ES in ergs from the surface wave magnitude Ms. ØES is not the total ``intrinsic'' energy of the earthquake, transferred from sources such as gravitational energy or to sinks such as heat energy. It is only the amount radiated from the earthquake as seismic waves, which ought to be a small fraction of the total energy transferred during the earthquake process.
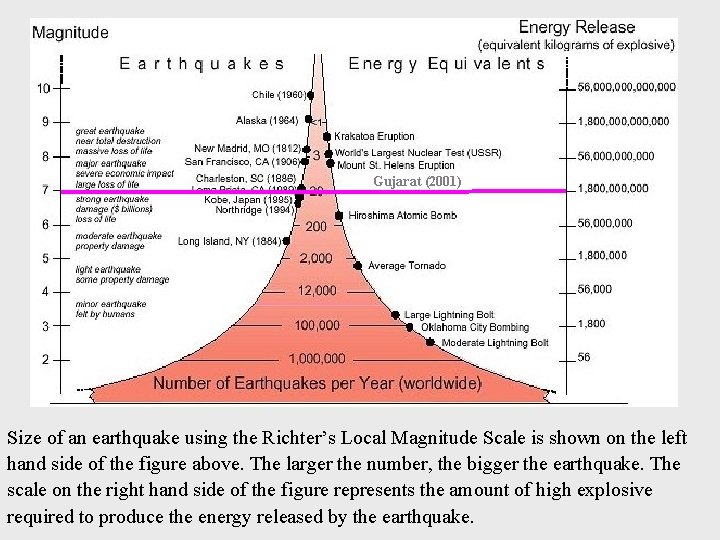
Local Magnitude - Seismic Energy correlation Gujarat (2001) Size of an earthquake using the Richter’s Local Magnitude Scale is shown on the left hand side of the figure above. The larger the number, the bigger the earthquake. The scale on the right hand side of the figure represents the amount of high explosive required to produce the energy released by the earthquake.
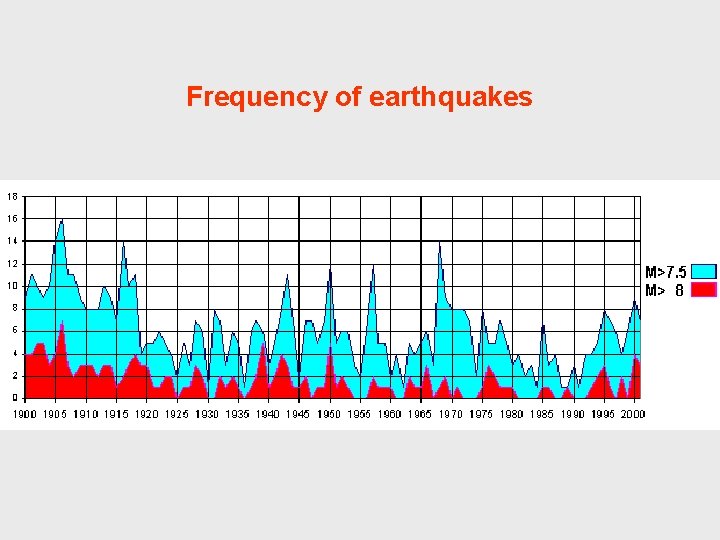
Frequency of earthquakes
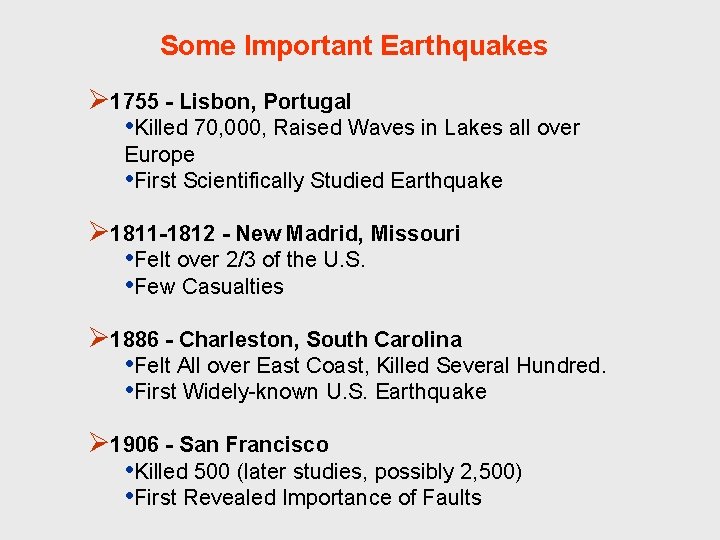
Some Important Earthquakes Ø 1755 - Lisbon, Portugal • Killed 70, 000, Raised Waves in Lakes all over Europe • First Scientifically Studied Earthquake Ø 1811 -1812 - New Madrid, Missouri • Felt over 2/3 of the U. S. • Few Casualties Ø 1886 - Charleston, South Carolina • Felt All over East Coast, Killed Several Hundred. • First Widely-known U. S. Earthquake Ø 1906 - San Francisco • Killed 500 (later studies, possibly 2, 500) • First Revealed Importance of Faults
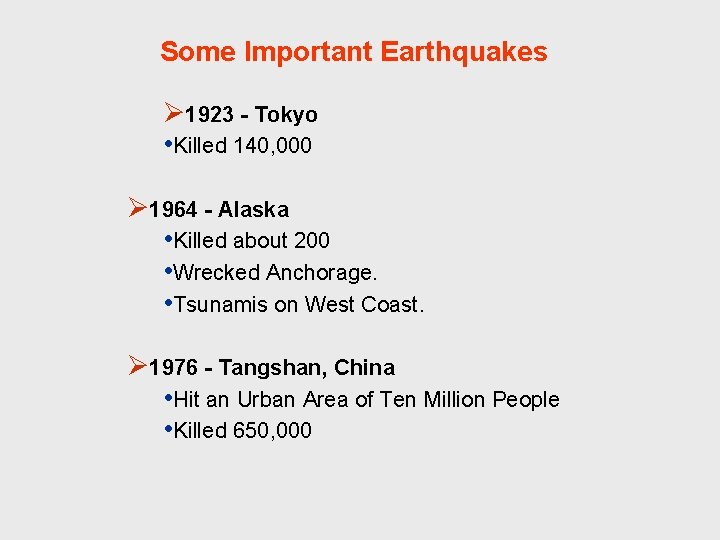
Some Important Earthquakes Ø 1923 - Tokyo • Killed 140, 000 Ø 1964 - Alaska • Killed about 200 • Wrecked Anchorage. • Tsunamis on West Coast. Ø 1976 - Tangshan, China • Hit an Urban Area of Ten Million People • Killed 650, 000
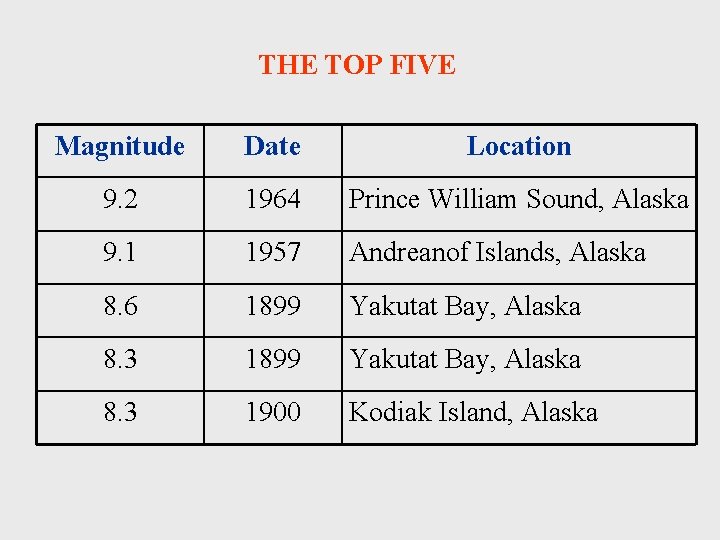
THE TOP FIVE Magnitude Date Location 9. 2 1964 Prince William Sound, Alaska 9. 1 1957 Andreanof Islands, Alaska 8. 6 1899 Yakutat Bay, Alaska 8. 3 1900 Kodiak Island, Alaska
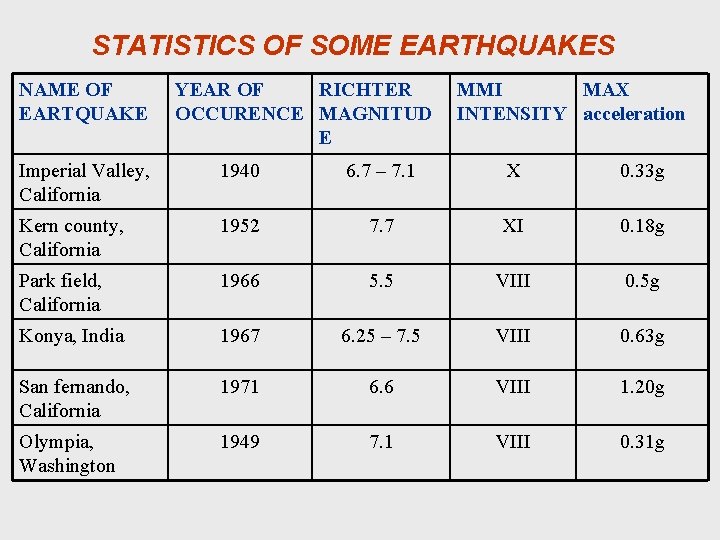
STATISTICS OF SOME EARTHQUAKES NAME OF EARTQUAKE YEAR OF RICHTER OCCURENCE MAGNITUD E MMI MAX INTENSITY acceleration Imperial Valley, California 1940 6. 7 – 7. 1 X 0. 33 g Kern county, California 1952 7. 7 XI 0. 18 g Park field, California 1966 5. 5 VIII 0. 5 g Konya, India 1967 6. 25 – 7. 5 VIII 0. 63 g San fernando, California 1971 6. 6 VIII 1. 20 g Olympia, Washington 1949 7. 1 VIII 0. 31 g
Seismogram is visual record of arrival time and magnitude of shaking associated with seismic wave. Analysis of seismogram allows measurement of size of earthquake. Mercalli Intensity scale Measured by the amount of damage caused in human terms- I (low) to XII (high); Drawback: inefficient in uninhabited area Richter Scale- (logarithmic scale) Magnitude- based on amplitude of the waves Related to earthquake total energy