
1 Harmonic Distortion versus Frequency in Amplifiers By

1 Harmonic Distortion versus Frequency in Amplifiers By Jorge Vega – Characterization Engineer & Raj Ramanathan – Design Engineer Precision Analog – Linear products – Op Amps
2 Agenda 1. Introductory comments 2. Measurement setup and THD+N a. Tool Blocks b. RMS calculation of THD+N 3. THD+N versus Frequency a. Noise Dominated Region b. THD Dominated Region c. Slew Rate Induced Distortion 4. Summary
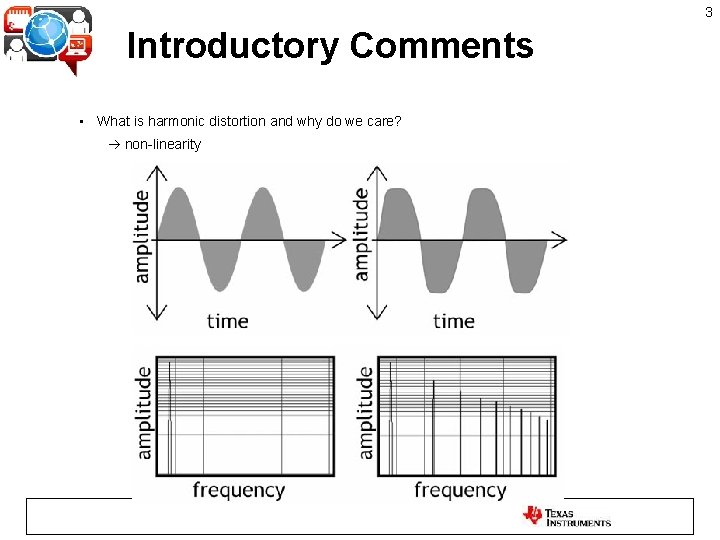
3 Introductory Comments • What is harmonic distortion and why do we care? non-linearity
4 Introductory Comments • What is harmonic distortion and why do we care? non-linearity • Types of distortion • Understanding how noise, input source resistance, open loop gain, closed loop gain, slew rate, loading all affect distortion • OPA 1652, OPA 1662 and OPA 1602 line of Sound Plus Audio Amplifiers. Very low distortion and noise amplifiers
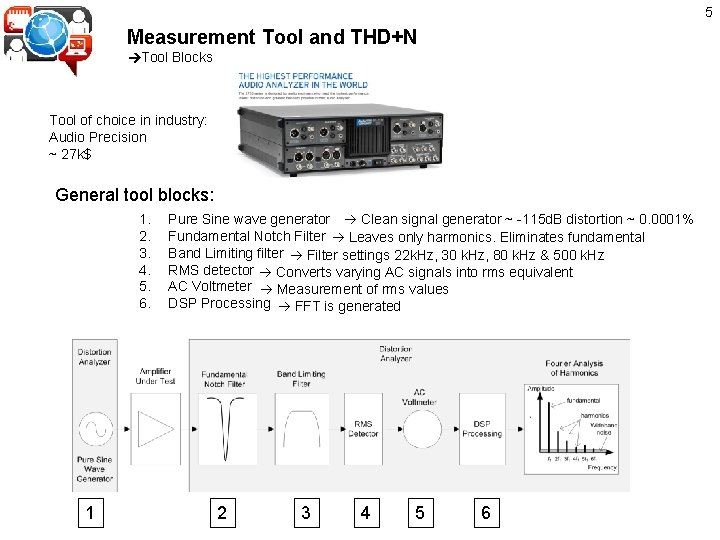
5 Measurement Tool and THD+N Tool Blocks Tool of choice in industry: Audio Precision ~ 27 k$ General tool blocks: 1. 2. 3. 4. 5. 6. 1 Pure Sine wave generator Clean signal generator ~ -115 d. B distortion ~ 0. 0001% Fundamental Notch Filter Leaves only harmonics. Eliminates fundamental Band Limiting filter Filter settings 22 k. Hz, 30 k. Hz, 80 k. Hz & 500 k. Hz RMS detector Converts varying AC signals into rms equivalent AC Voltmeter Measurement of rms values DSP Processing FFT is generated 2 3 4 5 6
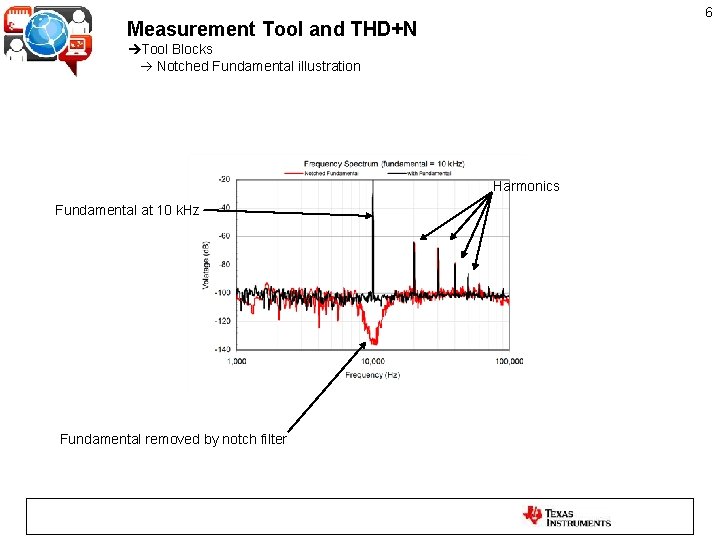
6 Measurement Tool and THD+N Tool Blocks Notched Fundamental illustration Harmonics Fundamental at 10 k. Hz Fundamental removed by notch filter
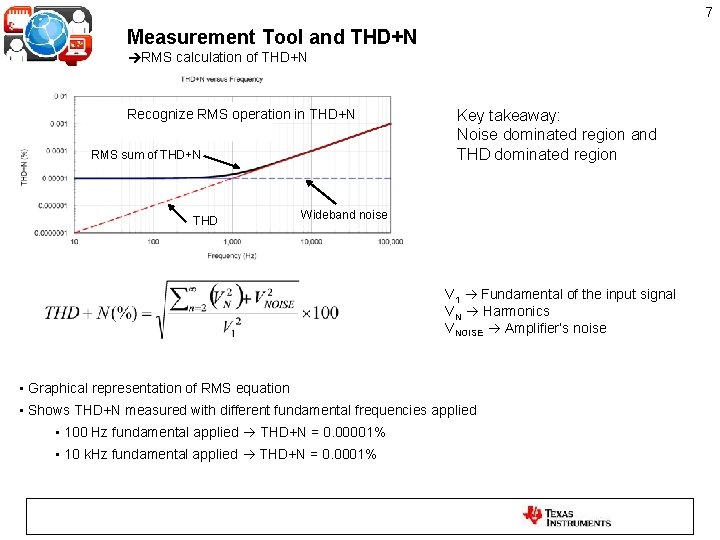
7 Measurement Tool and THD+N RMS calculation of THD+N Recognize RMS operation in THD+N RMS sum of THD+N THD Key takeaway: Noise dominated region and THD dominated region Wideband noise V 1 Fundamental of the input signal VN Harmonics VNOISE Amplifier’s noise • Graphical representation of RMS equation • Shows THD+N measured with different fundamental frequencies applied • 100 Hz fundamental applied THD+N = 0. 00001% • 10 k. Hz fundamental applied THD+N = 0. 0001%
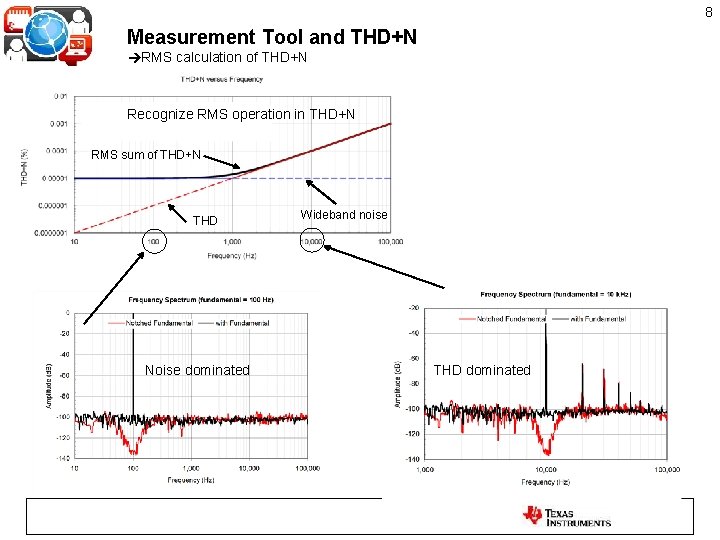
8 Measurement Tool and THD+N RMS calculation of THD+N Recognize RMS operation in THD+N RMS sum of THD+N THD Noise dominated Wideband noise THD dominated
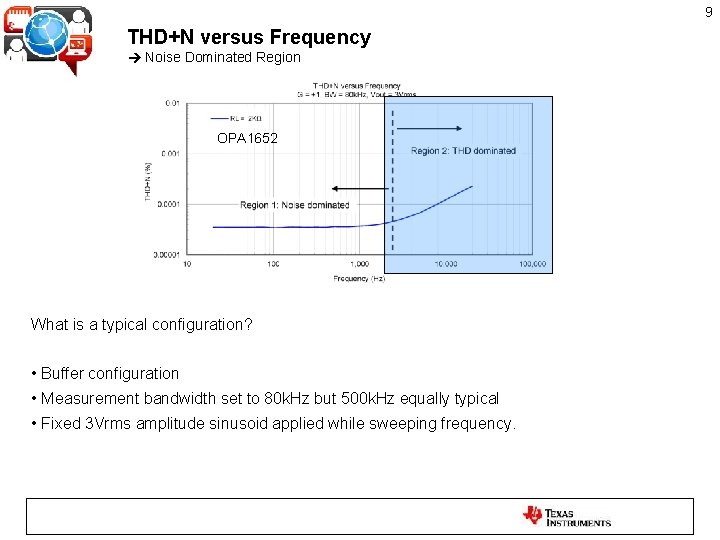
9 THD+N versus Frequency Noise Dominated Region OPA 1652 What is a typical configuration? • Buffer configuration • Measurement bandwidth set to 80 k. Hz but 500 k. Hz equally typical • Fixed 3 Vrms amplitude sinusoid applied while sweeping frequency.
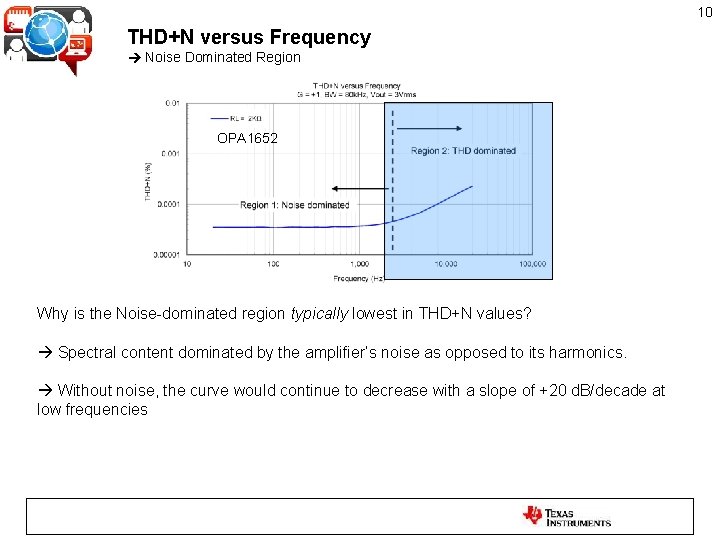
10 THD+N versus Frequency Noise Dominated Region OPA 1652 Why is the Noise-dominated region typically lowest in THD+N values? Spectral content dominated by the amplifier’s noise as opposed to its harmonics. Without noise, the curve would continue to decrease with a slope of +20 d. B/decade at low frequencies
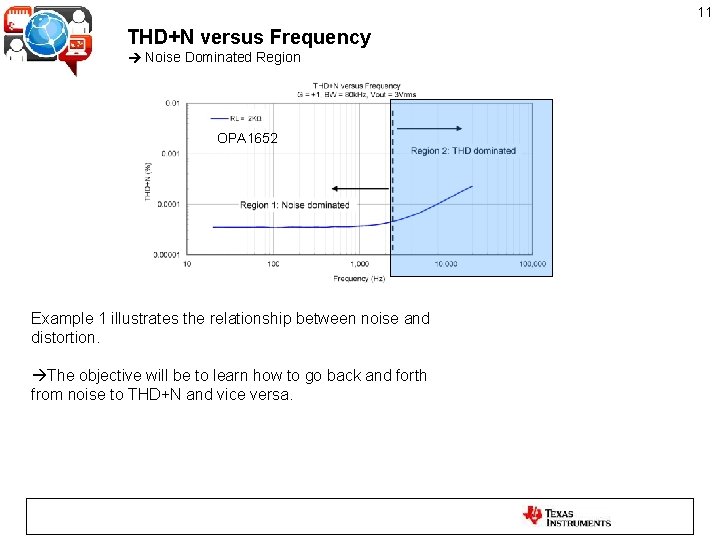
11 THD+N versus Frequency Noise Dominated Region OPA 1652 Example 1 illustrates the relationship between noise and distortion. The objective will be to learn how to go back and forth from noise to THD+N and vice versa.
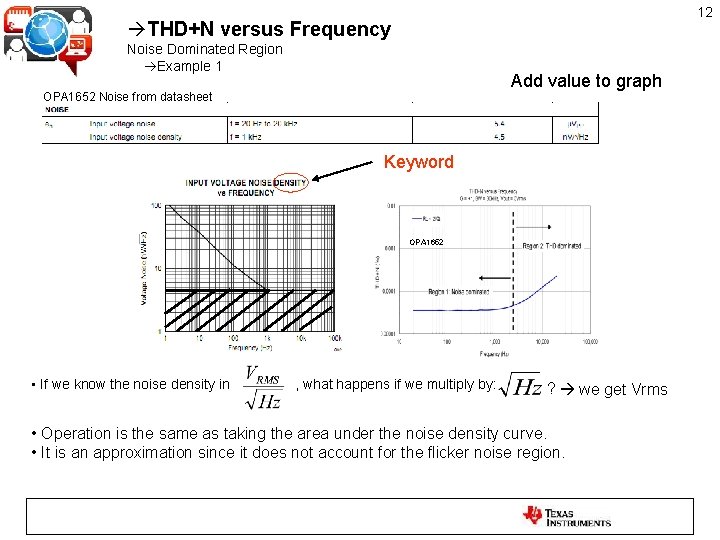
12 THD+N versus Frequency Noise Dominated Region Example 1 Add value to graph OPA 1652 Noise from datasheet Keyword OPA 1652 • If we know the noise density in , what happens if we multiply by: ? we get Vrms • Operation is the same as taking the area under the noise density curve. • It is an approximation since it does not account for the flicker noise region.
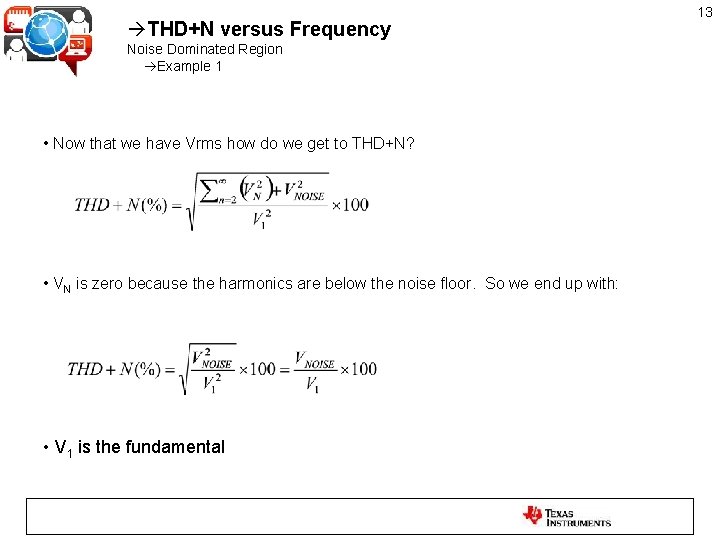
THD+N versus Frequency Noise Dominated Region Example 1 • Now that we have Vrms how do we get to THD+N? • VN is zero because the harmonics are below the noise floor. So we end up with: • V 1 is the fundamental 13
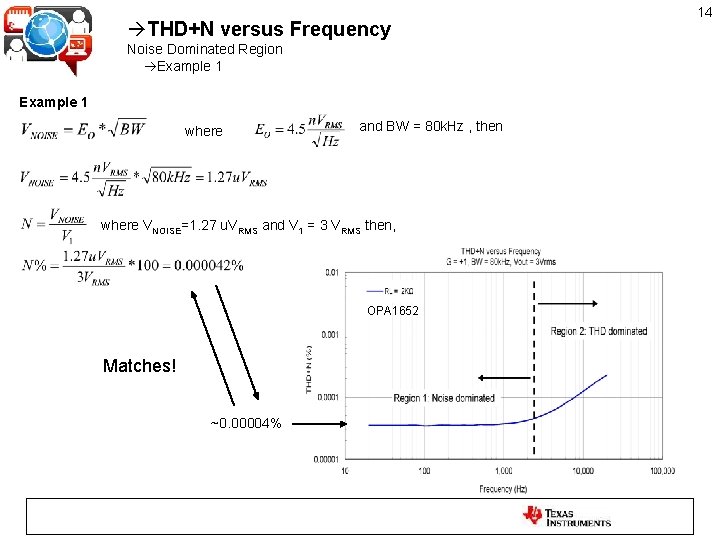
THD+N versus Frequency Noise Dominated Region Example 1 where and BW = 80 k. Hz , then where VNOISE=1. 27 u. VRMS and V 1 = 3 VRMS then, OPA 1652 Matches! ~0. 00004% 14
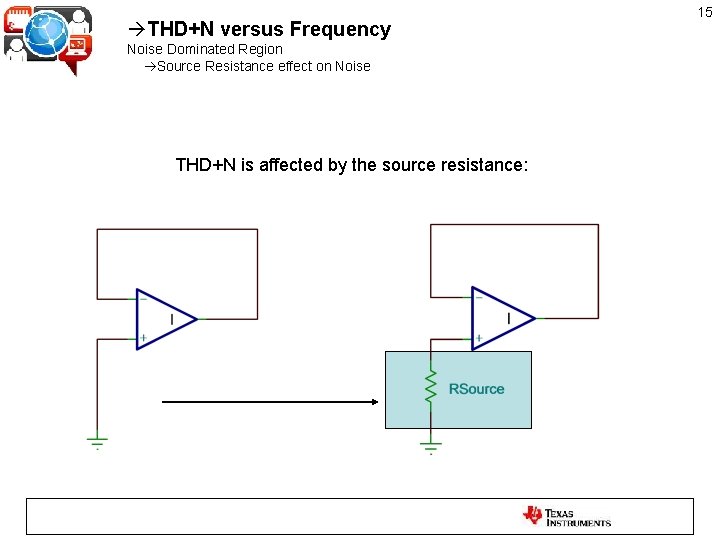
THD+N versus Frequency Noise Dominated Region Source Resistance effect on Noise THD+N is affected by the source resistance: 15
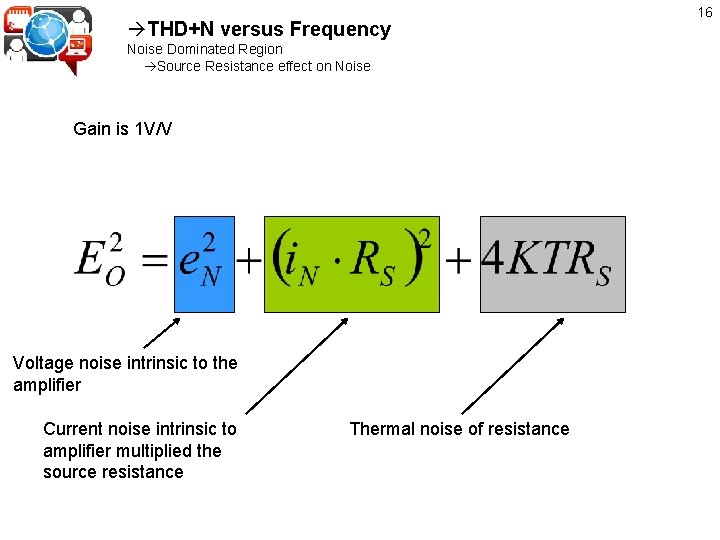
THD+N versus Frequency Noise Dominated Region Source Resistance effect on Noise Gain is 1 V/V Voltage noise intrinsic to the amplifier Current noise intrinsic to amplifier multiplied the source resistance Thermal noise of resistance 16
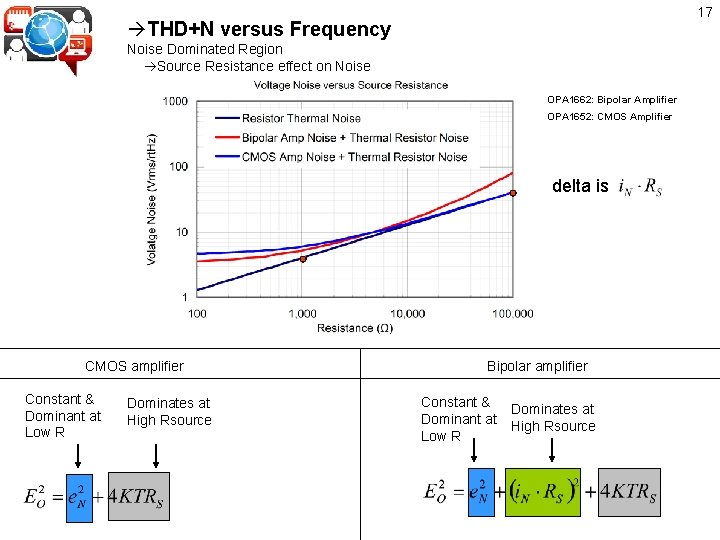
17 THD+N versus Frequency Noise Dominated Region Source Resistance effect on Noise OPA 1662: Bipolar Amplifier OPA 1652: CMOS Amplifier delta is CMOS amplifier Constant & Dominant at Low R Dominates at High Rsource Bipolar amplifier Constant & Dominant at Low R Dominates at High Rsource
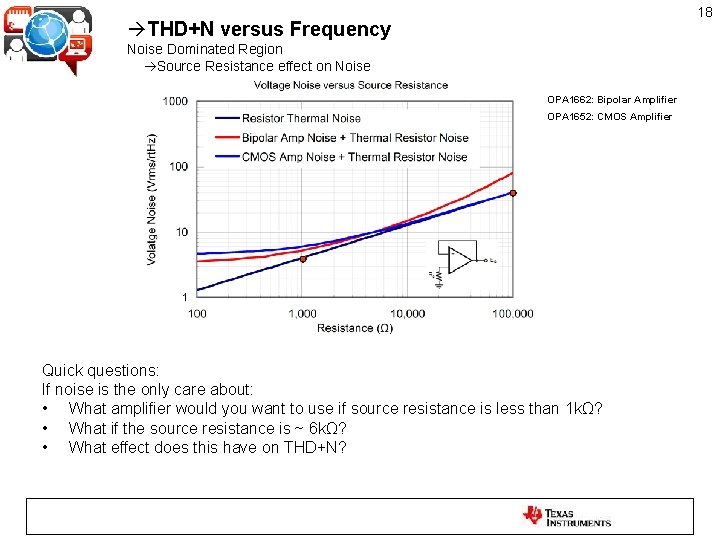
18 THD+N versus Frequency Noise Dominated Region Source Resistance effect on Noise OPA 1662: Bipolar Amplifier OPA 1652: CMOS Amplifier Quick questions: If noise is the only care about: • What amplifier would you want to use if source resistance is less than 1 kΩ? • What if the source resistance is ~ 6 kΩ? • What effect does this have on THD+N?
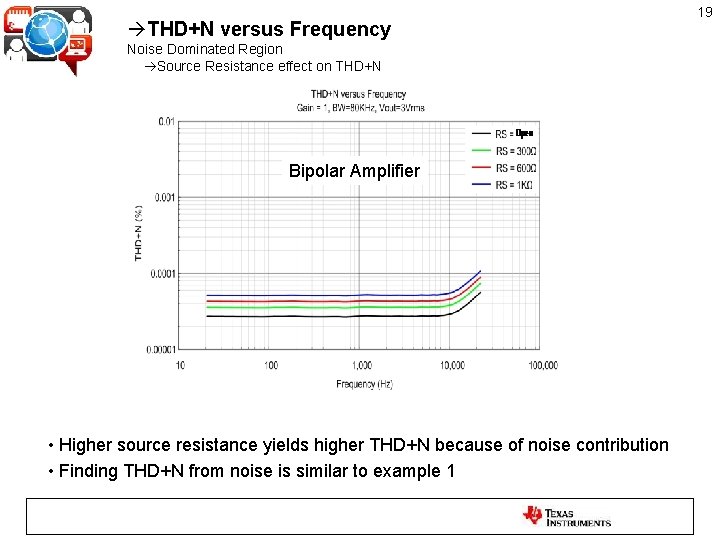
THD+N versus Frequency Noise Dominated Region Source Resistance effect on THD+N Bipolar Amplifier • Higher source resistance yields higher THD+N because of noise contribution • Finding THD+N from noise is similar to example 1 19
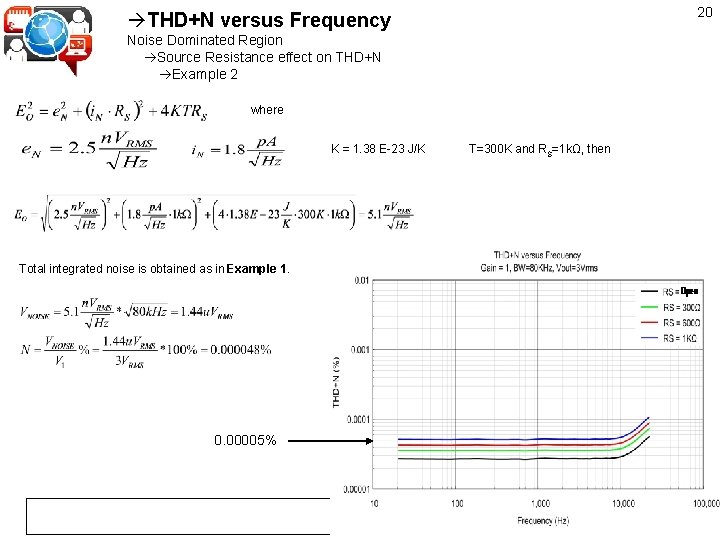
20 THD+N versus Frequency Noise Dominated Region Source Resistance effect on THD+N Example 2 where K = 1. 38 E-23 J/K Total integrated noise is obtained as in Example 1. 0. 00005% T=300 K and RS=1 kΩ, then
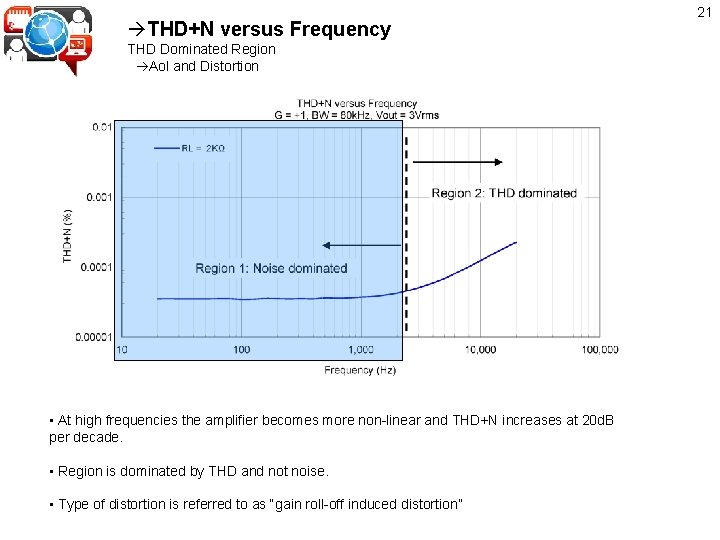
THD+N versus Frequency THD Dominated Region Aol and Distortion • At high frequencies the amplifier becomes more non-linear and THD+N increases at 20 d. B per decade. • Region is dominated by THD and not noise. • Type of distortion is referred to as “gain roll-off induced distortion” 21
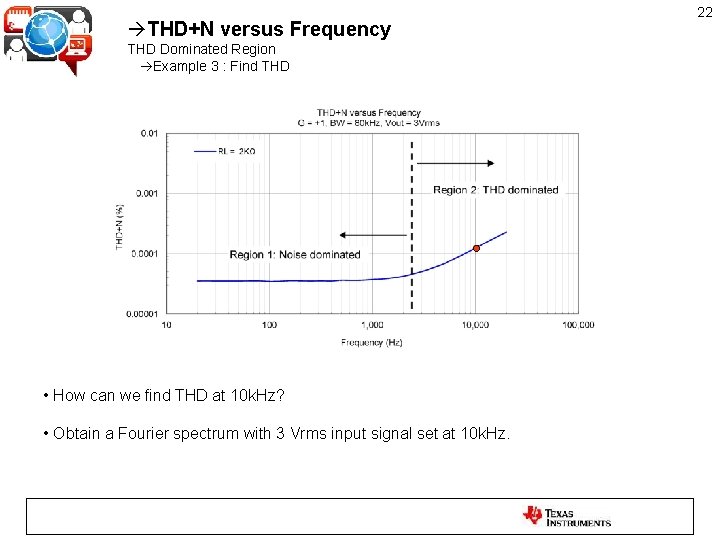
THD+N versus Frequency THD Dominated Region Example 3 : Find THD • How can we find THD at 10 k. Hz? • Obtain a Fourier spectrum with 3 Vrms input signal set at 10 k. Hz. 22
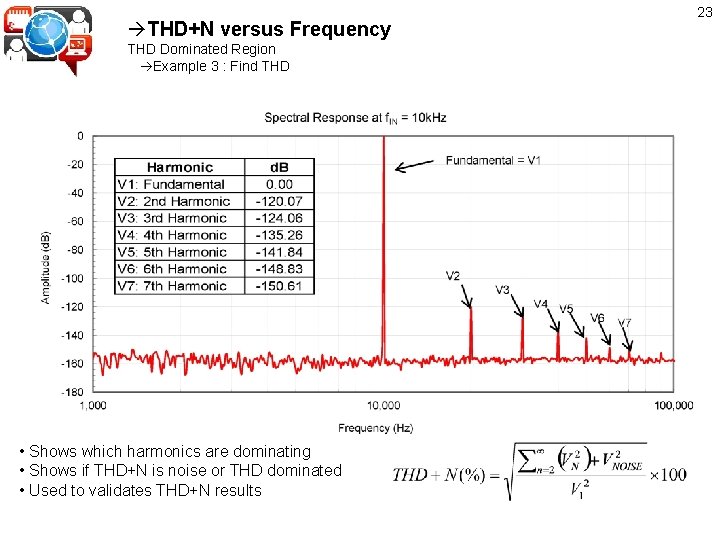
THD+N versus Frequency THD Dominated Region Example 3 : Find THD • Shows which harmonics are dominating • Shows if THD+N is noise or THD dominated • Used to validates THD+N results 23
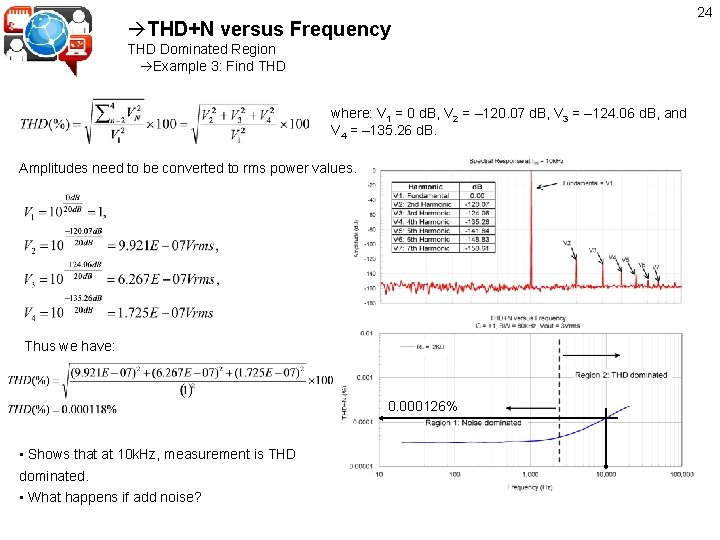
THD+N versus Frequency THD Dominated Region Example 3: Find THD where: V 1 = 0 d. B, V 2 = – 120. 07 d. B, V 3 = – 124. 06 d. B, and V 4 = – 135. 26 d. B. Amplitudes need to be converted to rms power values. Thus we have: 0. 000126% • Shows that at 10 k. Hz, measurement is THD dominated. • What happens if add noise? 24
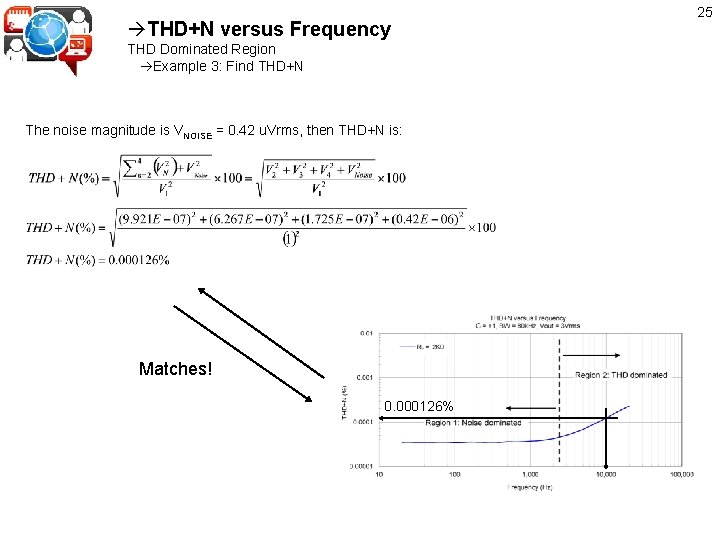
THD+N versus Frequency THD Dominated Region Example 3: Find THD+N The noise magnitude is VNOISE = 0. 42 u. Vrms, then THD+N is: Matches! 0. 000126% 25
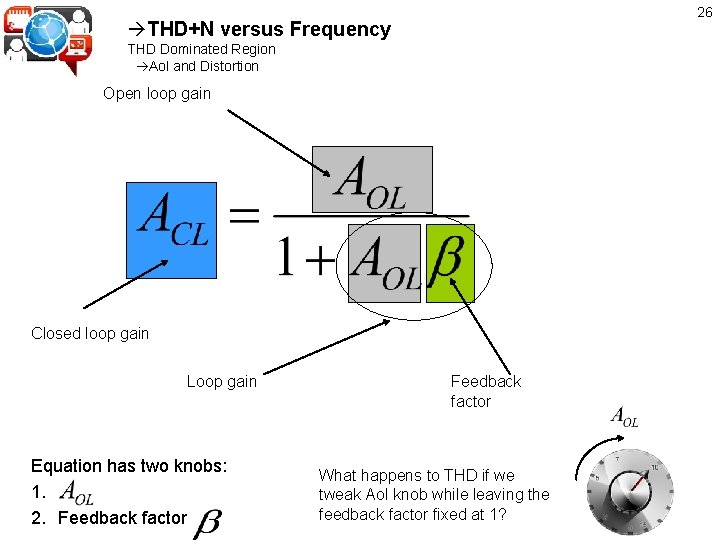
26 THD+N versus Frequency THD Dominated Region Aol and Distortion Open loop gain Closed loop gain Loop gain Equation has two knobs: 1. . 2. Feedback factor What happens to THD if we tweak Aol knob while leaving the feedback factor fixed at 1?
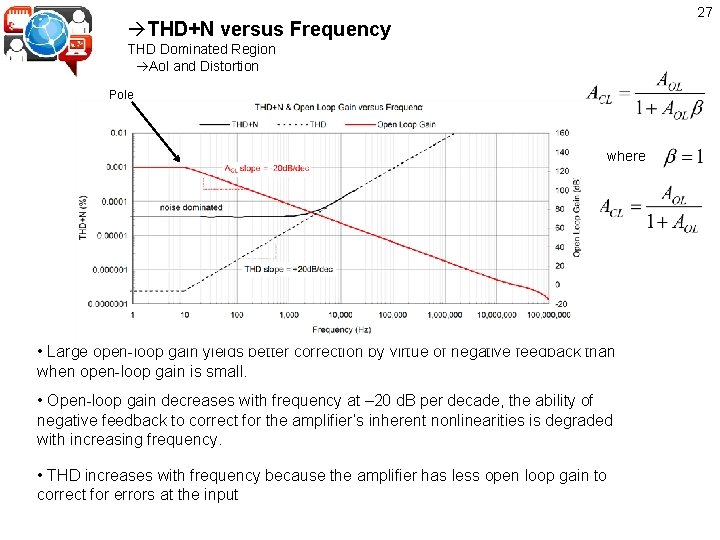
27 THD+N versus Frequency THD Dominated Region Aol and Distortion Pole where • Large open-loop gain yields better correction by virtue of negative feedback than when open-loop gain is small. • Open-loop gain decreases with frequency at – 20 d. B per decade, the ability of negative feedback to correct for the amplifier’s inherent nonlinearities is degraded with increasing frequency. • THD increases with frequency because the amplifier has less open loop gain to correct for errors at the input
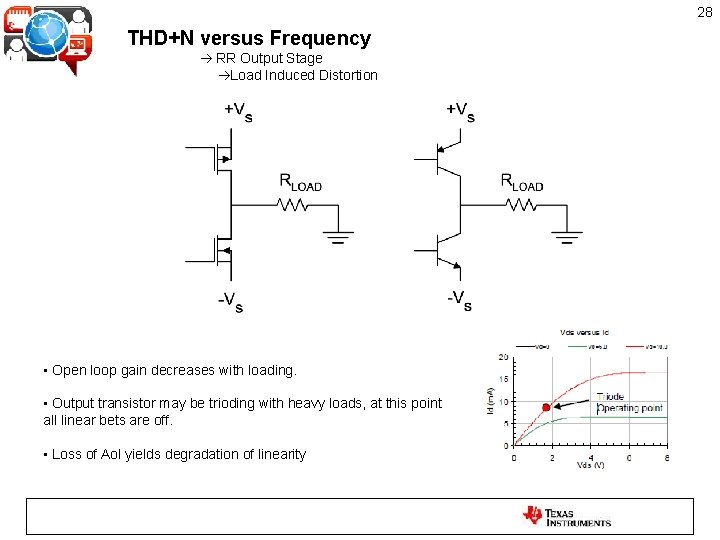
28 THD+N versus Frequency R-to-R Output Stage RR Output Stage Load Induced Distortion • Open loop gain decreases with loading. • Output transistor may be trioding with heavy loads, at this point all linear bets are off. • Loss of Aol yields degradation of linearity
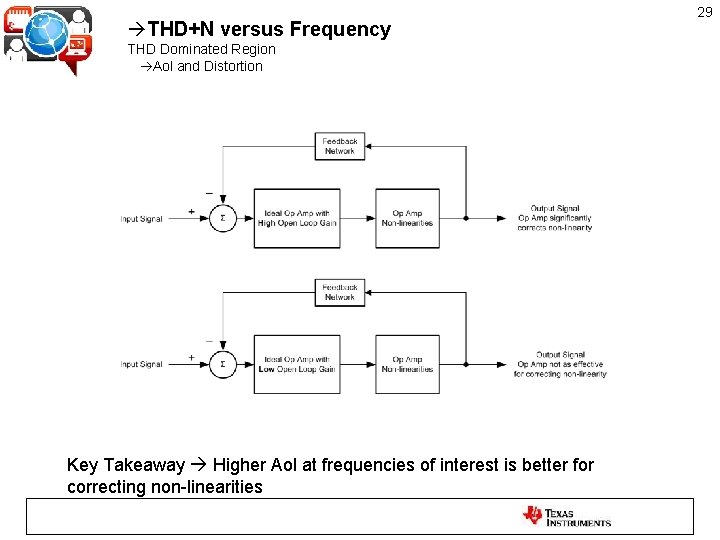
THD+N versus Frequency THD Dominated Region Aol and Distortion Key Takeaway Higher Aol at frequencies of interest is better for correcting non-linearities 29
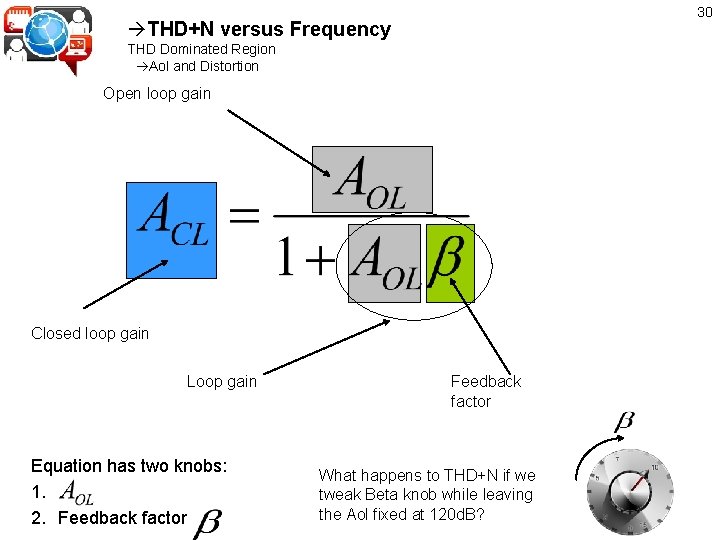
30 THD+N versus Frequency THD Dominated Region Aol and Distortion Open loop gain Closed loop gain Loop gain Equation has two knobs: 1. . 2. Feedback factor What happens to THD+N if we tweak Beta knob while leaving the Aol fixed at 120 d. B?
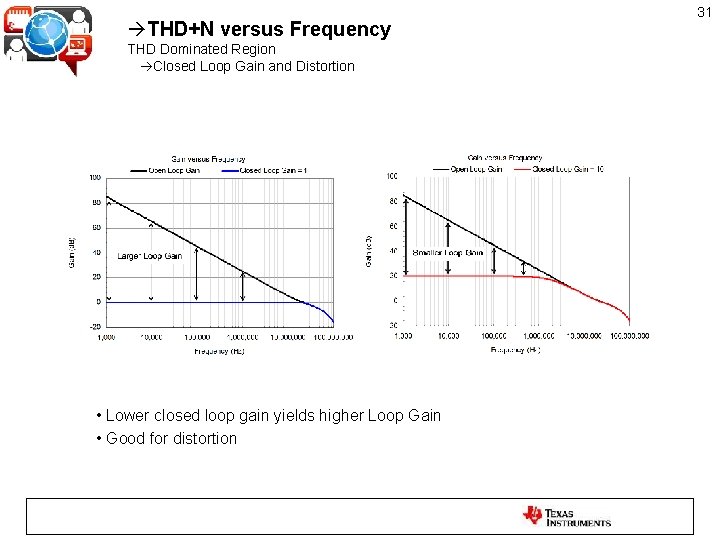
THD+N versus Frequency THD Dominated Region Closed Loop Gain and Distortion • Lower closed loop gain yields higher Loop Gain • Good for distortion 31
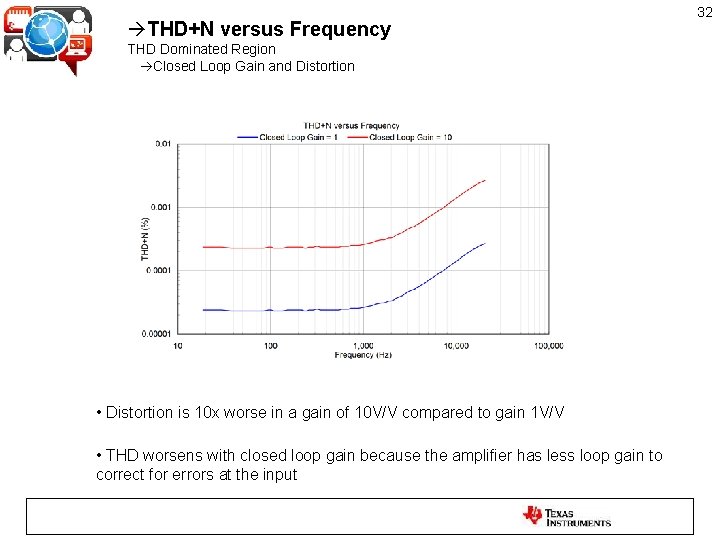
THD+N versus Frequency THD Dominated Region Closed Loop Gain and Distortion • Distortion is 10 x worse in a gain of 10 V/V compared to gain 1 V/V • THD worsens with closed loop gain because the amplifier has less loop gain to correct for errors at the input 32
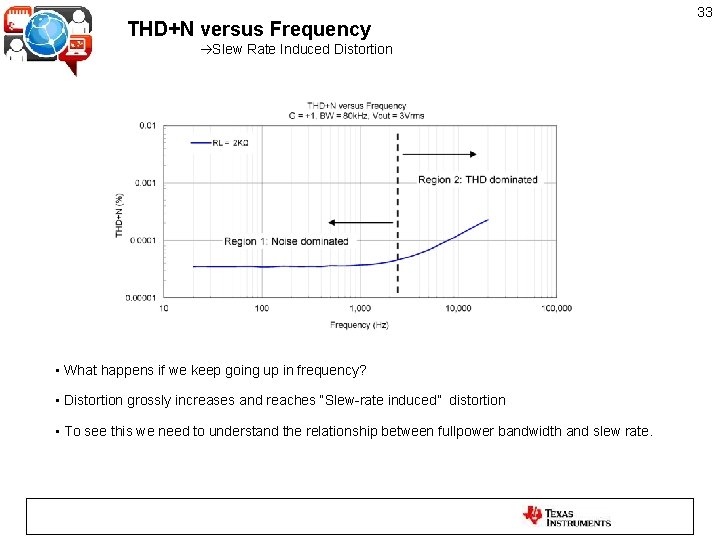
THD+N versus Frequency Slew Rate Induced Distortion • What happens if we keep going up in frequency? • Distortion grossly increases and reaches “Slew-rate induced” distortion • To see this we need to understand the relationship between fullpower bandwidth and slew rate. 33
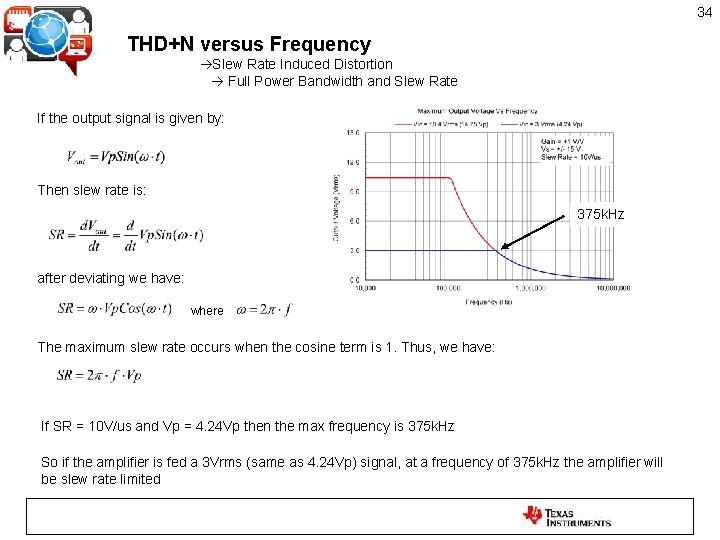
34 THD+N versus Frequency Slew Rate Induced Distortion Full Power Bandwidth and Slew Rate If the output signal is given by: Then slew rate is: 375 k. Hz after deviating we have: where The maximum slew rate occurs when the cosine term is 1. Thus, we have: If SR = 10 V/us and Vp = 4. 24 Vp then the max frequency is 375 k. Hz So if the amplifier is fed a 3 Vrms (same as 4. 24 Vp) signal, at a frequency of 375 k. Hz the amplifier will be slew rate limited
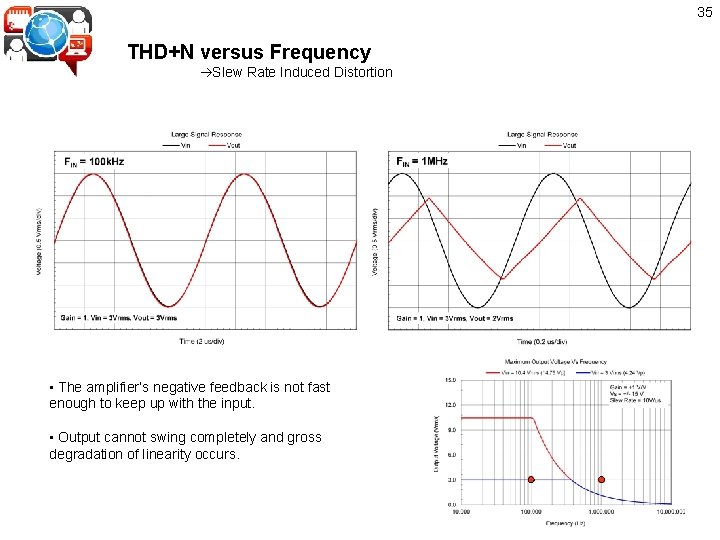
35 THD+N versus Frequency Slew Rate Induced Distortion • The amplifier’s negative feedback is not fast enough to keep up with the input. • Output cannot swing completely and gross degradation of linearity occurs.
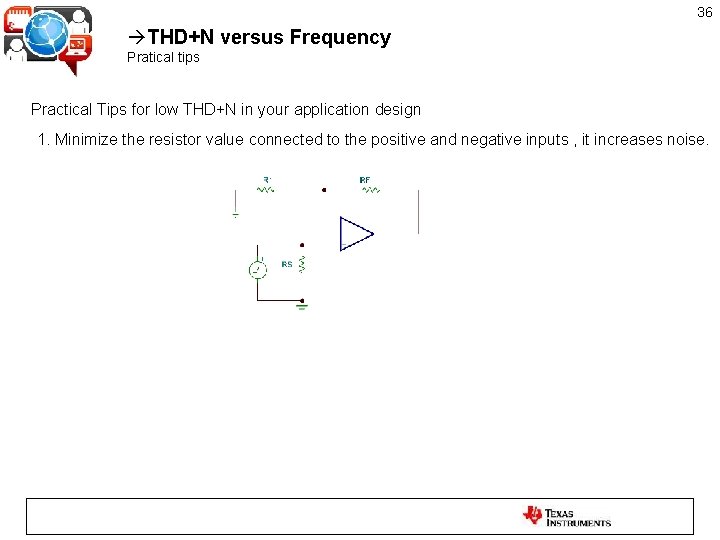
36 THD+N versus Frequency Pratical tips Practical Tips for low THD+N in your application design 1. Minimize the resistor value connected to the positive and negative inputs , it increases noise.
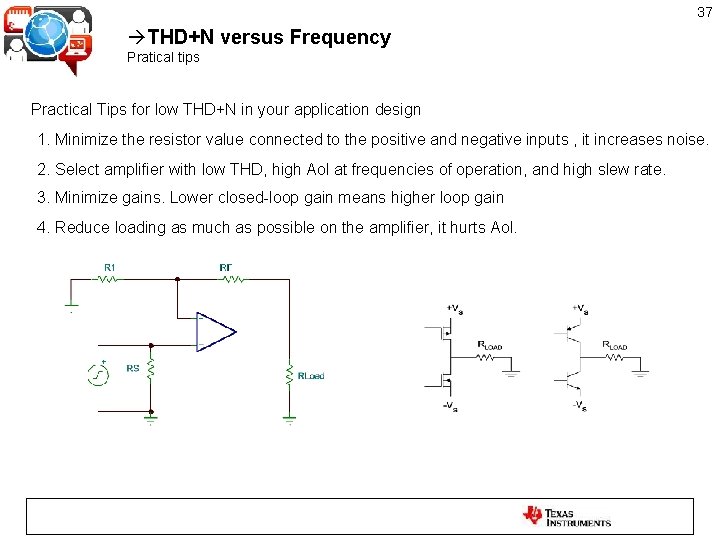
37 THD+N versus Frequency Pratical tips Practical Tips for low THD+N in your application design 1. Minimize the resistor value connected to the positive and negative inputs , it increases noise. 2. Select amplifier with low THD, high Aol at frequencies of operation, and high slew rate. 3. Minimize gains. Lower closed-loop gain means higher loop gain 4. Reduce loading as much as possible on the amplifier, it hurts Aol.
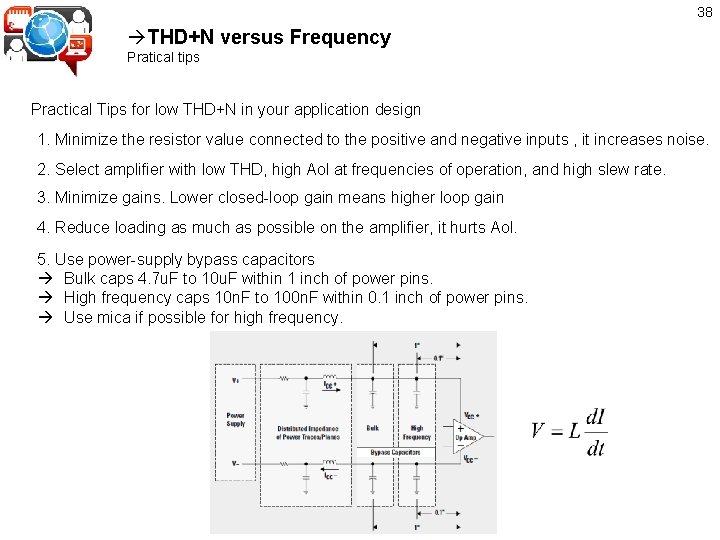
38 THD+N versus Frequency Pratical tips Practical Tips for low THD+N in your application design 1. Minimize the resistor value connected to the positive and negative inputs , it increases noise. 2. Select amplifier with low THD, high Aol at frequencies of operation, and high slew rate. 3. Minimize gains. Lower closed-loop gain means higher loop gain 4. Reduce loading as much as possible on the amplifier, it hurts Aol. 5. Use power-supply bypass capacitors Bulk caps 4. 7 u. F to 10 u. F within 1 inch of power pins. High frequency caps 10 n. F to 100 n. F within 0. 1 inch of power pins. Use mica if possible for high frequency.
39 THD+N versus Frequency Pratical tips Practical Tips for low THD+N in your application design 1. Minimize the resistor value connected to the positive and negative inputs , it increases noise. 2. Select amplifier with low THD, high Aol at frequencies of operation, and high slew rate. 3. Minimize gains. Lower closed-loop gain means higher loop gain 4. Reduce loading as much as possible on the amplifier, it hurts Aol. 5. Use power-supply bypass capacitors Bulk caps 4. 7 u. F to 10 u. F within 1 inch of power pins. High frequency caps 10 n. F to 100 n. F within 0. 1 inch of power pins. Use mica if possible for high frequency. 6. Remove ground planes underneath amplifier and use minimum feedback resistor values so as to avoid effects of parasitic capacitance.
40 Summary Types of distortion: 1. Noise dominated distortion 2. Gain roll-off induced distortion 3. Slew induced distortion 4. Practical tips Things to look forward to: 1. THD+N versus Amplitude plots and their significance 2. Measuring lower than -120 d. B (the Audio Precision’s noise floor) 3. Troubleshooting THD+N values with “reading channel” 4. Effects of temperature on distortion: Thermal Distortion Acknowledgements: Art Kay, Bruce Trump, Randy Heilman References: • Bob Metzler’s Audio Precision Measurement Handbook • James Karki’s Designing for low distortion with high speed opamps • Gray and Meyer
41 THD+N versus Frequency Back up slides
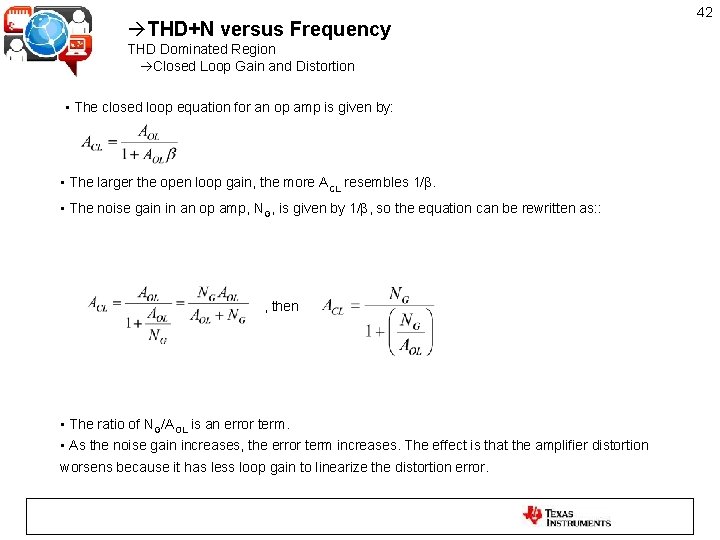
THD+N versus Frequency THD Dominated Region Closed Loop Gain and Distortion • The closed loop equation for an op amp is given by: • The larger the open loop gain, the more ACL resembles 1/β. • The noise gain in an op amp, NG, is given by 1/β, so the equation can be rewritten as: : , then • The ratio of NG/AOL is an error term. • As the noise gain increases, the error term increases. The effect is that the amplifier distortion worsens because it has less loop gain to linearize the distortion error. 42
- Slides: 42