
1 ELASTICITA DELLA DOMANDA potere di mercato FISSARE


- Slides: 27
1. ELASTICITA’ DELLA DOMANDA potere di mercato (FISSARE IL PREZZO) ≠ da potere contrattuale (TAKE OR LEAVE OFFER CAP 3 e 4) e (ancora di più) da potere nell’impresa (CAPACITA’ DI IMPORRE SANZIONI, COSTI CAP 6)
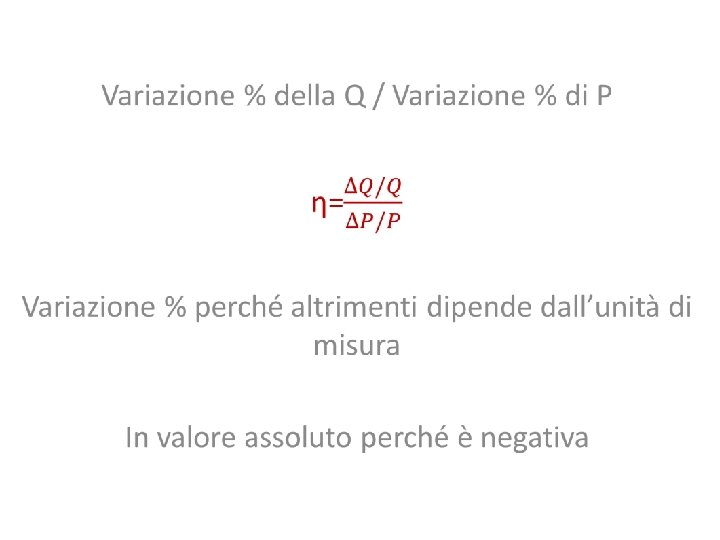
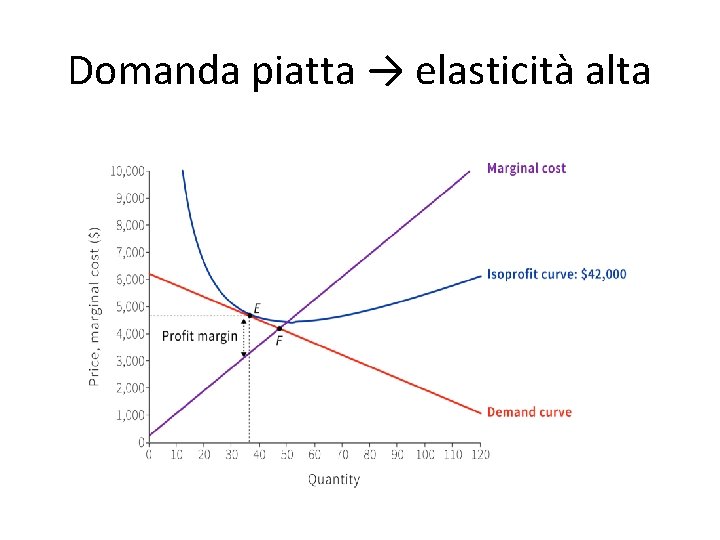
Domanda piatta → elasticità alta
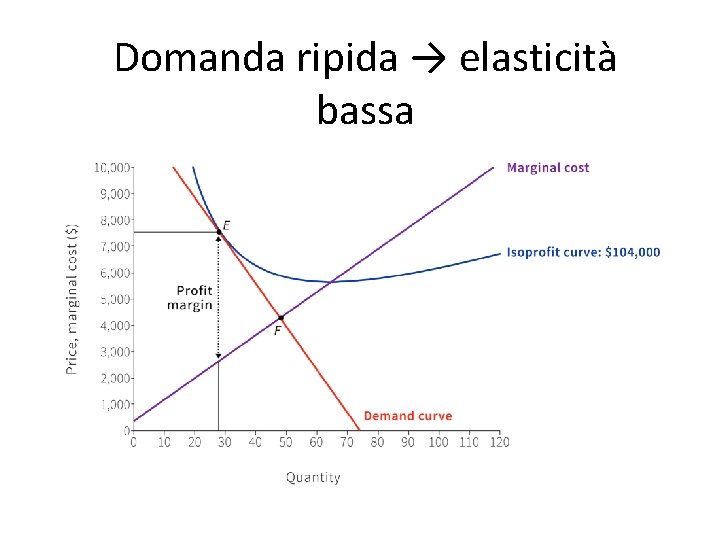
Domanda ripida → elasticità bassa
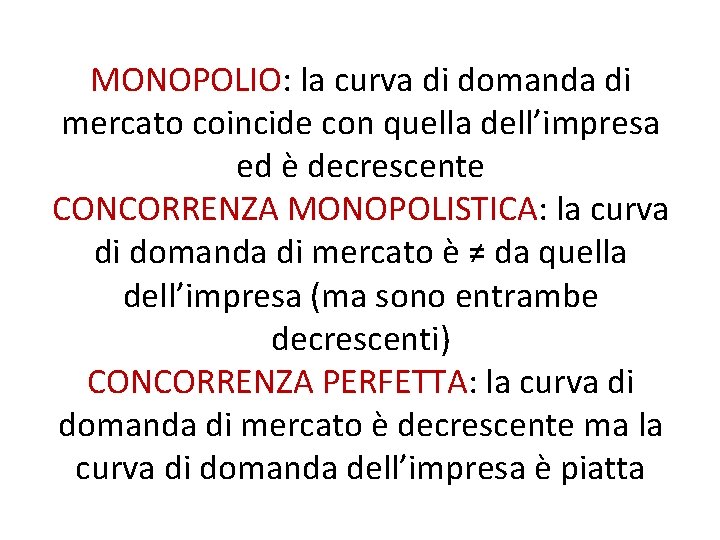
MONOPOLIO: la curva di domanda di mercato coincide con quella dell’impresa ed è decrescente CONCORRENZA MONOPOLISTICA: la curva di domanda di mercato è ≠ da quella dell’impresa (ma sono entrambe decrescenti) CONCORRENZA PERFETTA: la curva di domanda di mercato è decrescente ma la curva di domanda dell’impresa è piatta
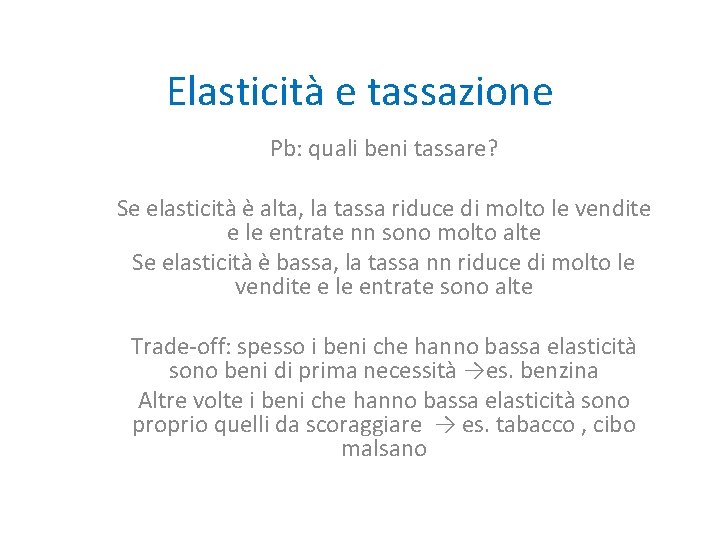
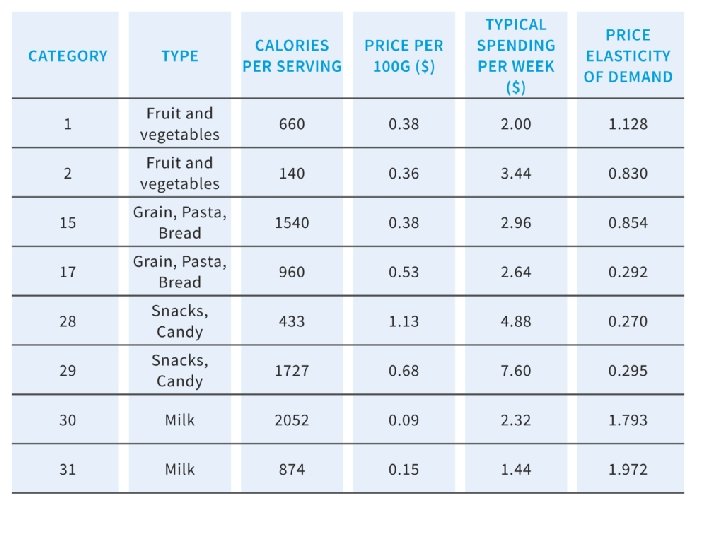
Elasticità e tassazione Pb: quali beni tassare? Se elasticità è alta, la tassa riduce di molto le vendite e le entrate nn sono molto alte Se elasticità è bassa, la tassa nn riduce di molto le vendite e le entrate sono alte Trade-off: spesso i beni che hanno bassa elasticità sono beni di prima necessità →es. benzina Altre volte i beni che hanno bassa elasticità sono proprio quelli da scoraggiare → es. tabacco , cibo malsano
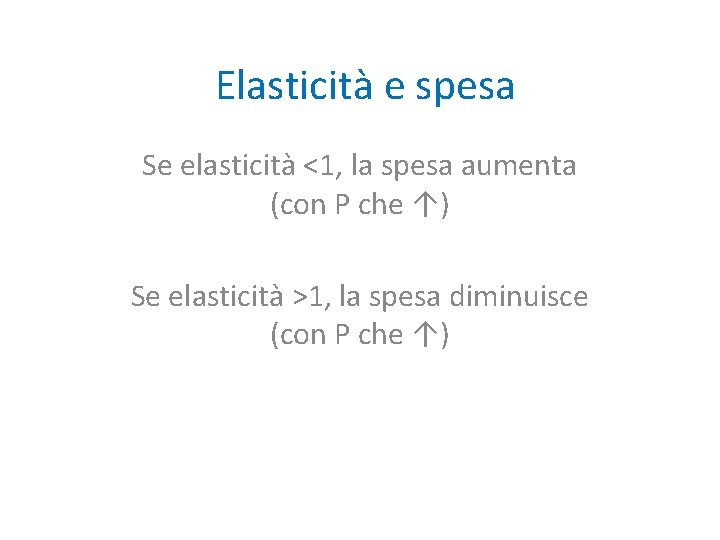
Elasticità e spesa Se elasticità <1, la spesa aumenta (con P che ↑) Se elasticità >1, la spesa diminuisce (con P che ↑)
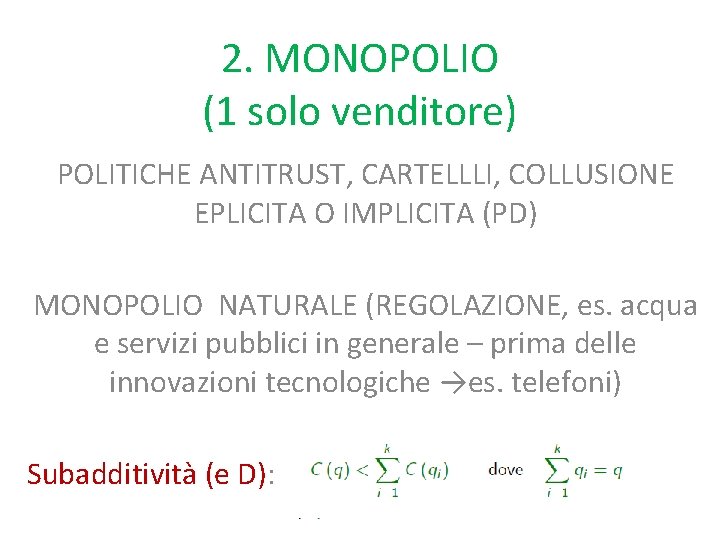
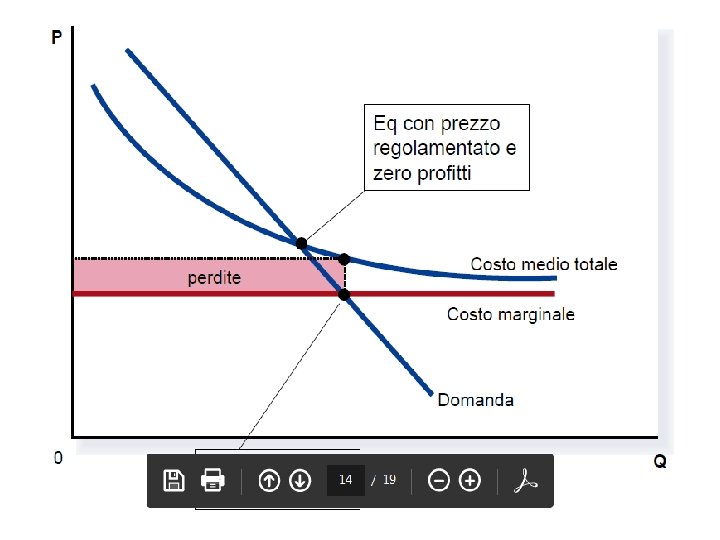
2. MONOPOLIO (1 solo venditore) POLITICHE ANTITRUST, CARTELLLI, COLLUSIONE EPLICITA O IMPLICITA (PD) MONOPOLIO NATURALE (REGOLAZIONE, es. acqua e servizi pubblici in generale – prima delle innovazioni tecnologiche →es. telefoni) Subadditività (e D):
3. CONCORRENZA MONOPOLISTICA (differenziazione verticale e orizzontale) Trade-off efficienza varietà Politiche dell’impresa Aspetto concorrenziale (sostituti e η)
TEST UNDERSTANDING
UNIT 7. THE FIRM AND ITS CUSTOMERS
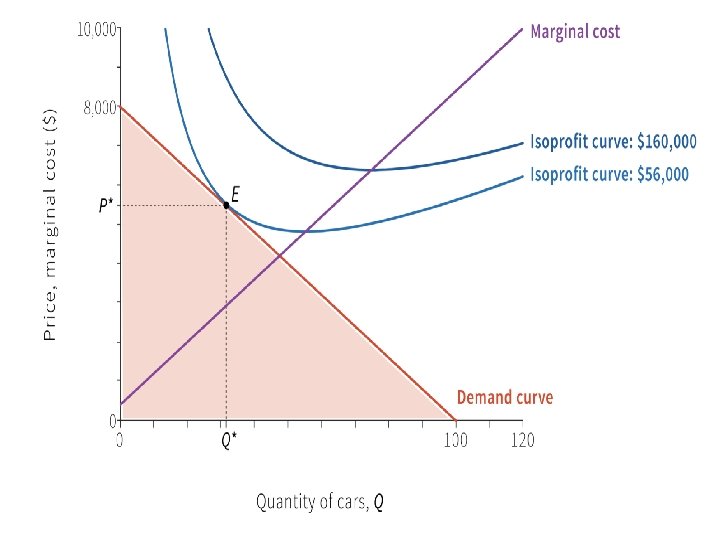
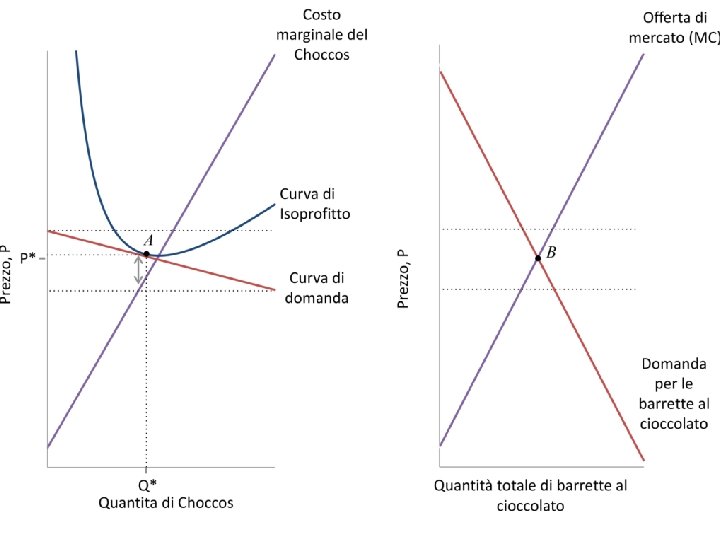
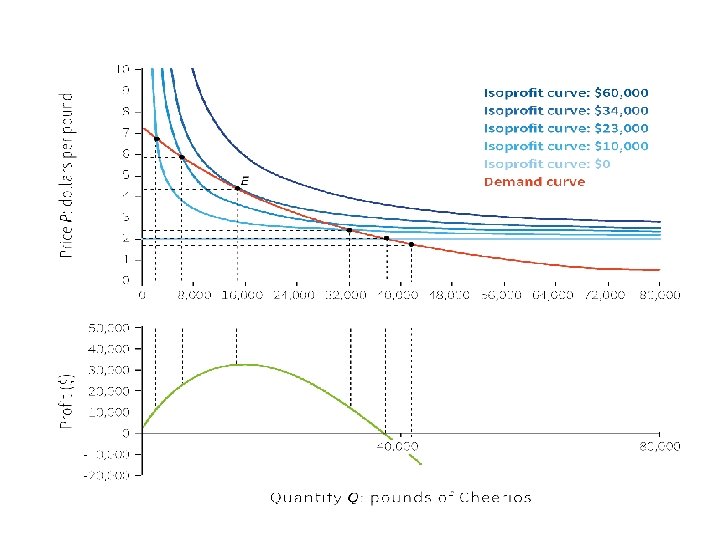
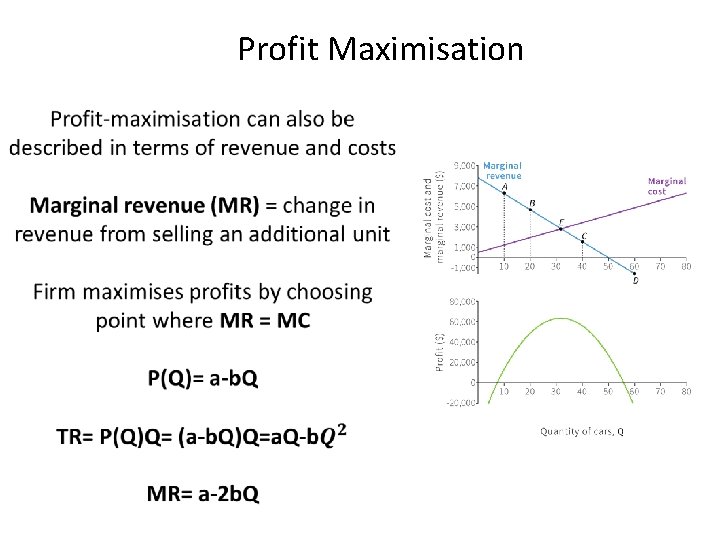
T 7. 1 Profit-maximising choice The following diagram shows the market demand curve of Apple Cinnamon Cheerios, the isoprofit curves of the producer firm, and the firm’s profit function curve. Based on the graph, which of the following are correct? Select all correct answers a. The highest profit that the firm can make is $60, 000. b. The profit-maximising choice for the firm is where the highest attainable isoprofit curve is tangent to the demand curve. c. The profit-maximising choice for the firm is where its marginal rate of substitution between the price charged and the quantity produced equate to its marginal rate of transformation. d. The profit-maximising choice for the Section 7. 1 firm is at the peak of its profit function curve.
T 7. 2 Returns to scale and economies of scale Which of the following would contribute to economies of scale? Select all correct answers a. Large supermarkets being able to drive down the cost of purchasing milk as it increases its scale of business. b. The expansion of the workforce requiring extra layers of management for better performance monitoring. c. A merger of two firms leading to savings on the costs of HR, IT and legal departments. d. The higher the number of users of Windows 10, the more likely it is that Microsoft will be able to achieve a higher sale of its operating system. Section 7. 2
T 7. 4 Fixed cost Suppose that the marginal cost of producing a pound of cereal is $2, irrespective of the level of output, but there also some fixed costs of production. Which of the following statements is correct? Select one answer a. The total cost curve is an upward-sloping straight line through the origin. b. The average cost curve is U-shaped. c. The marginal cost curve is a horizontal straight line. d. The marginal cost curve intersects the average cost curve at its minimum point. Section 7. 3
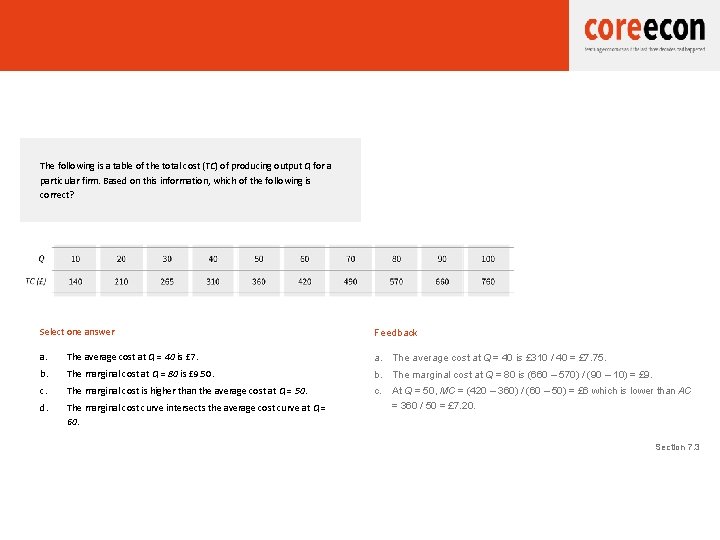
ANSWER: T 7. 3 Average cost and marginal cost The following is a table of the total cost (TC) of producing output Q for a particular firm. Based on this information, which of the following is correct? Select one answer Feedback a. The average cost at Q = 40 is £ 7. a. The average cost at Q = 40 is £ 310 / 40 = £ 7. 75. b. The marginal cost at Q = 80 is £ 9. 50. b. The marginal cost at Q = 80 is (660 – 570) / (90 – 10) = £ 9. c. The marginal cost is higher than the average cost at Q = 50. d. The marginal cost curve intersects the average cost curve at Q = 60. c. At Q = 50, MC = (420 – 360) / (60 – 50) = £ 6 which is lower than AC = 360 / 50 = £ 7. 20. Section 7. 3
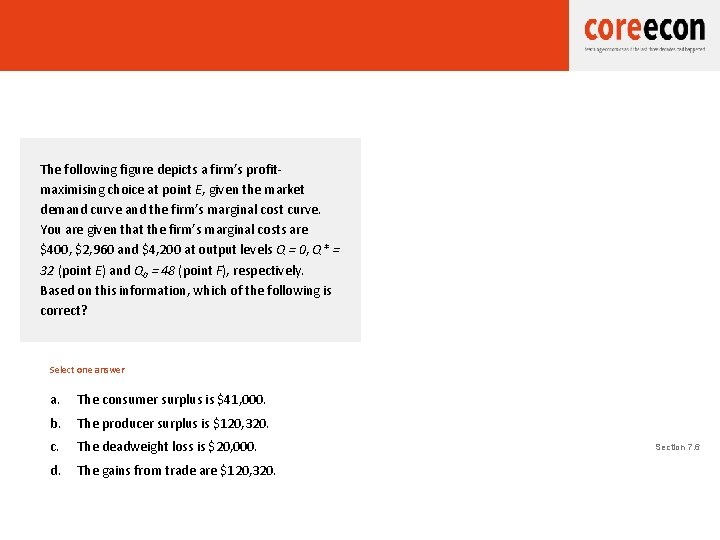
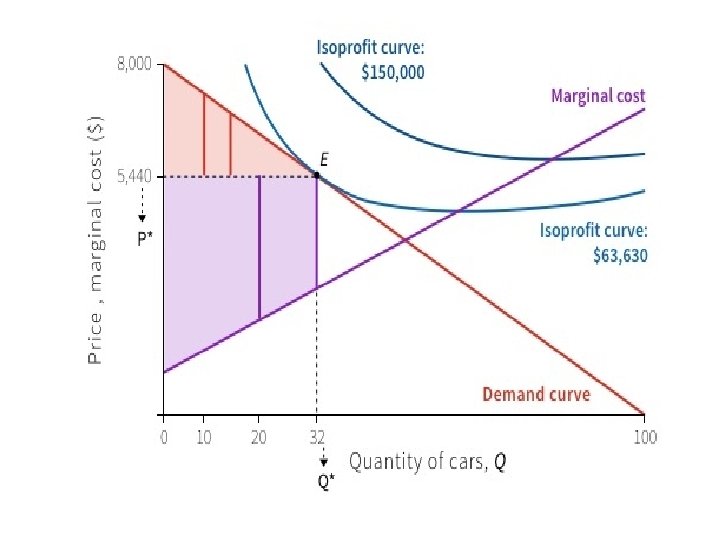
T 7. 5 Consumer and producer surplus The following figure depicts a firm’s profitmaximising choice at point E, given the market demand curve and the firm’s marginal cost curve. You are given that the firm’s marginal costs are $400, $2, 960 and $4, 200 at output levels Q = 0, Q* = 32 (point E) and Q 0 = 48 (point F), respectively. Based on this information, which of the following is correct? Select one answer a. The consumer surplus is $41, 000. b. The producer surplus is $120, 320. c. The deadweight loss is $20, 000. d. The gains from trade are $120, 320. Section 7. 6
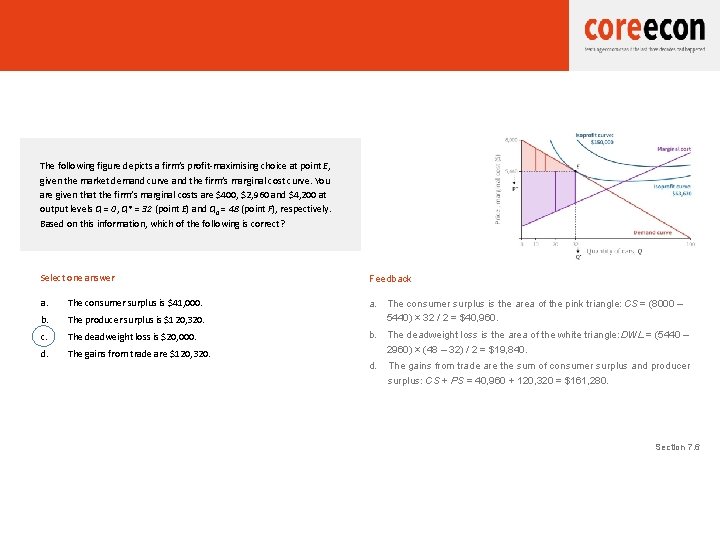
ANSWER: T 7. 5 Consumer and producer surplus The following figure depicts a firm’s profit-maximising choice at point E, given the market demand curve and the firm’s marginal cost curve. You are given that the firm’s marginal costs are $400, $2, 960 and $4, 200 at output levels Q = 0, Q* = 32 (point E) and Q 0 = 48 (point F), respectively. Based on this information, which of the following is correct? Select one answer Feedback a. The consumer surplus is $41, 000. b. The producer surplus is $120, 320. a. The consumer surplus is the area of the pink triangle: CS = (8000 – 5440) × 32 / 2 = $40, 960. c. The deadweight loss is $20, 000. d. The gains from trade are $120, 320. b. The deadweight loss is the area of the white triangle: DWL = (5440 – 2960) × (48 – 32) / 2 = $19, 840. d. The gains from trade are the sum of consumer surplus and producer surplus: CS + PS = 40, 960 + 120, 320 = $161, 280. Section 7. 6
Profit Maximisation