1 Economics of CO 2 Storage and Sink


- Slides: 13

1 Economics of CO 2 Storage and Sink Enhancement Options: A Utility Perspective Research Funded by DOE, TVA, and EPRI Collaborators: EPRI, MIT, Parsons, IEA GHG Programme, SFA Pacific, UTK Bert Bock

2 Utility Options • Internal operations – Improved energy efficiency – Fuels containing less carbon per unit of energy – Renewable energy sources • External operations – Storage of captured CO 2 – CO 2 storage in forests and soils (CO 2 sink enhancement) • Utilities need better economic assessment of external options

3 CO 2 Sequestration Options Compared • Storage of Captured CO 2 --Depleted gas reservoirs --Depleted oil reservoirs --Deep saline aquifers --Enhanced oil recovery --Enhanced coalbed methane recovery --Ocean pipeline --Ocean tanker • CO 2 Sink Enhancement --Forest management New plantations Restoration Agro-forestry Avoided deforestation --Cropland via reducing tillage (USA)

Challenges • CO 2 capture costs + storage costs (DOE/EPRI, 2000) (this project) compared with CO 2 sink enhancement costs (this project) • Estimating net reductions in GHG emissions (avoided GHG emissions) • Life-cycle basis (cradle to grave) • Accounting for timing differences – Costs of Storage and sink enhancement (NPV) – Avoided GHG emissions • Revenues from GHG markets (NPV) • Avoided carbon taxes (NPV) • 100 -year planning horizon 4

5 Net Cost of Storing Captured CO 2

6 CO 2 Capture Cost (DOE/EPRI, 2000) • IGCC reference plant (425 MW net, 43% efficiency) vs. IGCC CO 2 capture plant (404 MW net, 37% efficiency) • $64/tonne C eq. LC GHG avoided in capture process • IGCC CO 2 capture costs are 3 to 7 times > typical storage costs without by-products

CO 2 Capture + Net Storage Costs: Base Cases, NPV Basis CO 2 Storage Process $/tonne C eq. LC GHG avoided Enhanced oil recovery 15 Enhanced coalbed methane recovery 41 Depleted gas reservoir 86 Depleted oil reservoir 81 Deep saline aquifer 77 Ocean pipeline 89 Ocean tanker 143 7

Deep Aquifer Example: COE, $/MWh Reference plant (no capture) 43. 98 CO 2 Capture costs (years 1 -20) 11. 10 CO 2 Storage costs (years 1 -20) 2. 27 Monitoring costs, etc. (years 21 -100) 0. 03 Total cost of electricity 57. 38 8

9 Conclusions • Methodologies were developed to compare economics of a wide range of CO 2 storage and sink enhancement options from a utility perspective • Base-case cost ranges: – CO 2 capture and storage ($15 to 145/tonne CE avoided) – Forest management • Aboveground ($10 to 175/tonne CE avoided) • “All” ($-160 to 55/tonne CE avoided) – Cropland via reducing tillage ($50 to 90/tonne CE avoided) • Significant opportunity for early adopters to reap “low hanging fruit”

Forestry Cases Management Type 1 0 Type of Trees Country/region New Plantation Loblolly pine USA (South) New Plantation Douglas Fir USA (Pacific NW) New Plantation Spanish Cedar Mexico Restoration Pine-oak Mexico Restoration Miombo Southern Africa Agro-forestry Mango-Tamarind India (South) Avoidance of deforestation Various Mexico

Costs: Medium Productivity Cases, NPV Basis 1 1

Reducing Tillage on U. S. Cropland: Factors Affecting Costs ($/tonne C eq. LC GHG avoided) • Adoption incentive paid to farmer by utility = f (Δ crop yield, Δ crop production costs, Δ risk) • Transaction costs • Monitoring costs • Δ C sequestered in soil organic matter • Δ N 2 O emissions from soil • Δ GHG emissions from crop production inputs 1 2

Intensive Till to No Till Costs: Base Cases, NPV Basis 1 3
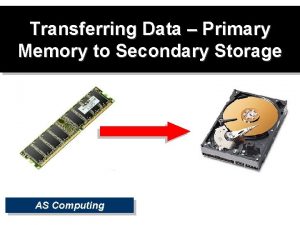
 Transferring of data from auxiliary storage to main storage
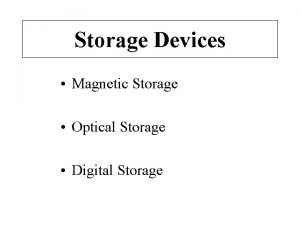
 Storage devices of computer
 Maastricht university school of business and economics
 Source to sink phloem
 Sources of requirements in software engineering
 Source and sink flow
 Secondary storage provides temporary or volatile storage
 Object based and unified storage
 What is mathematical economics
 Tracheids and vessels
 Sink y source
 What information should a master cleaning schedule contain?
 Sink homonyms
 Food and nutrition 2 state test review
