
1 Correlational Designs Correlational Research Objective to relate
1 Correlational Designs
Correlational Research Objective: to relate variables to one another as opposed to attempting to manipulate them as in experimental designs. 2
Today’s Learning Objectives: To learn and get familiar with: - how to define Correlational Research and when one can use it - components of the two types of correlational designs - key characteristics of this research - potential ethical issues that may arise - steps for conducting such research - criteria for evaluating such a study 3
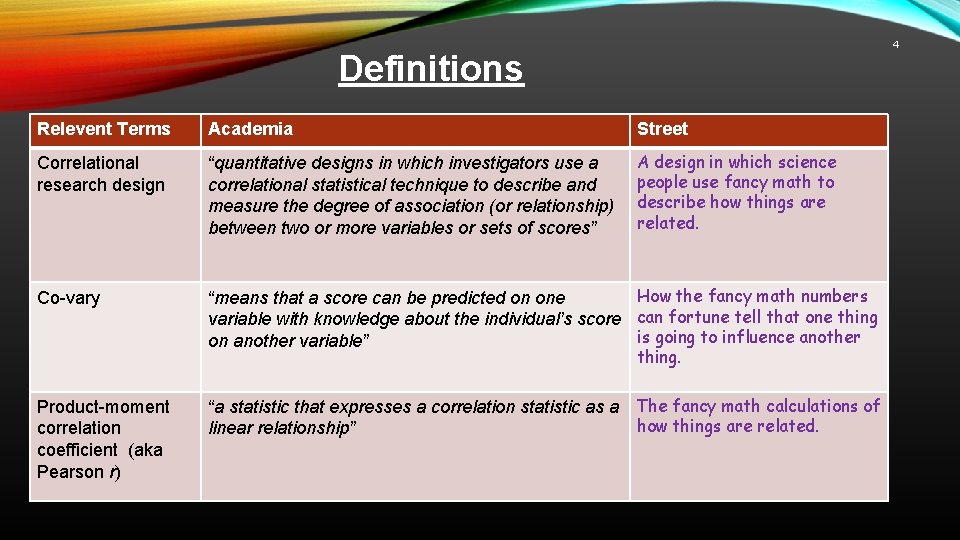
4 Definitions Relevent Terms Academia Street Correlational research design “quantitative designs in which investigators use a correlational statistical technique to describe and measure the degree of association (or relationship) between two or more variables or sets of scores” A design in which science people use fancy math to describe how things are related. Co-vary How the fancy math numbers “means that a score can be predicted on one variable with knowledge about the individual’s score can fortune tell that one thing is going to influence another on another variable” thing. Product-moment correlation coefficient (aka Pearson r) “a statistic that expresses a correlation statistic as a The fancy math calculations of how things are related. linear relationship”
5 When do you use Correlational Research? When you are looking to find a relationship with two or more variables to see if they influence each other. Which, in turn, allows one to make predications of outcomes. ***Corrlation does not imply causation***
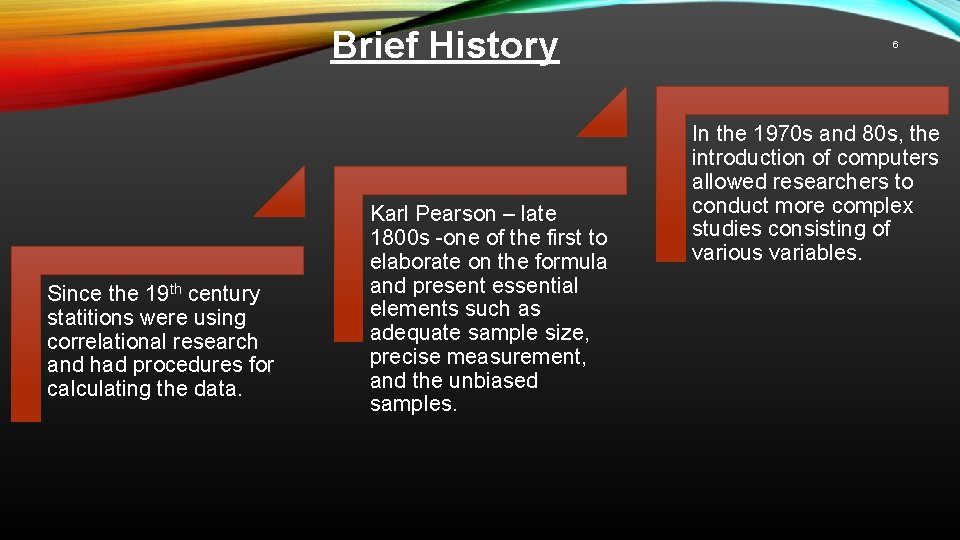
Brief History Since the 19 th century statitions were using correlational research and had procedures for calculating the data. Karl Pearson – late 1800 s -one of the first to elaborate on the formula and present essential elements such as adequate sample size, precise measurement, and the unbiased samples. 6 In the 1970 s and 80 s, the introduction of computers allowed researchers to conduct more complex studies consisting of various variables.
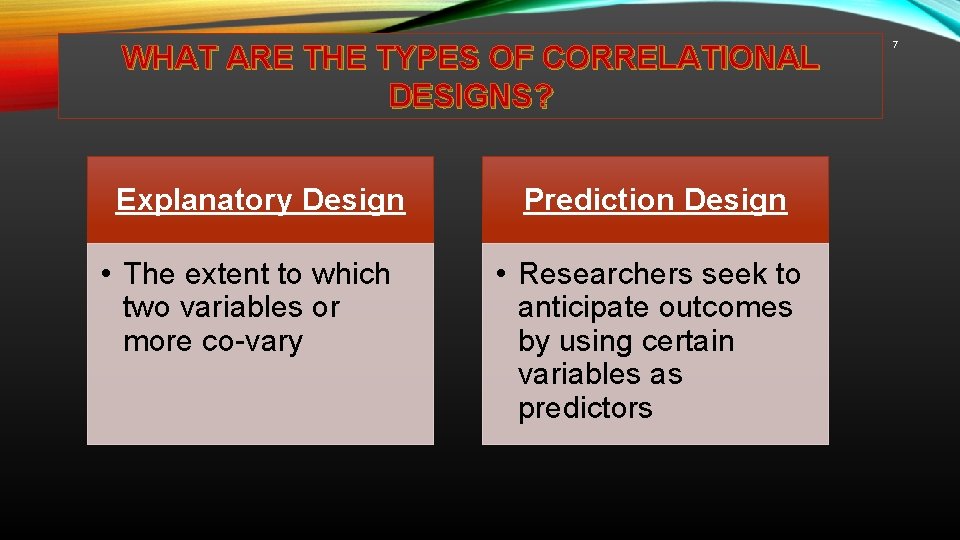
WHAT ARE THE TYPES OF CORRELATIONAL DESIGNS? Explanatory Design • The extent to which two variables or more co-vary Prediction Design • Researchers seek to anticipate outcomes by using certain variables as predictors 7
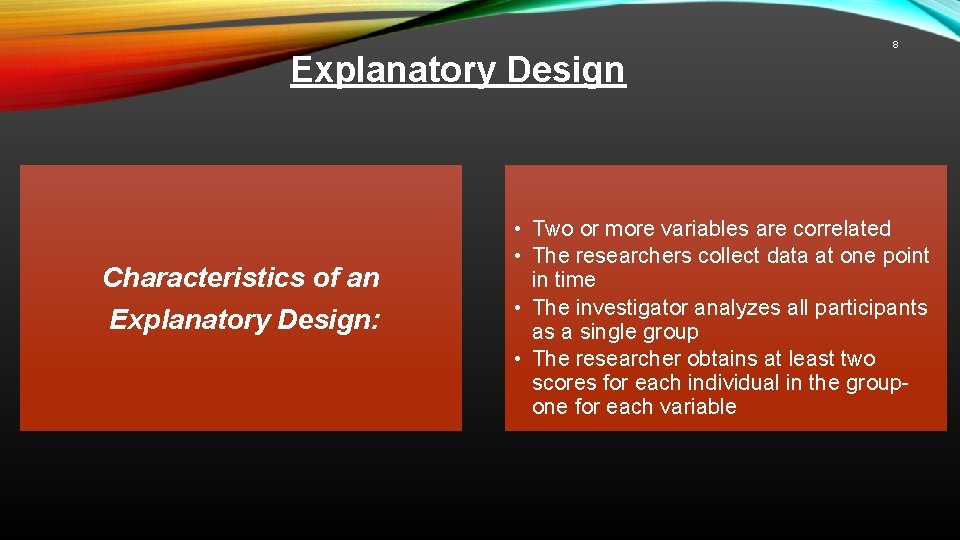
Explanatory Design Characteristics of an Explanatory Design: 8 • Two or more variables are correlated • The researchers collect data at one point in time • The investigator analyzes all participants as a single group • The researcher obtains at least two scores for each individual in the groupone for each variable
9 Prediction Design Characteristics of a Prediction Design: • The researchers typically measure the predictor variable(s) at one point in time and the criterion variable at a later point in time
Displays of Scores Scatter plot (graph) Correlation matrix (table) 10
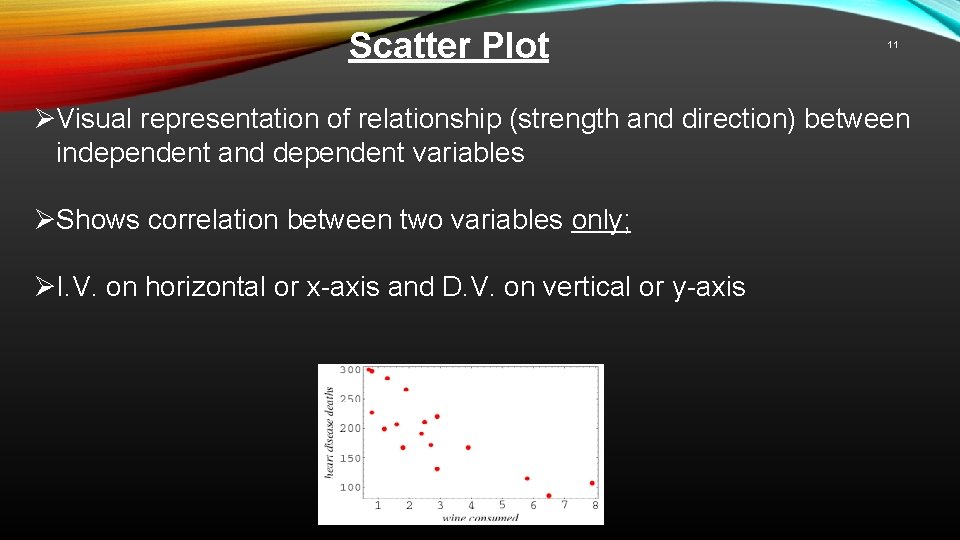
Scatter Plot 11 ØVisual representation of relationship (strength and direction) between independent and dependent variables ØShows correlation between two variables only; ØI. V. on horizontal or x-axis and D. V. on vertical or y-axis
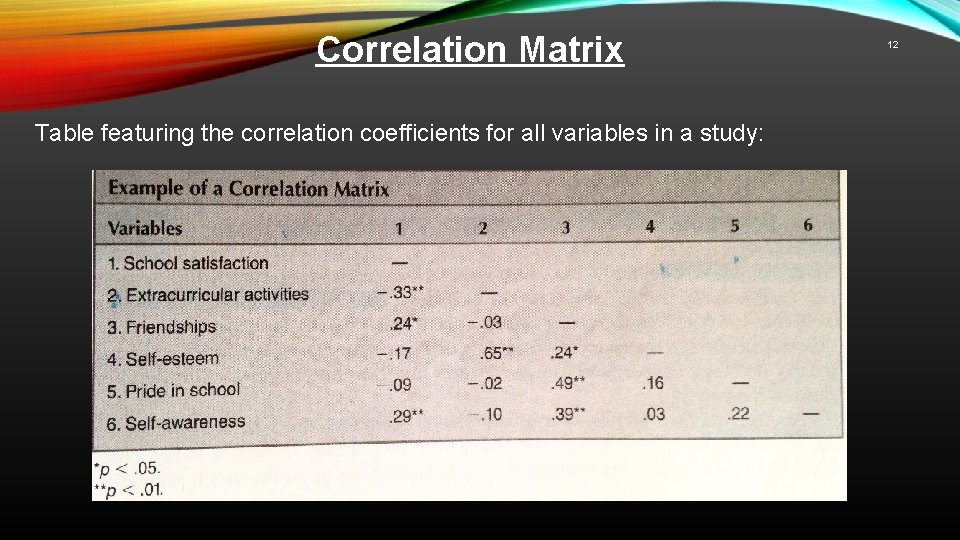
Correlation Matrix Table featuring the correlation coefficients for all variables in a study: 12
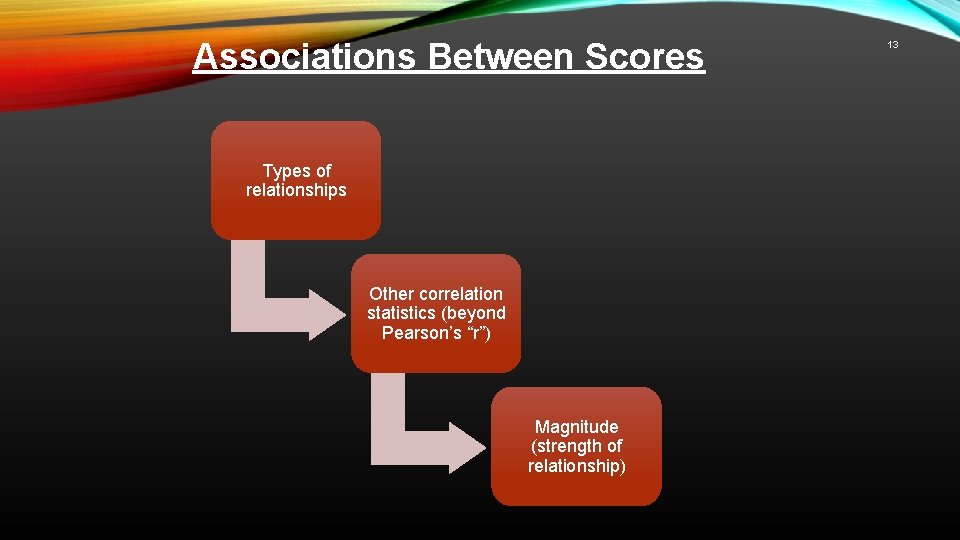
Associations Between Scores Types of relationships Other correlation statistics (beyond Pearson’s “r”) Magnitude (strength of relationship) 13
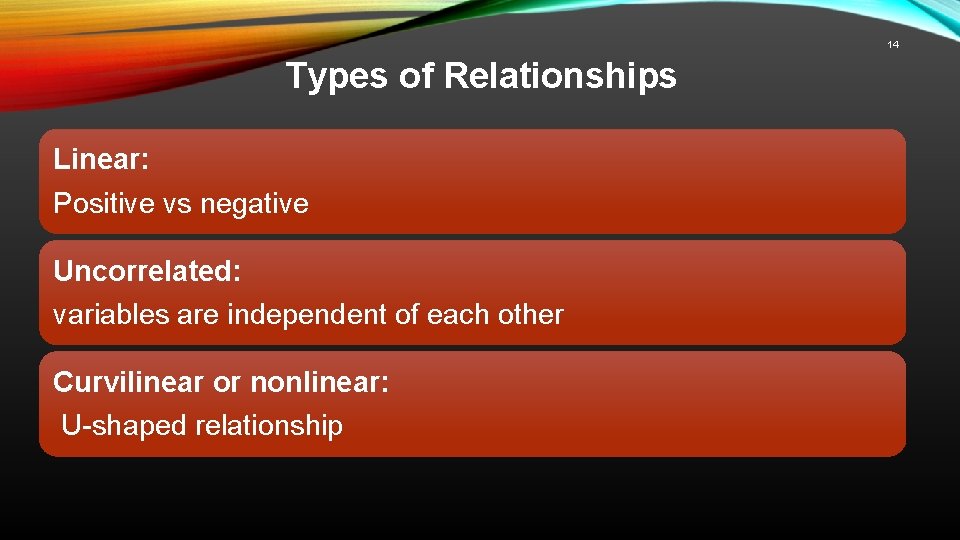
14 Types of Relationships Linear: Positive vs negative Uncorrelated: variables are independent of each other Curvilinear or nonlinear: U-shaped relationship
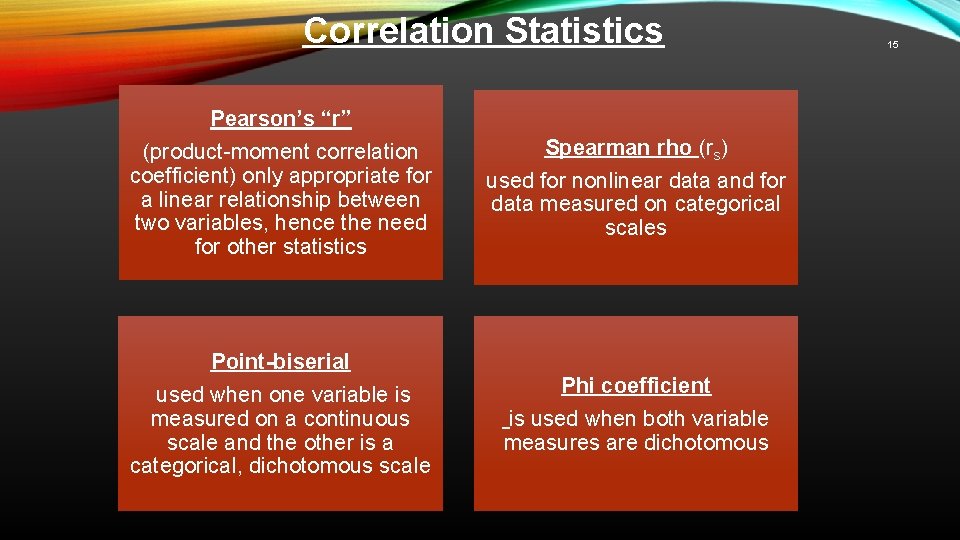
Correlation Statistics Pearson’s “r” (product-moment correlation coefficient) only appropriate for a linear relationship between two variables, hence the need for other statistics Point-biserial used when one variable is measured on a continuous scale and the other is a categorical, dichotomous scale Spearman rho (rs) used for nonlinear data and for data measured on categorical scales Phi coefficient is used when both variable measures are dichotomous 15
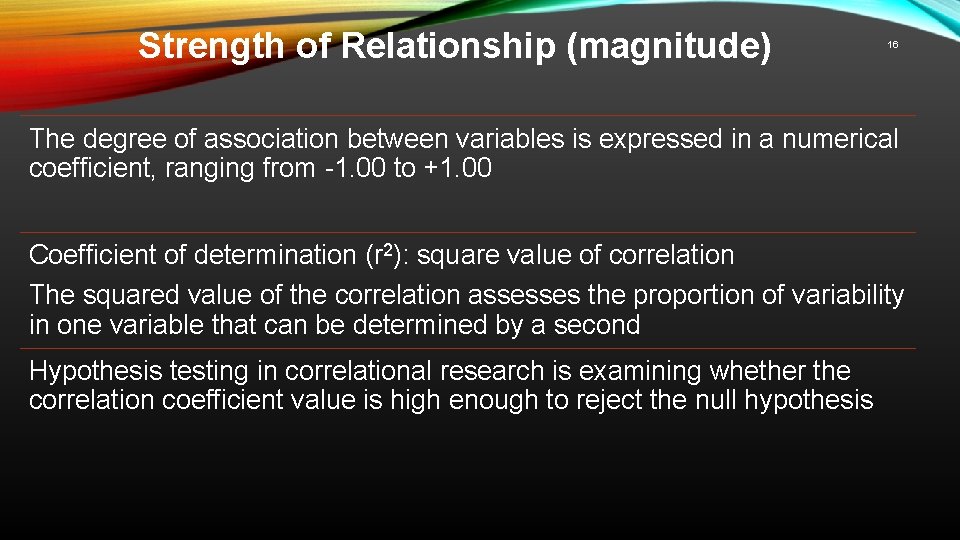
Strength of Relationship (magnitude) 16 The degree of association between variables is expressed in a numerical coefficient, ranging from -1. 00 to +1. 00 Coefficient of determination (r 2): square value of correlation The squared value of the correlation assesses the proportion of variability in one variable that can be determined by a second Hypothesis testing in correlational research is examining whether the correlation coefficient value is high enough to reject the null hypothesis
Multiple Variable Analysis ØCorrelations can have more than one predictor variable ØAccount for the impact of each variable ØPartial Correlations ØMultiple Regression 17
Partial Correlations v. An association between two variables by controlling the effects of a third variable v. Intervening variable (influences both the DV and IV) v. Determine shared variance between the DV and IV —> Shared variance or r squared 18
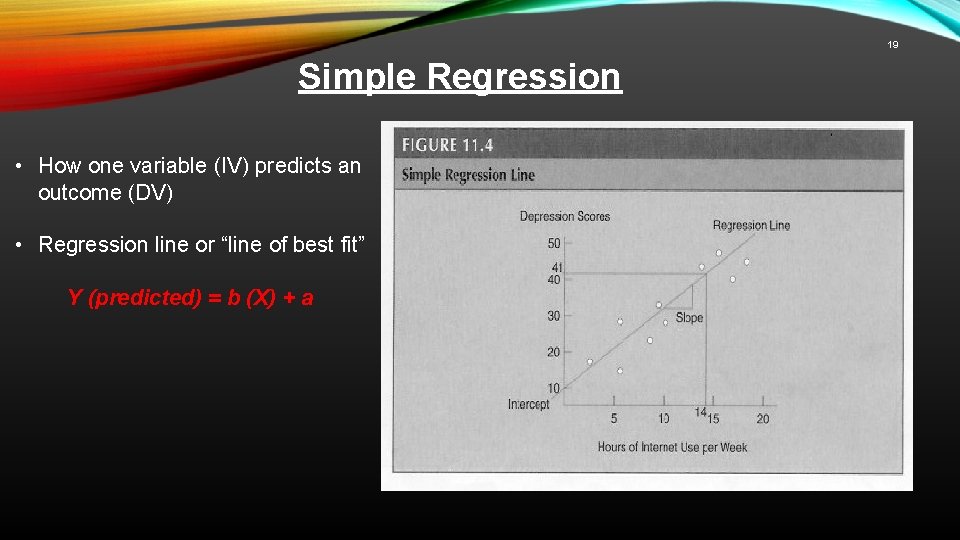
19 Simple Regression • How one variable (IV) predicts an outcome (DV) • Regression line or “line of best fit” Y (predicted) = b (X) + a
Multiple Regression 20 • How multiple variables (IV) combine to correlate with an outcome variable (DV) Y (predicted) = b 1 (X 1) + b 2 (X 2) + a • Regression table: Useful for selecting variables and evaluating their importance • Beta weight: Magnitude how each variable contributes to the outcome variable by controlling the effects all other predictor variables
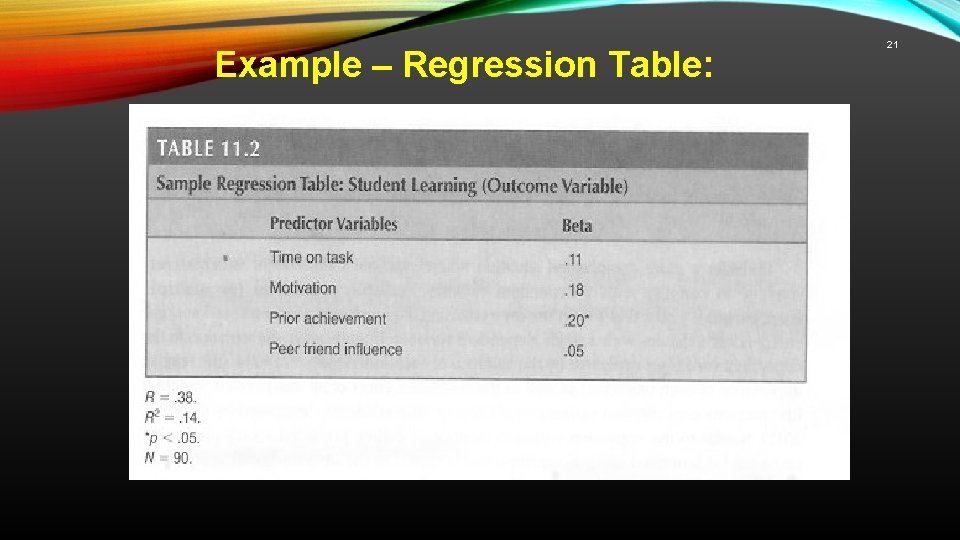
Example – Regression Table: 21
Meta-Analysis Ø Quantitative analysis of studies with a similar topic Ø Coined by Gene Glass (1976) to synthesize the growing literature of research Ø Needed to find a way to compare and understand results of similar studies Ø Effect sizes (magnitude of differences) allow us to make comparisons Ø Pearon’s r, Cohen’s d 22
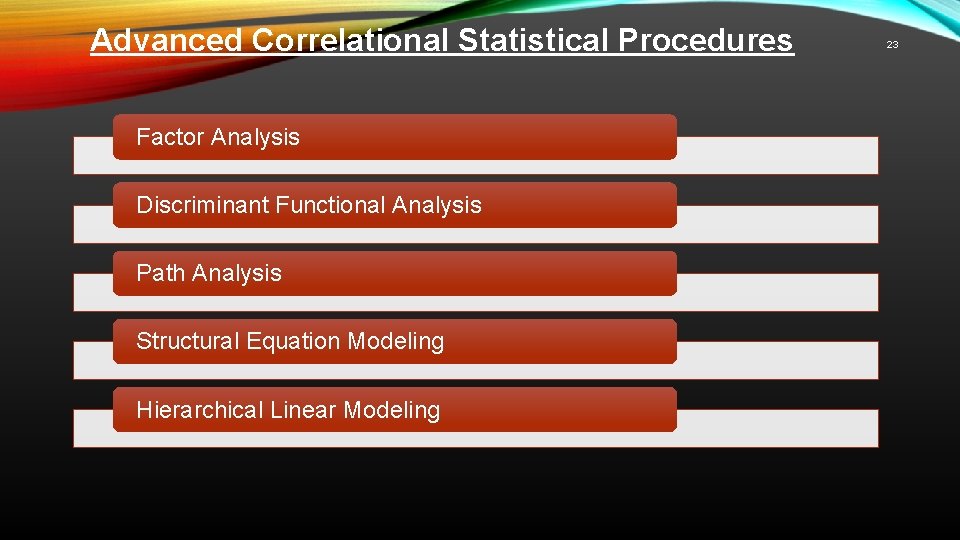
Advanced Correlational Statistical Procedures Factor Analysis Discriminant Functional Analysis Path Analysis Structural Equation Modeling Hierarchical Linear Modeling 23
Factor Analysis 24 A multivariate technique for identifying whether variables are moderately or highly correlated § Highly correlated variables can then be combined into one variable i. e. peer friend influence, best friend influence & family influence close proximity influence
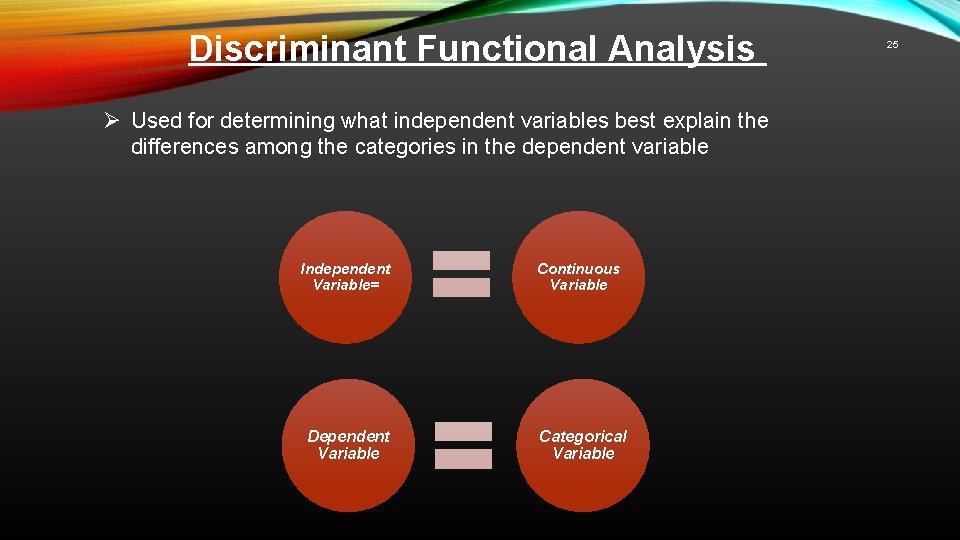
Discriminant Functional Analysis Ø Used for determining what independent variables best explain the differences among the categories in the dependent variable Independent Variable= Continuous Variable Dependent Variable Categorical Variable 25
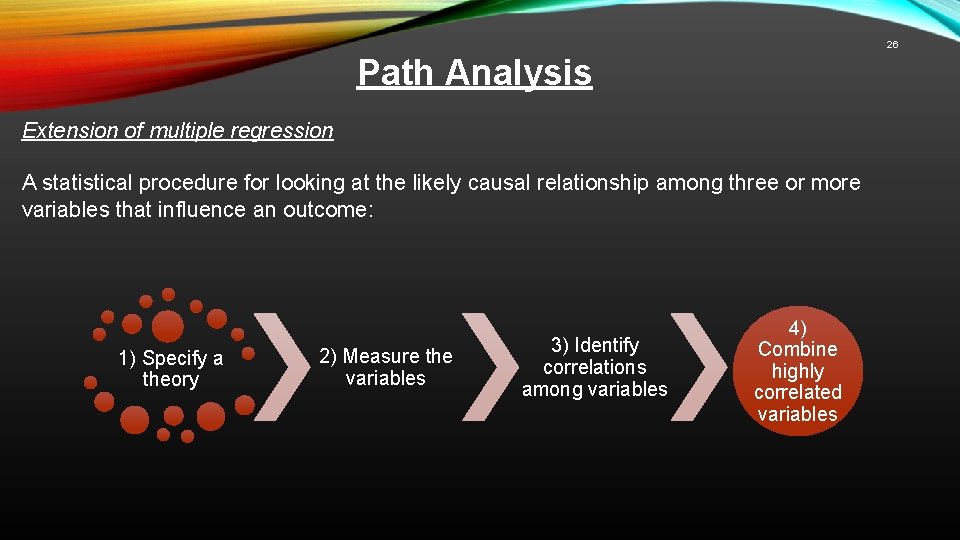
26 Path Analysis Extension of multiple regression A statistical procedure for looking at the likely causal relationship among three or more variables that influence an outcome: 1) Specify a theory 2) Measure the variables 3) Identify correlations among variables 4) Combine highly correlated variables
Structural Equation Modeling 27 v. SEM provides information about which variables influence each other and the direction of these effects v. Confirmatory procedure v. Two classes of variables: Observed & latent v. Observed variables (extrovert behavior): Measured by continuous scores from collected data v. Latent variables (socialization): hypothetical constructs that are not directly observed v. This ability to analyze both observed variables and latent variables distinguishes SEM from analysis of variance and multiple regression
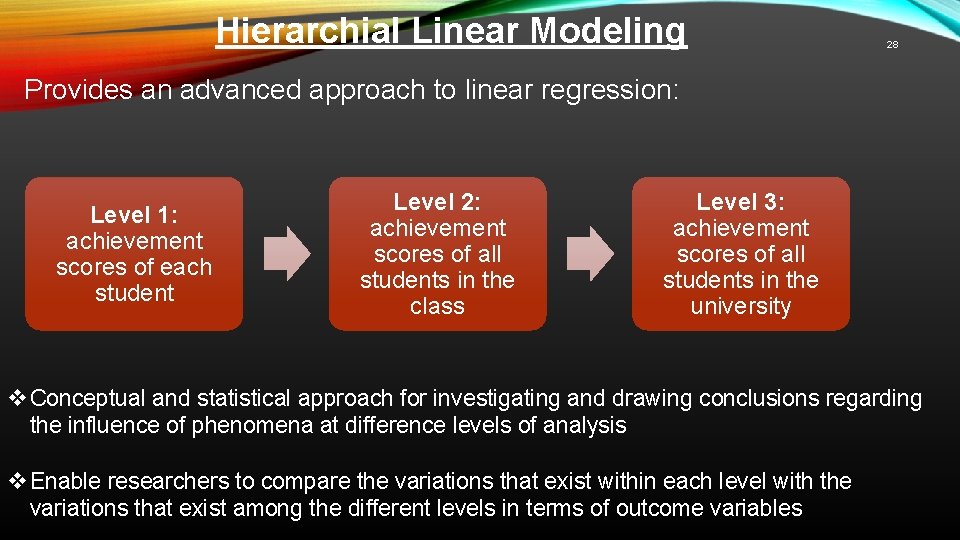
Hierarchial Linear Modeling 28 Provides an advanced approach to linear regression: Level 1: achievement scores of each student Level 2: achievement scores of all students in the class Level 3: achievement scores of all students in the university v Conceptual and statistical approach for investigating and drawing conclusions regarding the influence of phenomena at difference levels of analysis v Enable researchers to compare the variations that exist within each level with the variations that exist among the different levels in terms of outcome variables
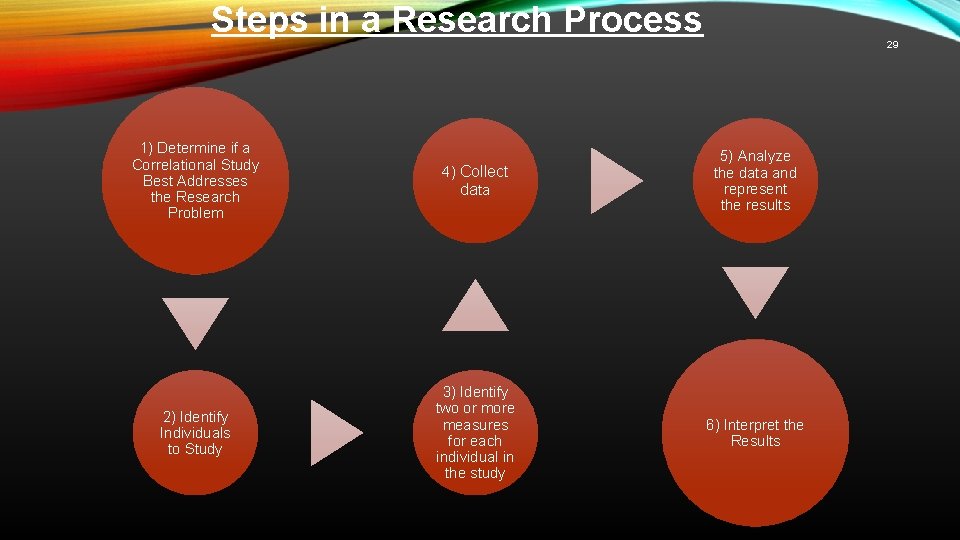
Steps in a Research Process 29 1) Determine if a Correlational Study Best Addresses the Research Problem 4) Collect data 5) Analyze the data and represent the results 2) Identify Individuals to Study 3) Identify two or more measures for each individual in the study 6) Interpret the Results
Method Participants • 252 participants • Age range: 14 to 65 years (58. 73% females; M =33. 47; SD =16. 98) • Age groups: 14 -18, 19 -25, 26 -45, and 46 -65 years. 30
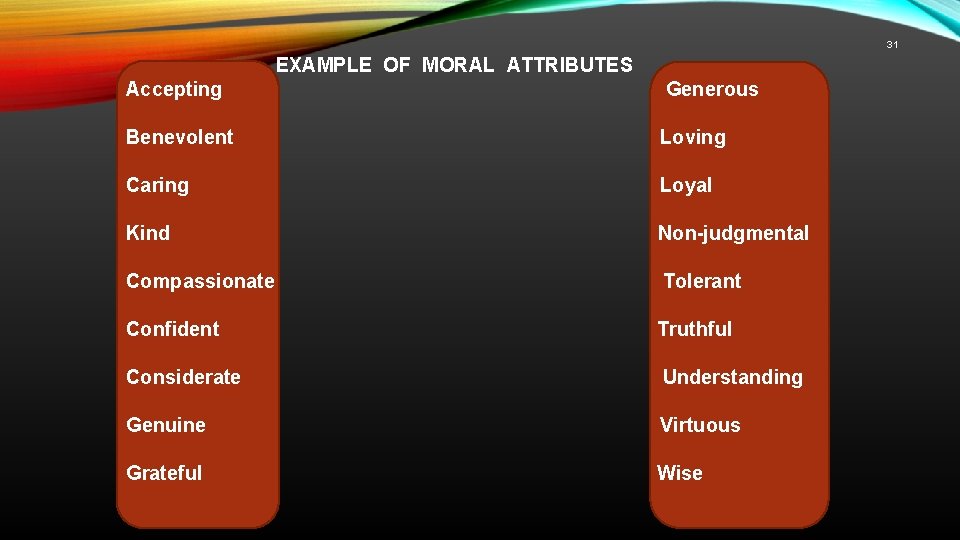
31 EXAMPLE OF MORAL ATTRIBUTES Accepting Generous Benevolent Loving Caring Loyal Kind Non-judgmental Compassionate Tolerant Confident Truthful Considerate Understanding Genuine Virtuous Grateful Wise
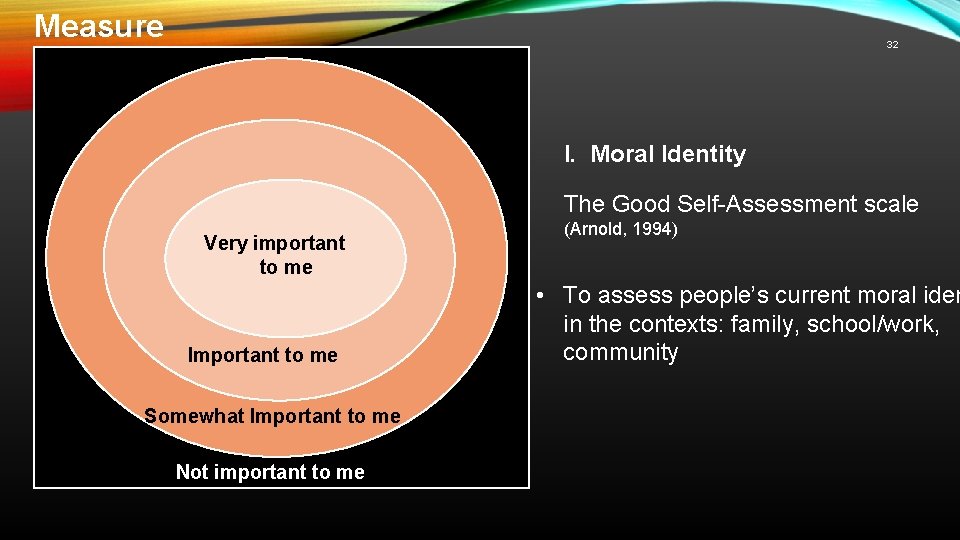
Measure 32 l. Moral Identity The Good Self-Assessment scale Very important to me Important to me Somewhat Important to me Not important to me (Arnold, 1994) • To assess people’s current moral iden in the contexts: family, school/work, community
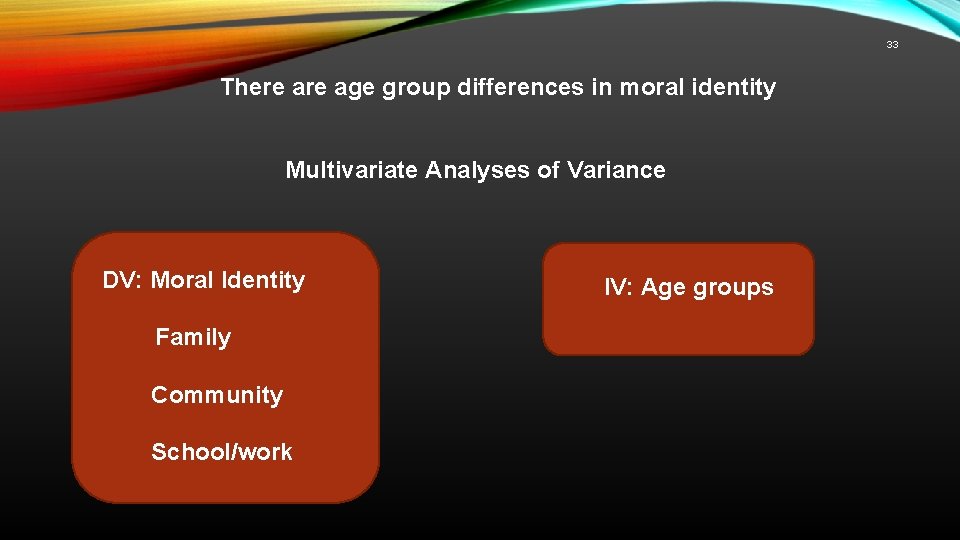
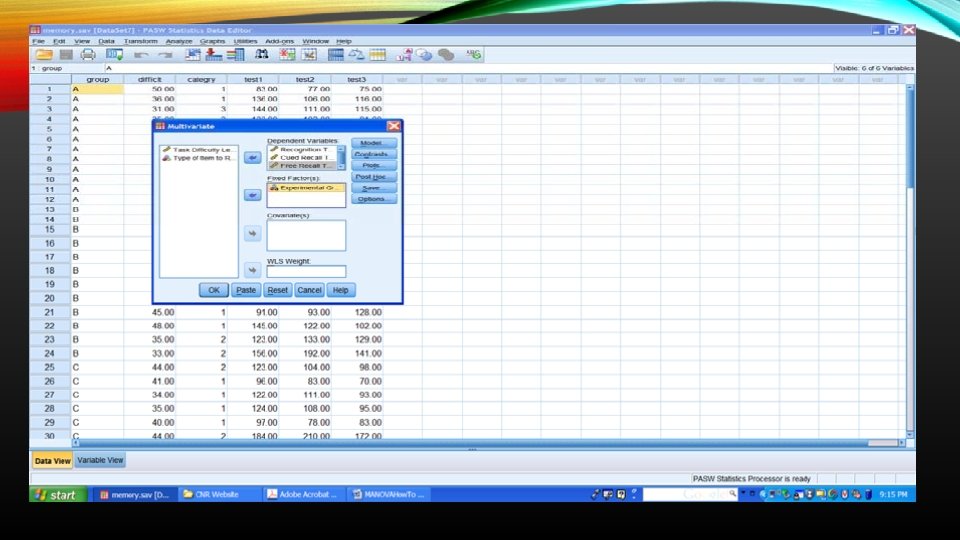
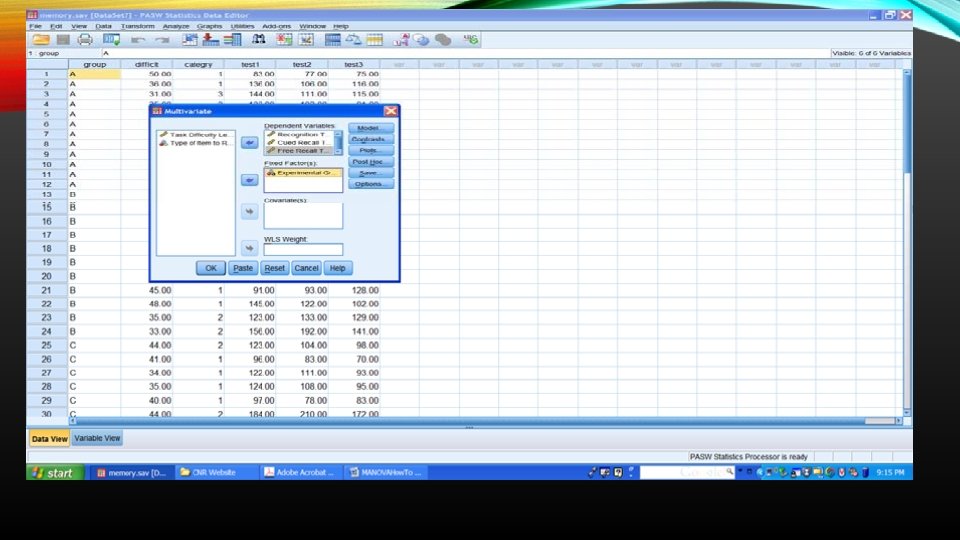
33 There age group differences in moral identity Multivariate Analyses of Variance DV: Moral Identity Family Community School/work IV: Age groups
34
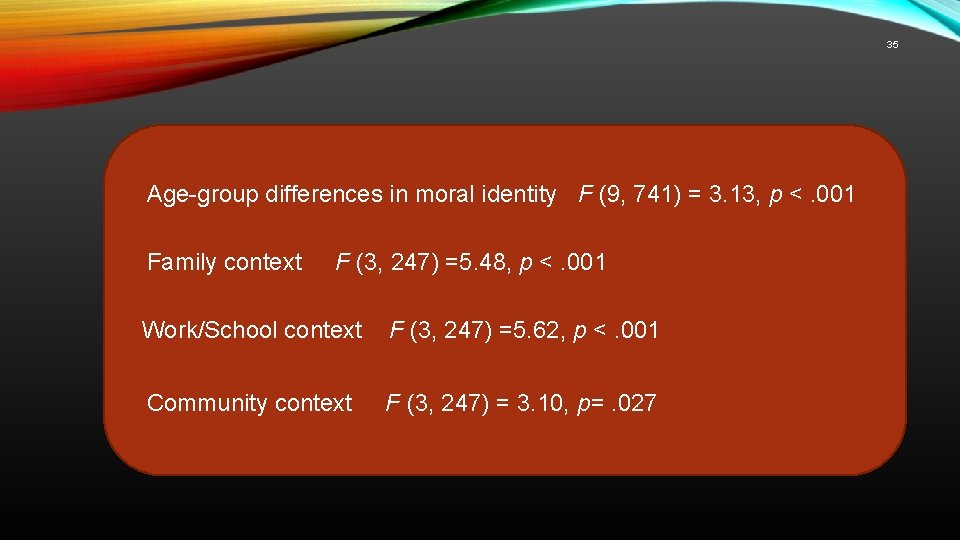
35 Age-group differences in moral identity F (9, 741) = 3. 13, p <. 001 Family context F (3, 247) =5. 48, p <. 001 Work/School context F (3, 247) =5. 62, p <. 001 Community context F (3, 247) = 3. 10, p=. 027
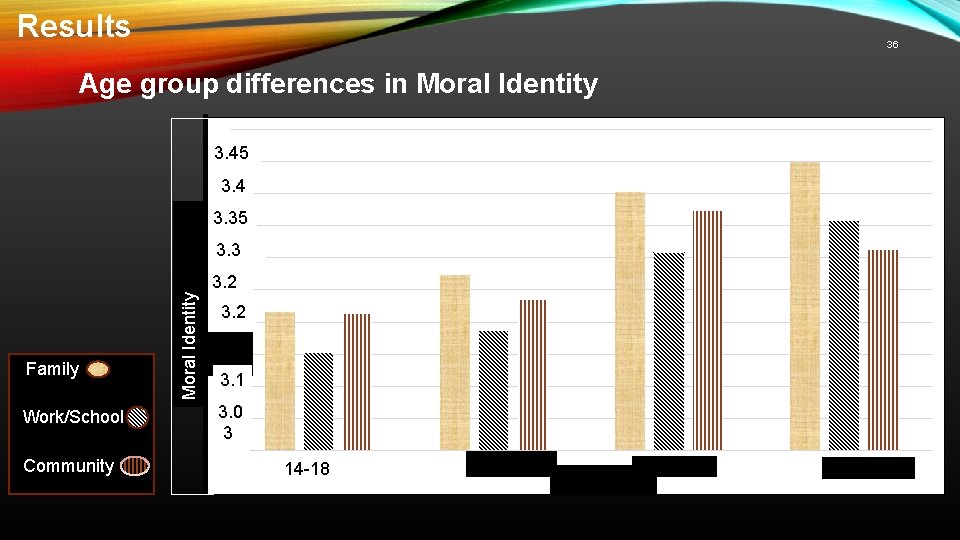
Results 36 Age group differences in Moral Identity 3. 45 3. 4 3. 35 Family Work/School Community Moral Identity 3. 3 3. 2 53. 2 3. 1 3. 0 33 14 -18 19 -25 26 -45 Age Groups Age 26 - 46 -65
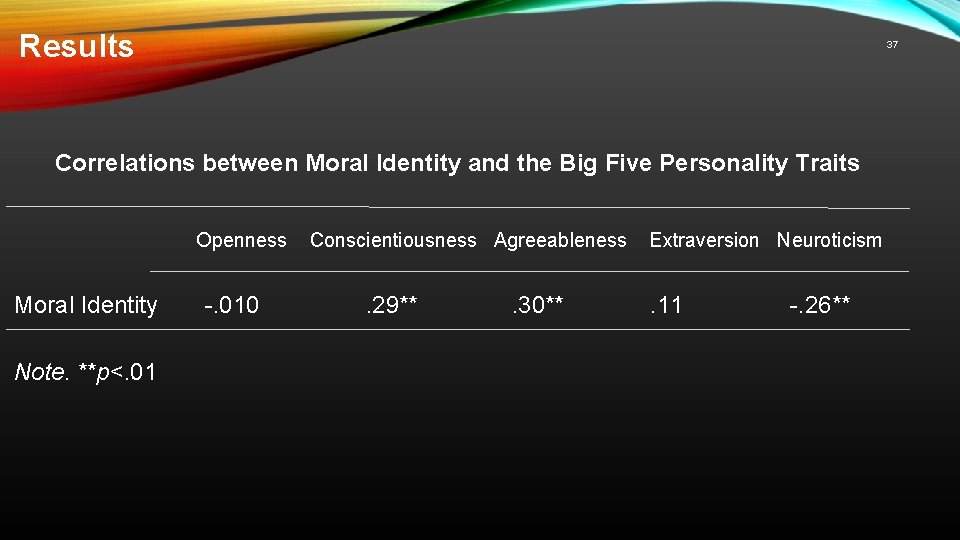
Results 37 Correlations between Moral Identity and the Big Five Personality Traits Openness Moral Identity Note. **p<. 01 -. 010 Conscientiousness Agreeableness . 29** . 30** Extraversion Neuroticism . 11 -. 26**
38
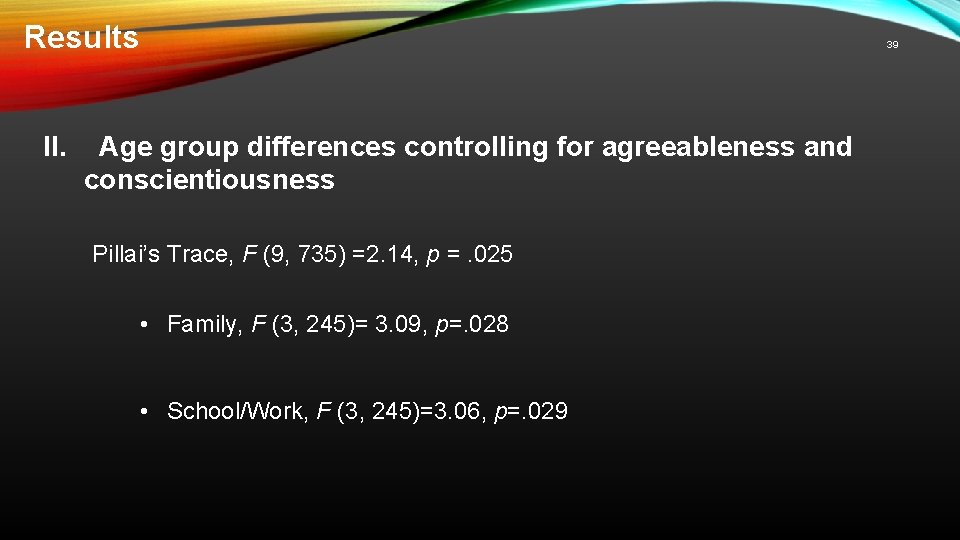
Results ll. Age group differences controlling for agreeableness and conscientiousness Pillai’s Trace, F (9, 735) =2. 14, p =. 025 • Family, F (3, 245)= 3. 09, p=. 028 • School/Work, F (3, 245)=3. 06, p=. 029 39
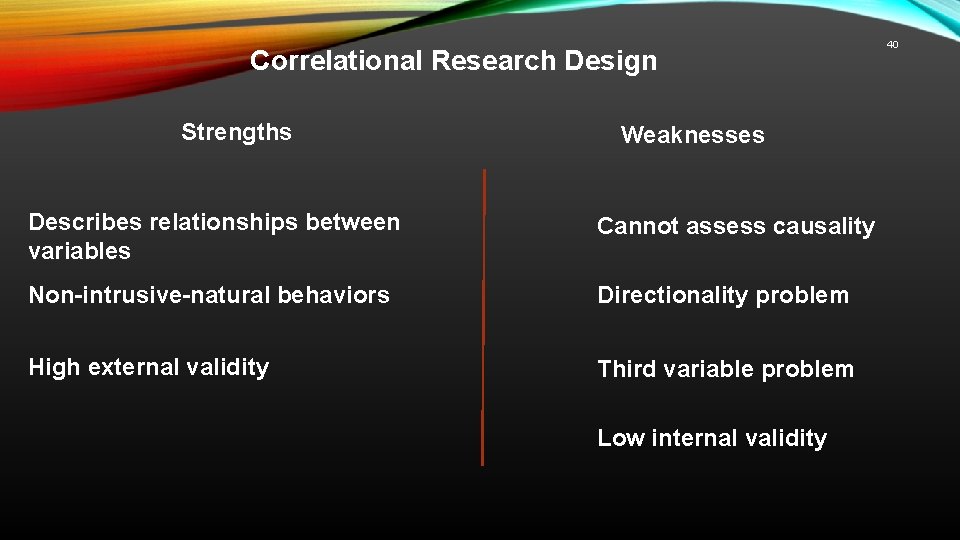
Correlational Research Design Strengths Weaknesses Describes relationships between variables Cannot assess causality Non-intrusive-natural behaviors Directionality problem High external validity Third variable problem Low internal validity 40
41 Funny Correlations http: //www. tylervigen. com/spurious-correlations http: //twentytwowords. com/funny-graphs-show-correlation-between-completely-unrelated-stats 9 -pictures/ http: //www. buzzfeed. com/kjh 2110/the-10 -most-bizarre-correlations#. vfba 1 RVk. G
42 Presented by: Victoria Martindale Dana Takkale Lourdes Murua Sierra Pecsi Liane Kupfert
- Slides: 42