
1 CO 1 Ability to describe compare and
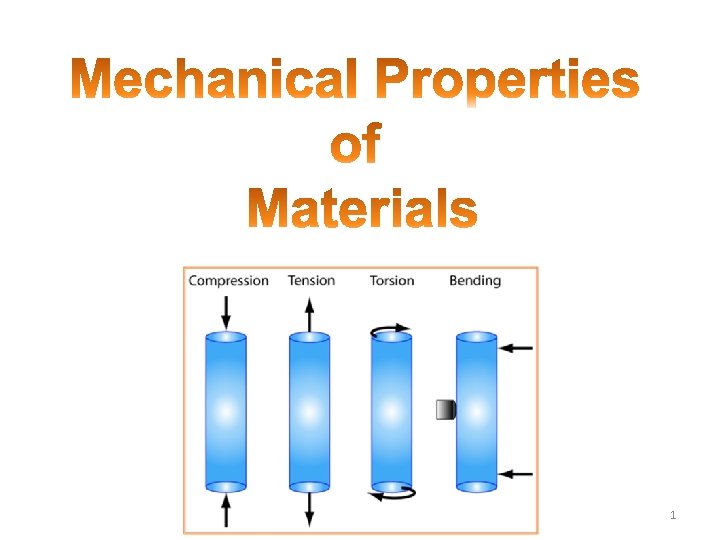
1
CO 1: Ability to describe, compare and analyze problems related to engineering materials including mechanical, electrical and magnetic properties.
(2. 1) Stress and Strain in Metals • • Elastic Deformation & Plastic Deformation Engineering Stress & Engineering Strain Poisson’s Ratio Shear Stress & Shear Strain
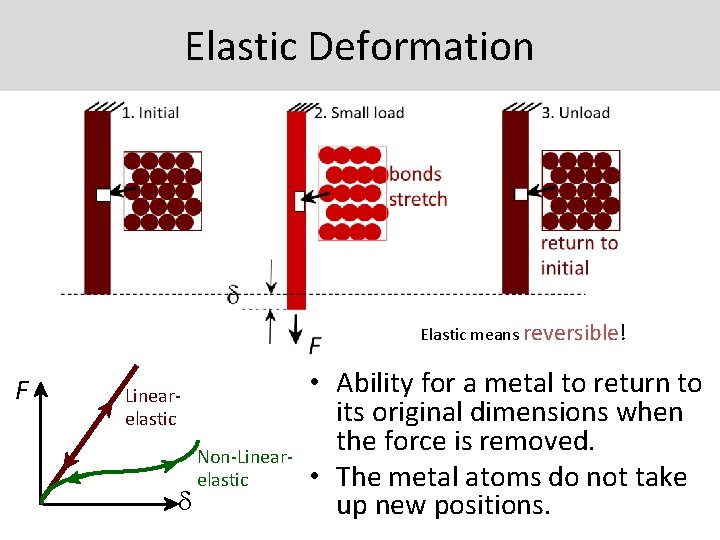
Elastic Deformation Elastic means reversible! F Linear- elastic d Non-Linearelastic • Ability for a metal to return to its original dimensions when the force is removed. • The metal atoms do not take up new positions.
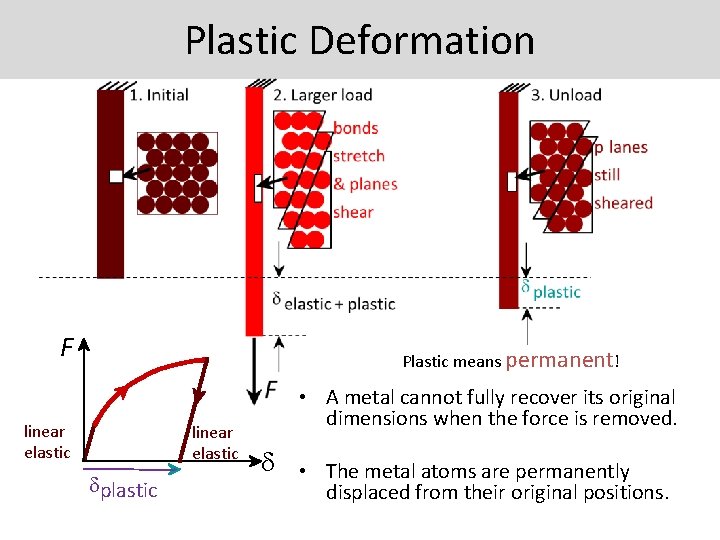
Plastic Deformation F Plastic means permanent! linear elastic dplastic • A metal cannot fully recover its original dimensions when the force is removed. d • The metal atoms are permanently displaced from their original positions.
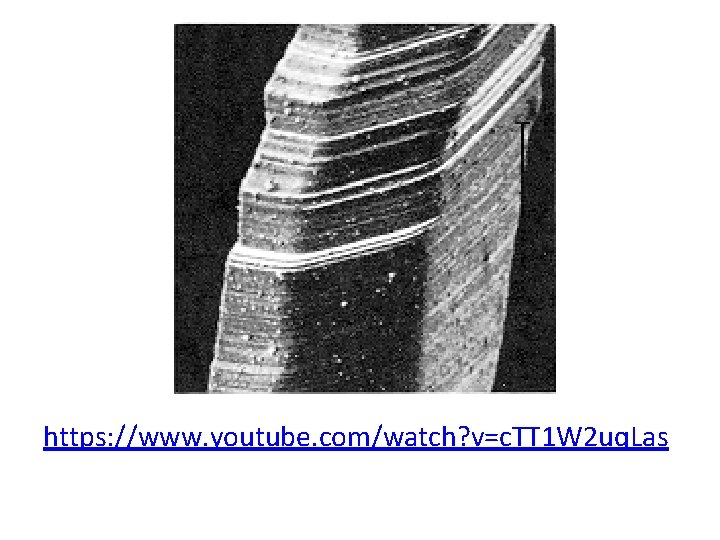
https: //www. youtube. com/watch? v=c. TT 1 W 2 uq. Las
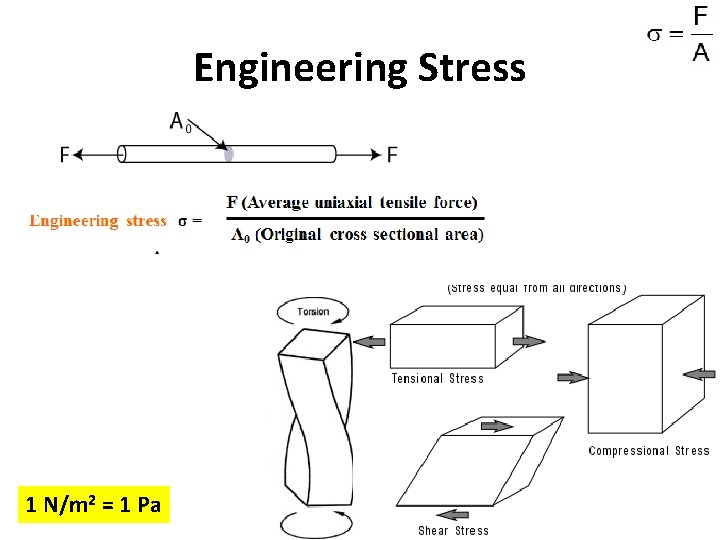
Engineering Stress 1 N/m 2 = 1 Pa
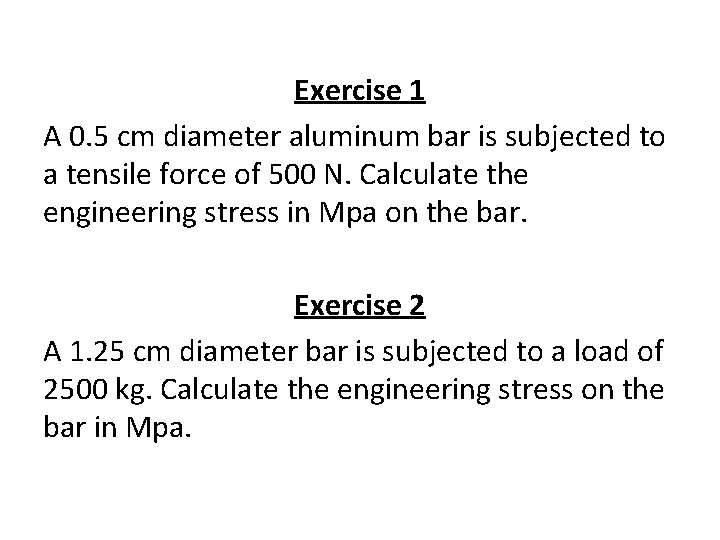
Exercise 1 A 0. 5 cm diameter aluminum bar is subjected to a tensile force of 500 N. Calculate the engineering stress in Mpa on the bar. Exercise 2 A 1. 25 cm diameter bar is subjected to a load of 2500 kg. Calculate the engineering stress on the bar in Mpa.
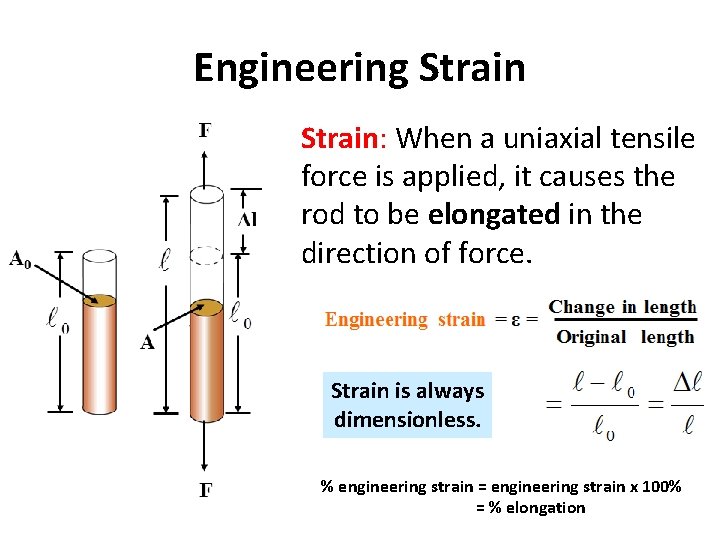
Engineering Strain: When a uniaxial tensile force is applied, it causes the rod to be elongated in the direction of force. Strain is always dimensionless. % engineering strain = engineering strain x 100% = % elongation
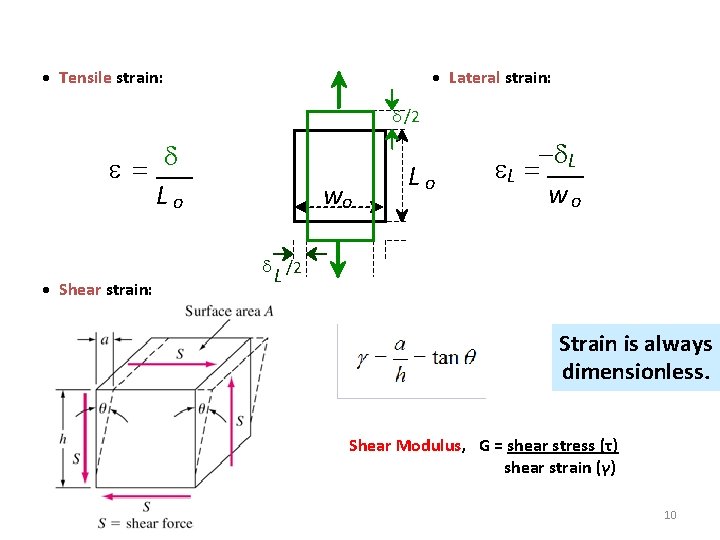
• Tensile strain: • Lateral strain: d /2 = d Lo wo Lo -d. L L = wo d /2 • Shear strain: L q Strain is always dimensionless. x 90º - q y 90º Shear Modulus, G = shear stress (τ) shear strain (γ) 10
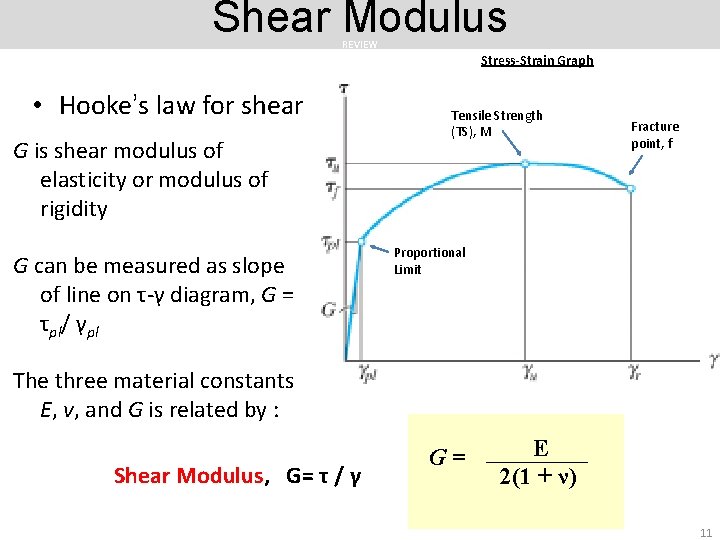
Shear Modulus REVIEW Stress-Strain Graph • Hooke’s law for shear G is shear modulus of elasticity or modulus of rigidity G can be measured as slope of line on τ-γ diagram, G = τpl/ γpl Tensile Strength (TS), M Fracture point, f Proportional Limit The three material constants E, ν, and G is related by : Shear Modulus, G= τ / γ G= E 2(1 + ν) 11
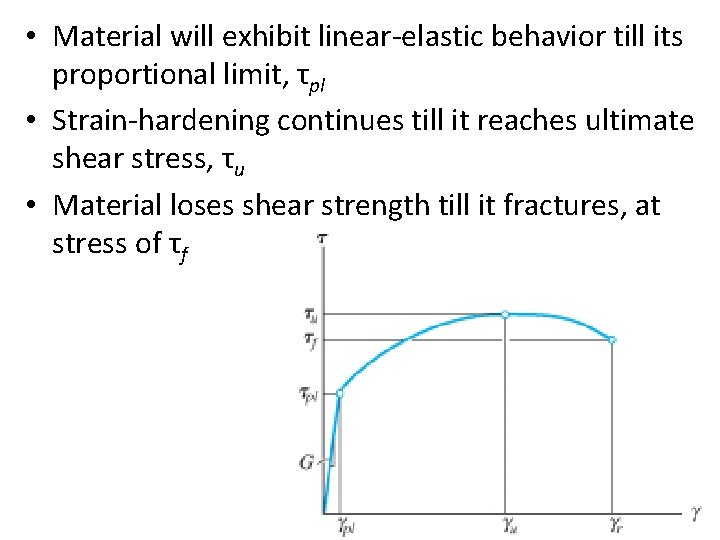
• Material will exhibit linear-elastic behavior till its proportional limit, τpl • Strain-hardening continues till it reaches ultimate shear stress, τu • Material loses shear strength till it fractures, at stress of τf

Poisson’s Ratio • When body subjected to axial tensile force, it elongates and contracts laterally. • when subjected to an axial compressive force, it will contract and its sides expand laterally. 13
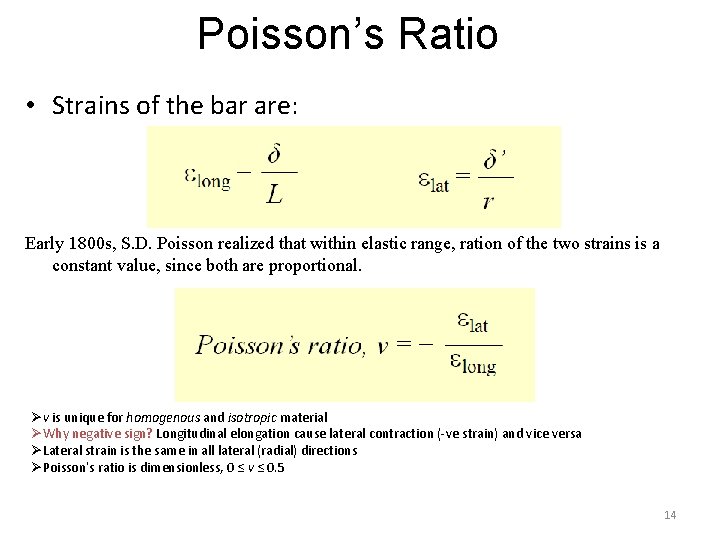
Poisson’s Ratio • Strains of the bar are: Early 1800 s, S. D. Poisson realized that within elastic range, ration of the two strains is a constant value, since both are proportional. Øν is unique for homogenous and isotropic material ØWhy negative sign? Longitudinal elongation cause lateral contraction (-ve strain) and vice versa ØLateral strain is the same in all lateral (radial) directions ØPoisson’s ratio is dimensionless, 0 ≤ ν ≤ 0. 5 14
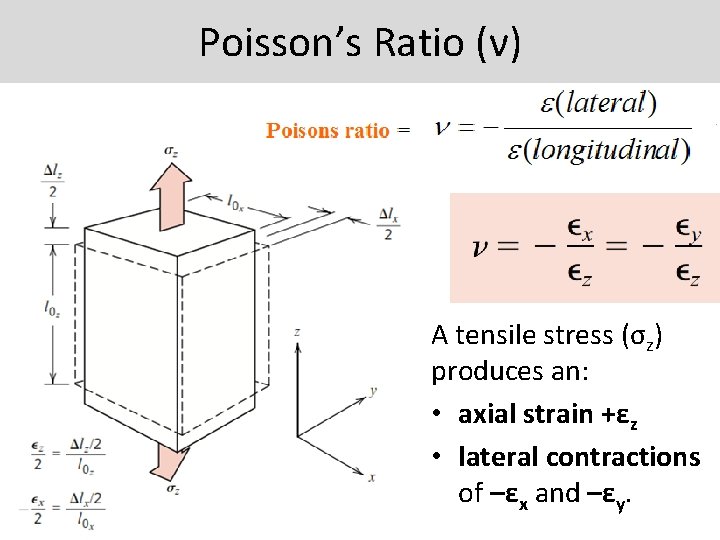
Poisson’s Ratio (ν) A tensile stress (σz) produces an: • axial strain +εz • lateral contractions of –εx and –εy.
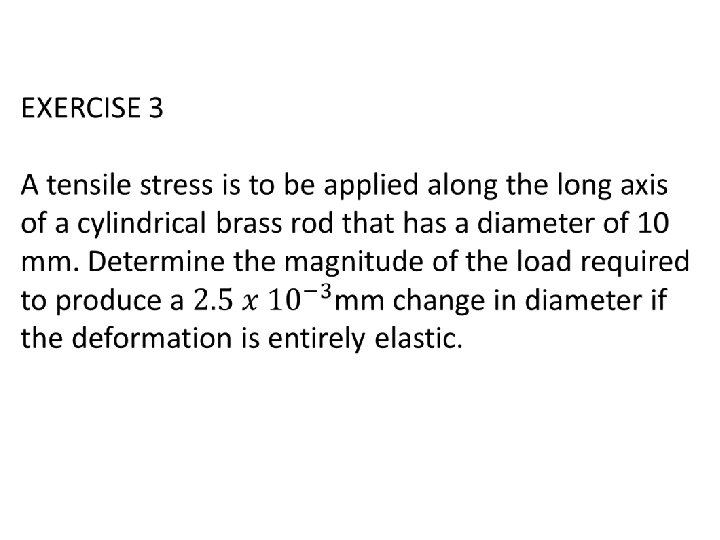
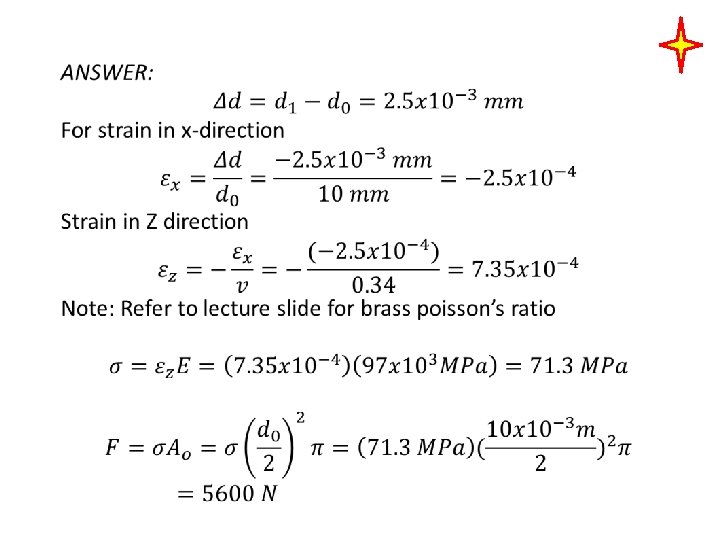
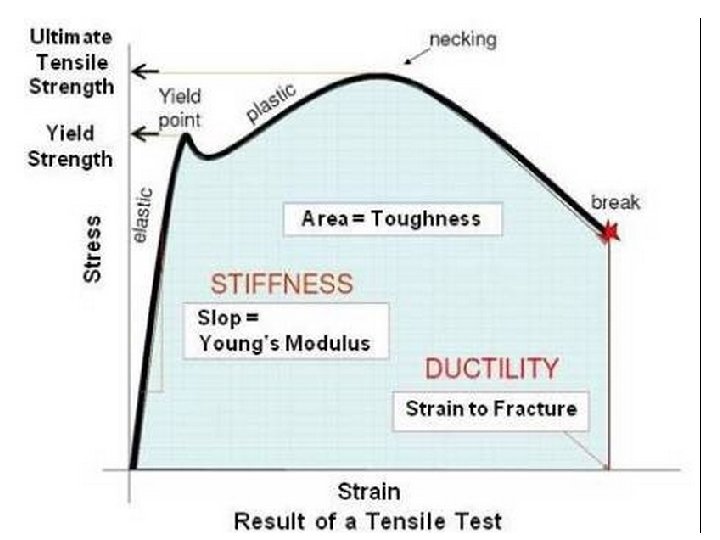
(2. 2) The Tensile Test & Engineering Stress -Strain Diagram • Engineering Stress-Strain Diagram • Modulus of Elasticity • Yield Strength • Tensile Strength • Ductility # Percent elongation at fracture # Percent reduction in area at fracture
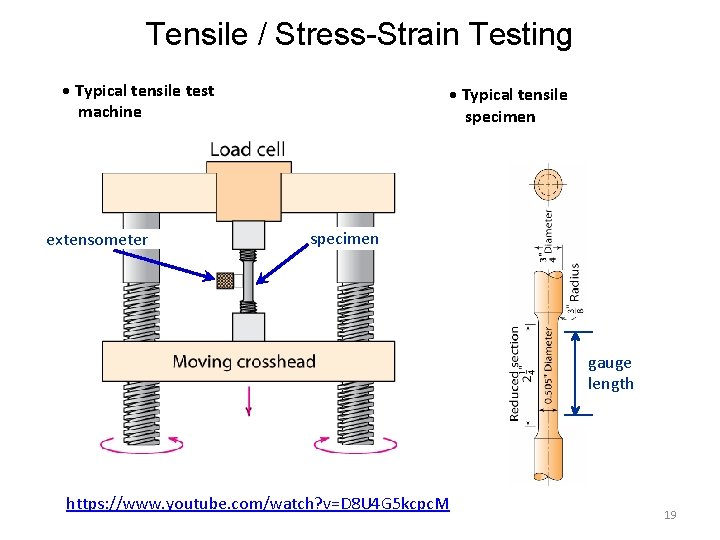
Tensile / Stress-Strain Testing • Typical tensile test machine extensometer • Typical tensile specimen gauge length https: //www. youtube. com/watch? v=D 8 U 4 G 5 kcpc. M 19

https: //www. youtube. com/watch? v=c. TT 1 W 2 uq. Las
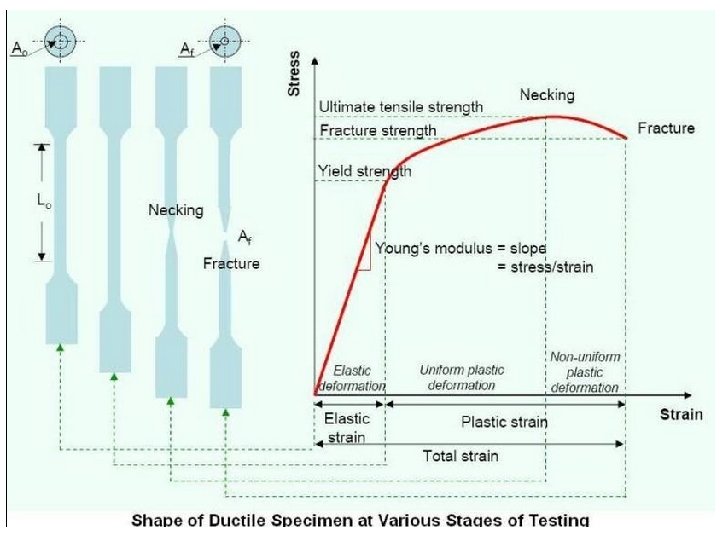
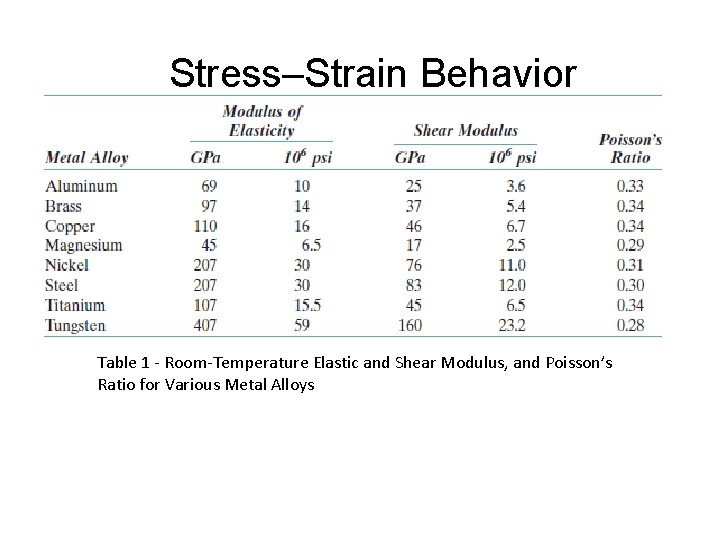
Stress–Strain Behavior Table 1 - Room-Temperature Elastic and Shear Modulus, and Poisson’s Ratio for Various Metal Alloys
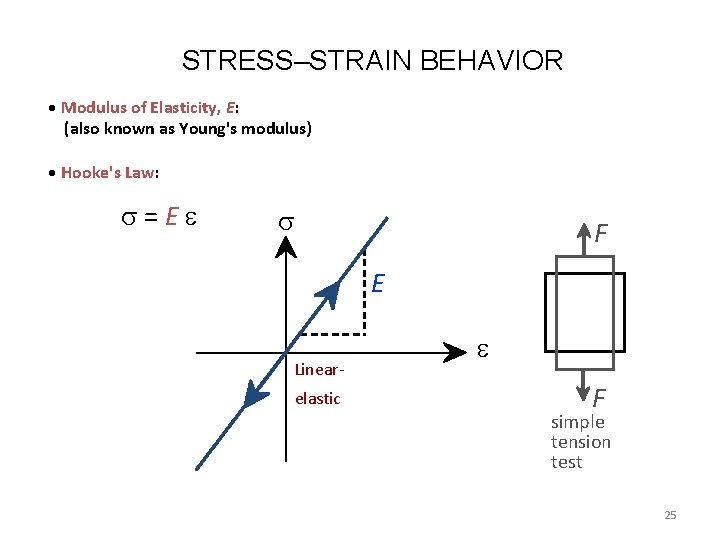
STRESS–STRAIN BEHAVIOR • Modulus of Elasticity, E: (also known as Young's modulus) • Hooke's Law: = E F E Linear- elastic F simple tension test 25
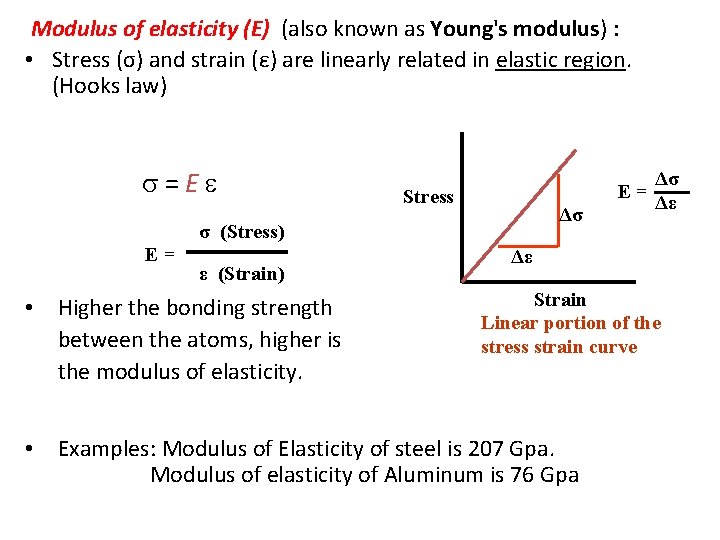
Modulus of elasticity (E) (also known as Young's modulus) : • Stress (σ) and strain (ε) are linearly related in elastic region. (Hooks law) = E E= Stress Δσ σ (Stress) E= ε (Strain) • Higher the bonding strength between the atoms, higher is the modulus of elasticity. Δσ Δε Δε Strain Linear portion of the stress strain curve • Examples: Modulus of Elasticity of steel is 207 Gpa. Modulus of elasticity of Aluminum is 76 Gpa
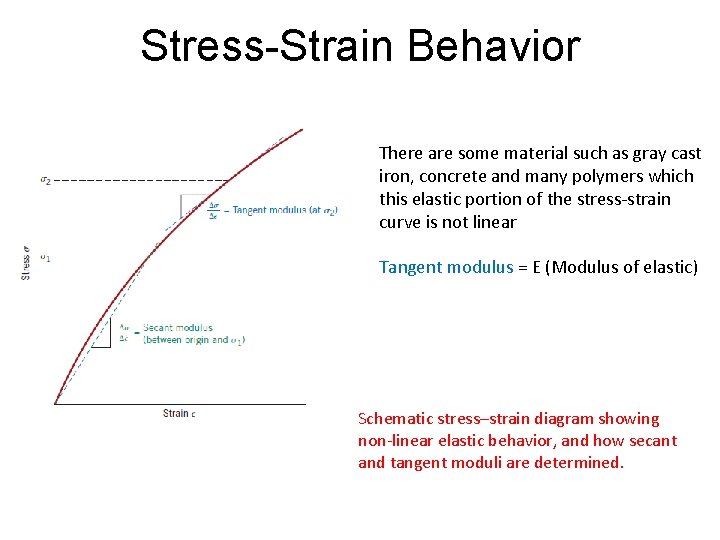
Stress-Strain Behavior There are some material such as gray cast iron, concrete and many polymers which this elastic portion of the stress-strain curve is not linear Tangent modulus = E (Modulus of elastic) Schematic stress–strain diagram showing non-linear elastic behavior, and how secant and tangent moduli are determined.
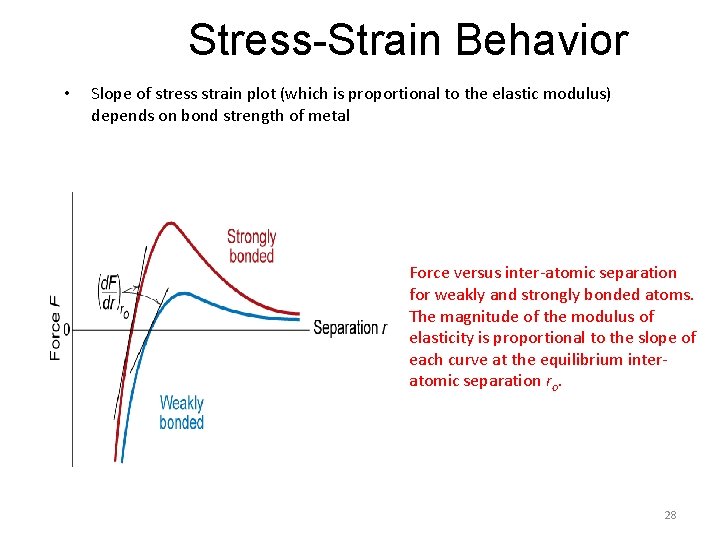
Stress-Strain Behavior • Slope of stress strain plot (which is proportional to the elastic modulus) depends on bond strength of metal Force versus inter-atomic separation for weakly and strongly bonded atoms. The magnitude of the modulus of elasticity is proportional to the slope of each curve at the equilibrium interatomic separation ro. 28
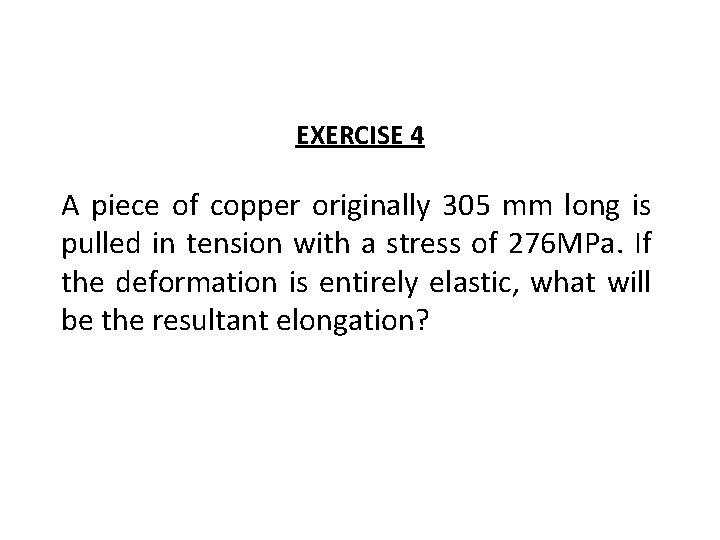
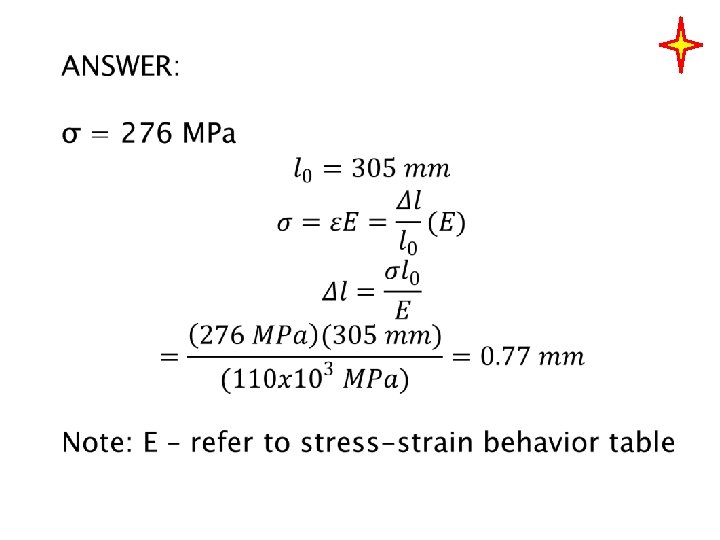
EXERCISE 4 A piece of copper originally 305 mm long is pulled in tension with a stress of 276 MPa. If the deformation is entirely elastic, what will be the resultant elongation?
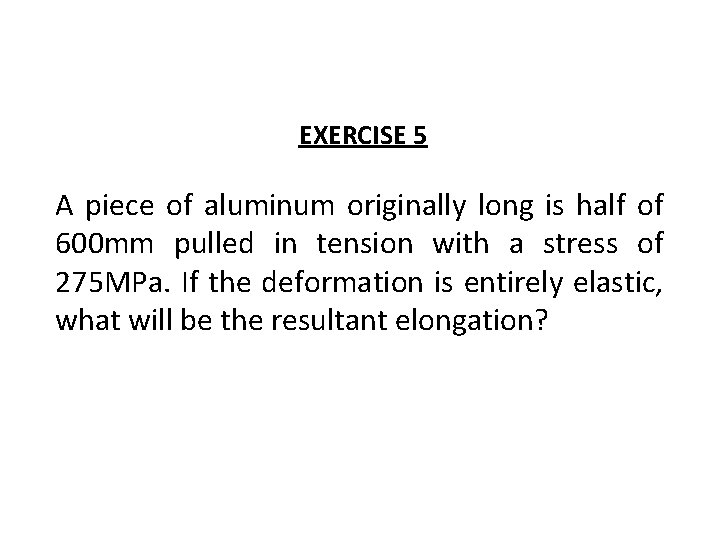
EXERCISE 5 A piece of aluminum originally long is half of 600 mm pulled in tension with a stress of 275 MPa. If the deformation is entirely elastic, what will be the resultant elongation? Ans: 1. 195 x 10 -3
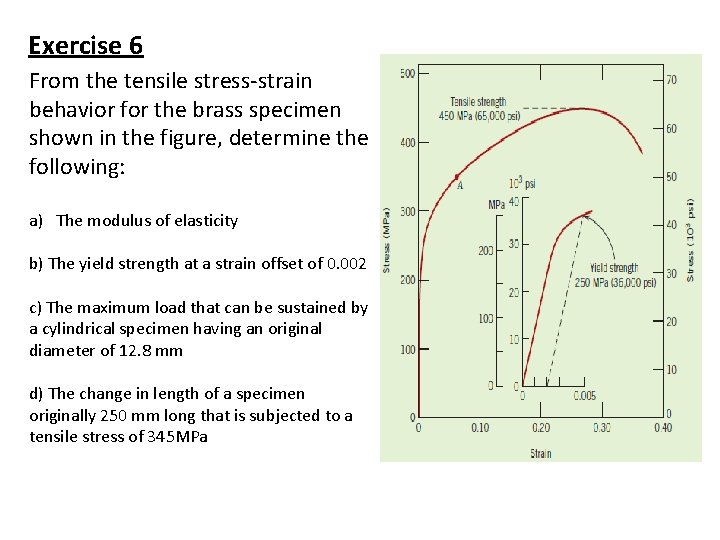
Exercise 6 From the tensile stress-strain behavior for the brass specimen shown in the figure, determine the following: a) The modulus of elasticity b) The yield strength at a strain offset of 0. 002 c) The maximum load that can be sustained by a cylindrical specimen having an original diameter of 12. 8 mm d) The change in length of a specimen originally 250 mm long that is subjected to a tensile stress of 345 MPa
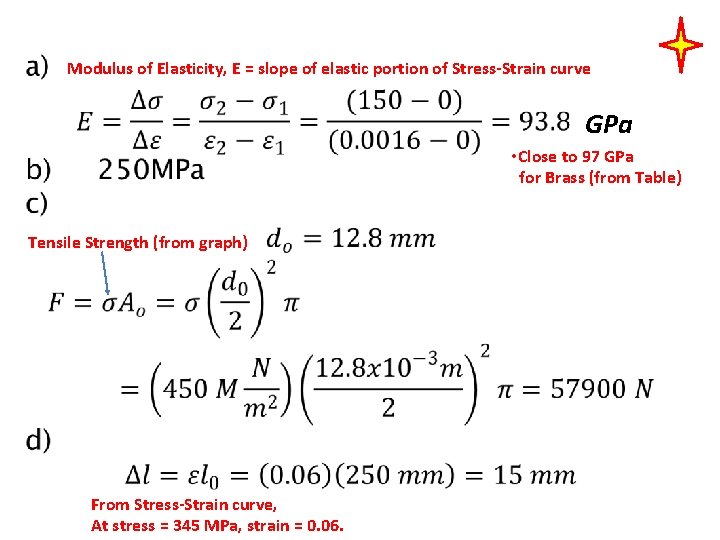
Modulus of Elasticity, E = slope of elastic portion of Stress-Strain curve GPa • Close to 97 GPa for Brass (from Table) Tensile Strength (from graph) From Stress-Strain curve, At stress = 345 MPa, strain = 0. 06.
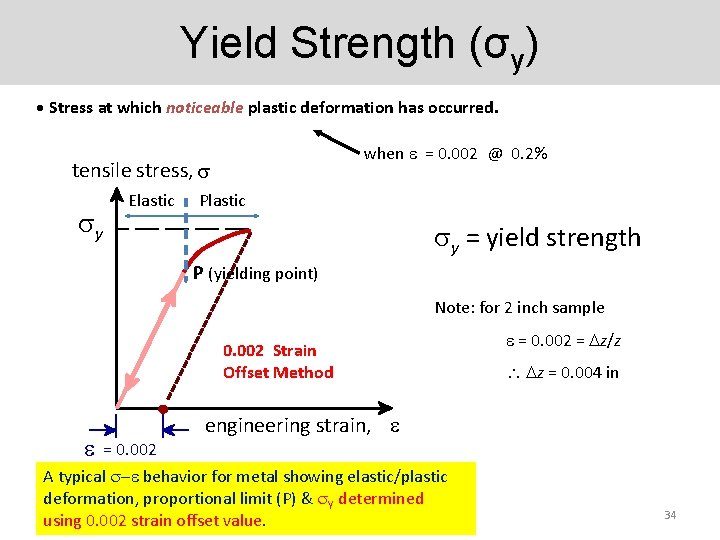
Yield Strength (σy) • Stress at which noticeable plastic deformation has occurred. when = 0. 002 @ 0. 2% tensile stress, y Elastic Plastic y = yield strength P (yielding point) Note: for 2 inch sample 0. 002 Strain Offset Method = 0. 002 = z/z z = 0. 004 in engineering strain, A typical - behavior for metal showing elastic/plastic deformation, proportional limit (P) & Y determined using 0. 002 strain offset value. 34
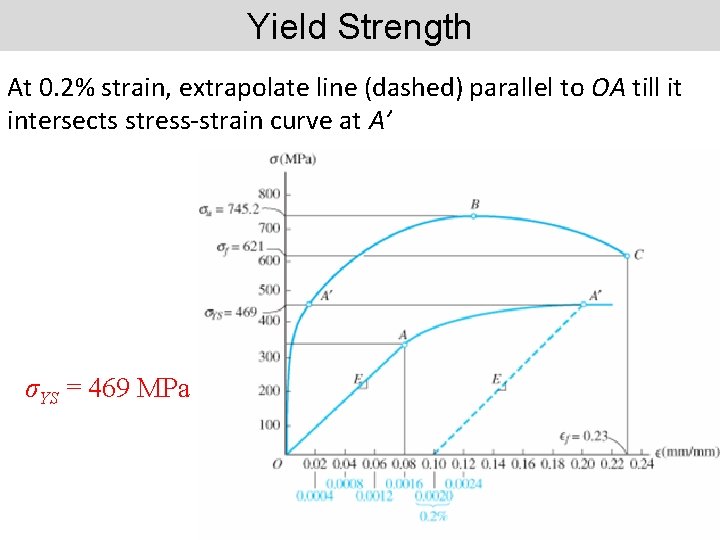
Yield Strength At 0. 2% strain, extrapolate line (dashed) parallel to OA till it intersects stress-strain curve at A’ σYS = 469 MPa 35
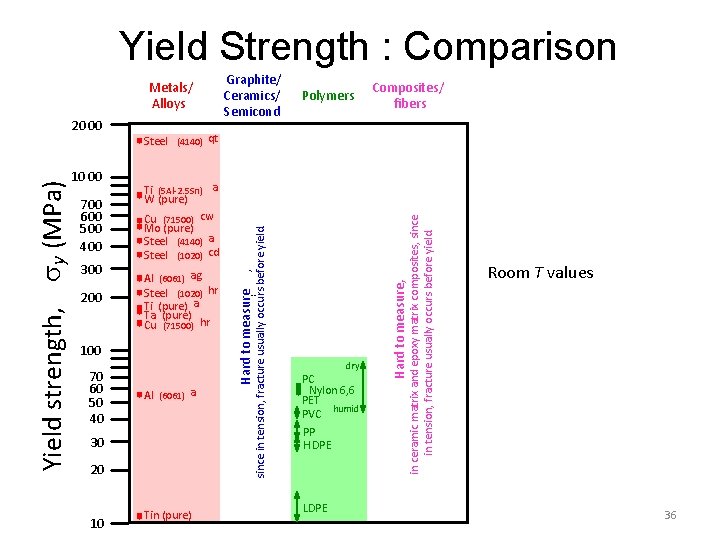
Yield Strength : Comparison Metals/ Alloys 200 Al (6061) ag Steel (1020) hr Ti (pure) a Ta (pure) Cu (71500) hr 100 70 60 50 40 Al (6061) a 30 20 10 Tin (pure) ¨ dry PC Nylon 6, 6 PET PVC humid PP H DPE LDPE in ceramic matrix and epoxy matrix composites, since in tension, fracture usually occurs before yield. 300 Composites/ fibers Hard to measure, 700 600 500 400 Ti (5 Al-2. 5 Sn) a W (pure) Cu (71500) cw Mo (pure) Steel (4140) a Steel (1020) cd , since in tension, fracture usually occurs before yield. 10 00 Polymers Steel (4140) qt Hard to measure Yield strength, y (MPa) 20 00 Graphite/ Ceramics/ Semicond Room T values 36
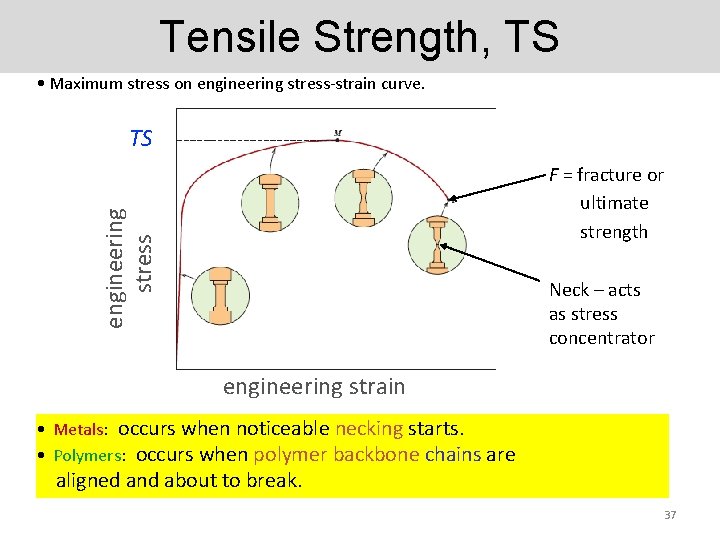
Tensile Strength, TS • Maximum stress on engineering stress-strain curve. TS F = fracture or ultimate strength engineering stress y Typical response of a metal Neck – acts as stress concentrator strain engineering strain • Metals: occurs when noticeable necking starts. • Polymers: occurs when polymer backbone chains are aligned and about to break. 37
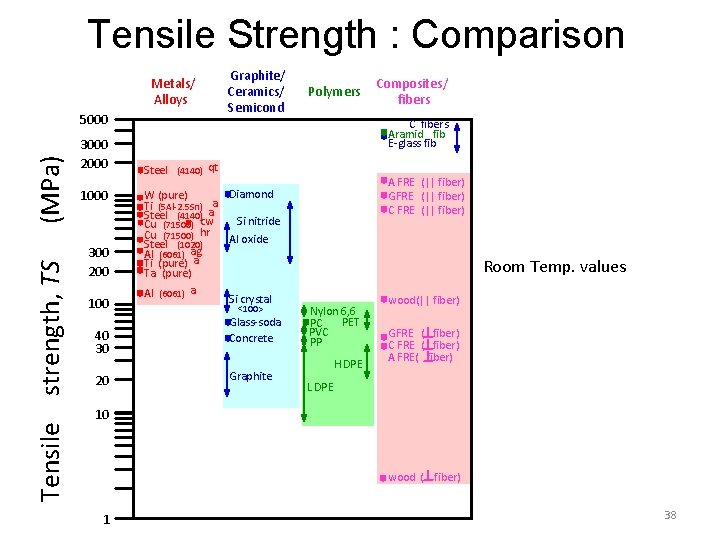
Tensile Strength : Comparison Metals/ Alloys Tensile strength, TS (MPa) 5000 3000 2000 1000 300 200 100 40 30 20 Graphite/ Ceramics/ Semicond Polymers Composites/ fibers C fibers Aramid fib E-glass fib Steel (4140) qt Diamond W (pure) Ti (5 Al-2. 5 Sn) aa Steel (4140) Si nitride Cu (71500) cw Cu (71500) hr Al oxide Steel (1020) ag Al (6061) Ti (pure) a Ta (pure) Al (6061) a Si crystal <100> Glass-soda Concrete Graphite A FRE (|| fiber) GFRE (|| fiber) C FRE (|| fiber) Room Temp. values Nylon 6, 6 PET PC PVC PP H DPE wood(|| fiber) GFRE ( fiber) C FRE ( fiber) A FRE( fiber) L DPE 10 wood ( fiber) 1 38
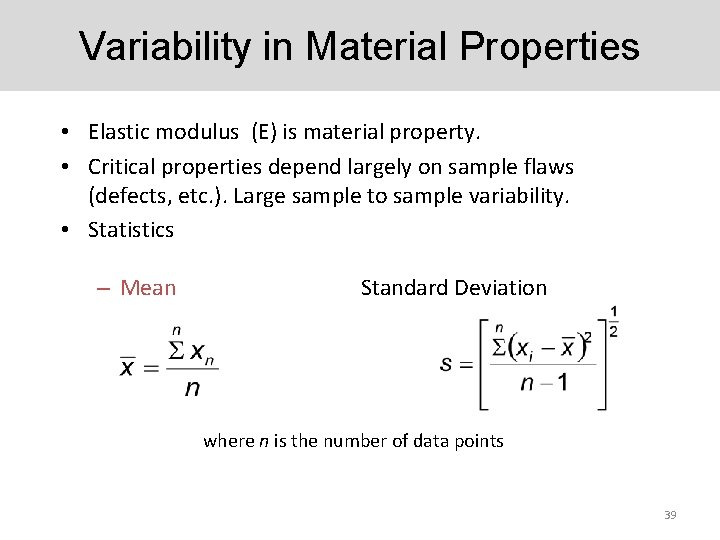
Variability in Material Properties • Elastic modulus (E) is material property. • Critical properties depend largely on sample flaws (defects, etc. ). Large sample to sample variability. • Statistics – Mean Standard Deviation where n is the number of data points 39
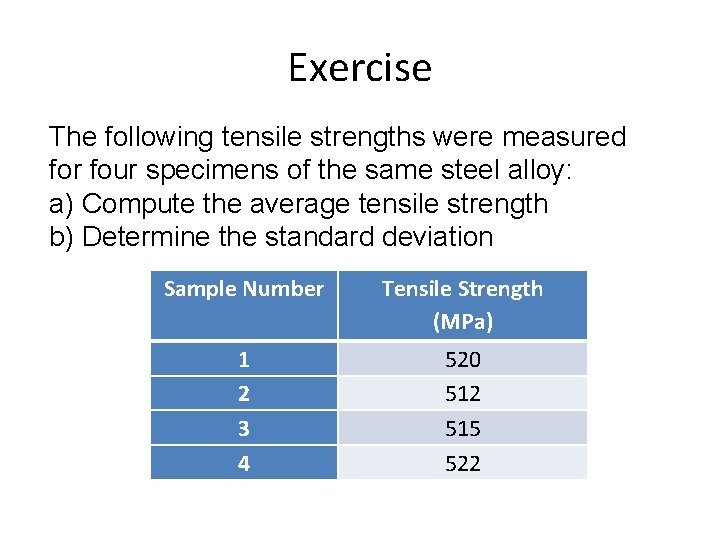
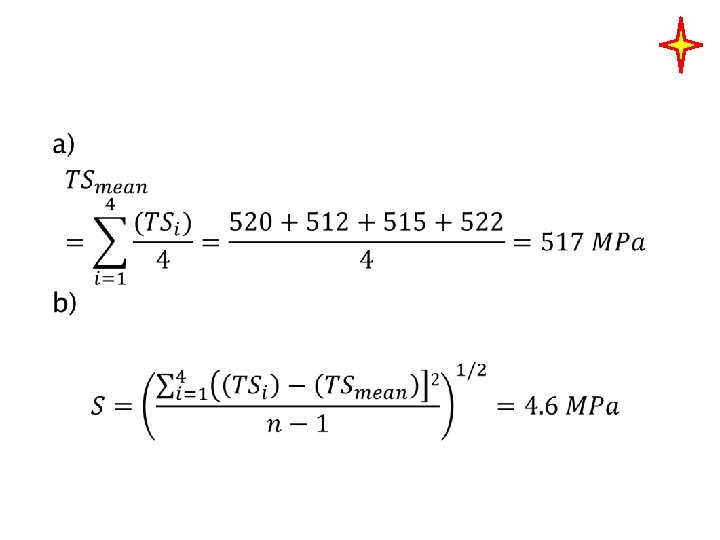
Exercise The following tensile strengths were measured for four specimens of the same steel alloy: a) Compute the average tensile strength b) Determine the standard deviation Sample Number Tensile Strength (MPa) 1 2 3 4 520 512 515 522
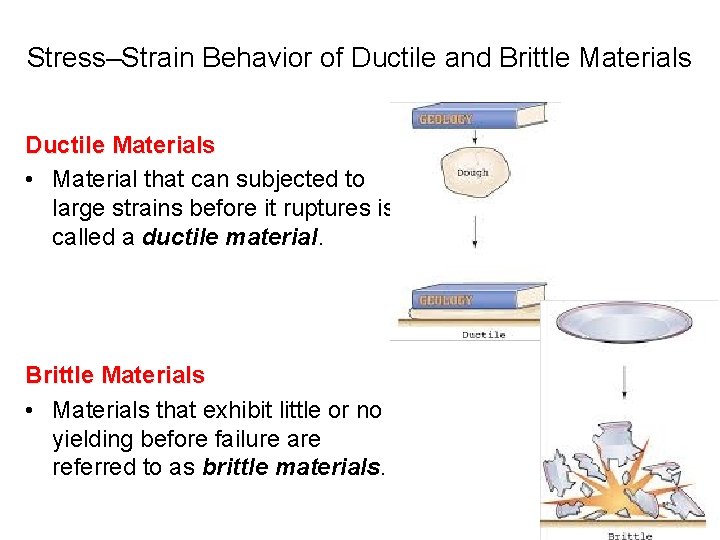
Stress–Strain Behavior of Ductile and Brittle Materials Ductile Materials • Material that can subjected to large strains before it ruptures is called a ductile material. Brittle Materials • Materials that exhibit little or no yielding before failure are referred to as brittle materials.
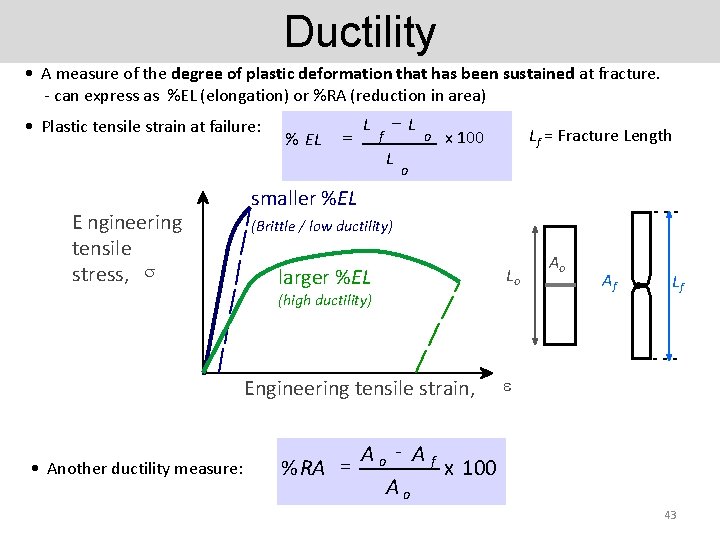
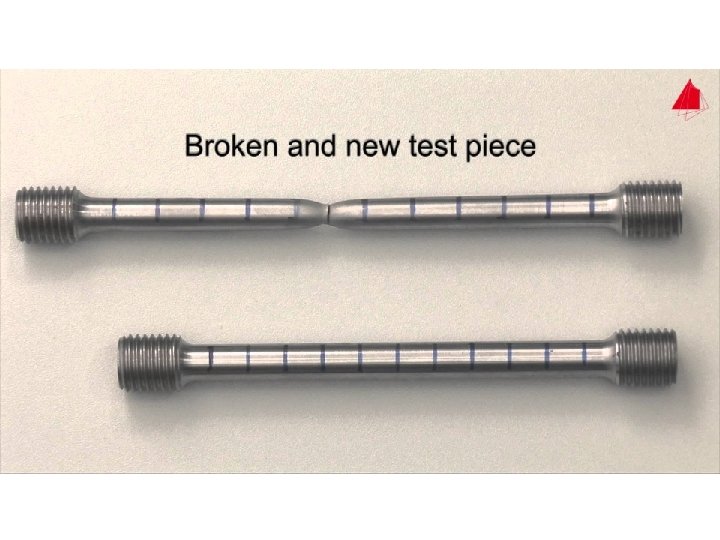
Ductility • A measure of the degree of plastic deformation that has been sustained at fracture. - can express as %EL (elongation) or %RA (reduction in area) • Plastic tensile strain at failure: E ngineering tensile stress, % EL = L f -L L smaller %EL (Brittle / low ductility) o Lf = Fracture Length x 100 o larger %EL Lo (high ductility) Engineering tensile strain, • Another ductility measure: Ao Af Lf Ao - Af % RA = x 100 Ao 43
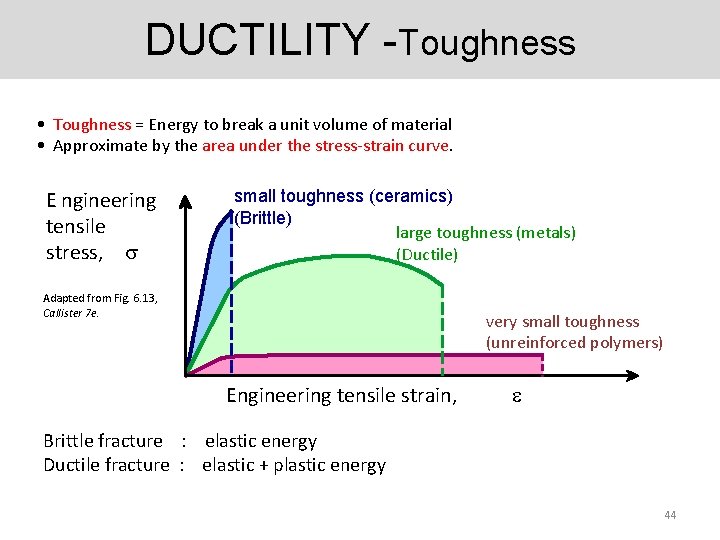
DUCTILITY -Toughness • Toughness = Energy to break a unit volume of material • Approximate by the area under the stress-strain curve. E ngineering tensile stress, small toughness (ceramics) (Brittle) large toughness (metals) (Ductile) Adapted from Fig. 6. 13, Callister 7 e. very small toughness (unreinforced polymers) Engineering tensile strain, Brittle fracture : elastic energy Ductile fracture : elastic + plastic energy 44
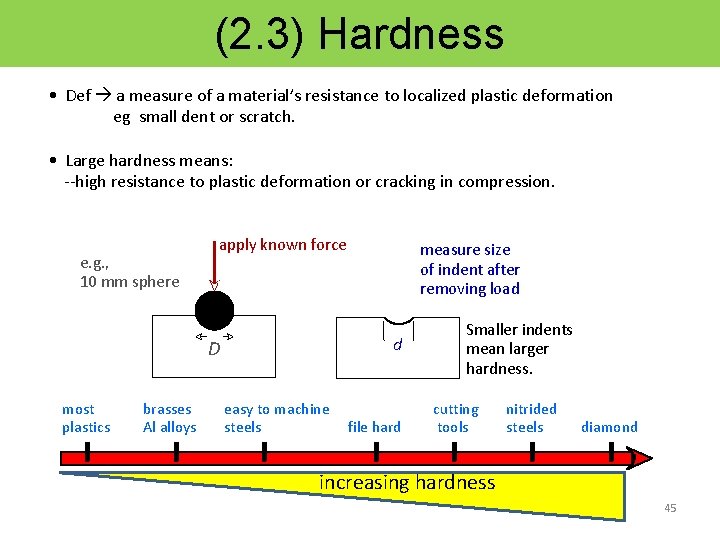
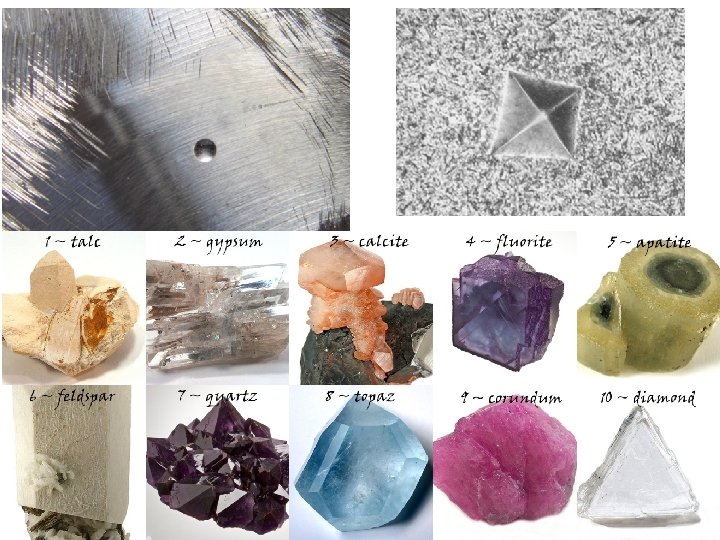
(2. 3) Hardness • Def a measure of a material’s resistance to localized plastic deformation eg small dent or scratch. • Large hardness means: --high resistance to plastic deformation or cracking in compression. e. g. , 10 mm sphere apply known force D most plastics brasses Al alloys measure size of indent after removing load d easy to machine steels file hard Smaller indents mean larger hardness. cutting tools nitrided steels diamond increasing hardness 45
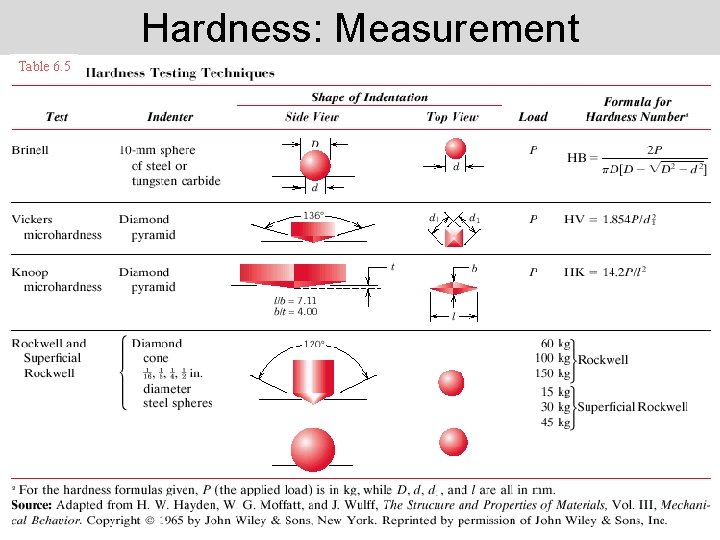
Hardness: Measurement Table 6. 5 46
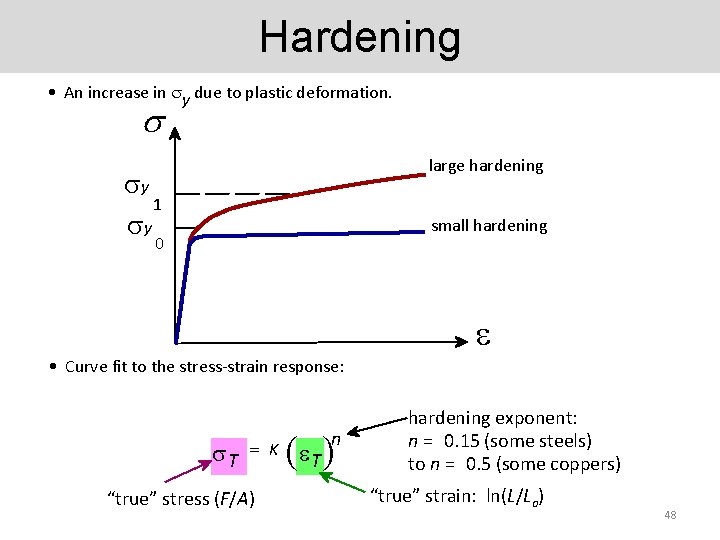
Hardening • An increase in y due to plastic deformation. s large hardening y 1 y small hardening 0 • Curve fit to the stress-strain response: T = K “true” stress (F/A) ( T ) n hardening exponent: n = 0. 15 (some steels) to n = 0. 5 (some coppers) “true” strain: ln(L/Lo) 48
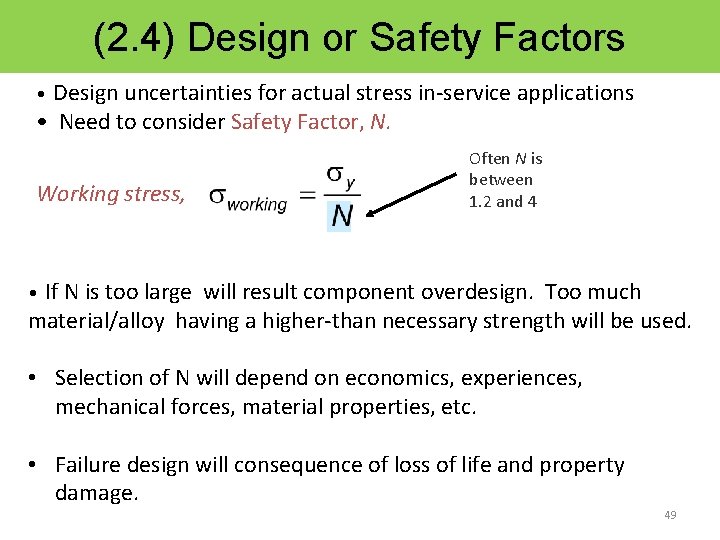
(2. 4) Design or Safety Factors • Design uncertainties for actual stress in-service applications • Need to consider Safety Factor, N. Working stress, Often N is between 1. 2 and 4 • If N is too large will result component overdesign. Too much material/alloy having a higher-than necessary strength will be used. • Selection of N will depend on economics, experiences, mechanical forces, material properties, etc. • Failure design will consequence of loss of life and property damage. 49
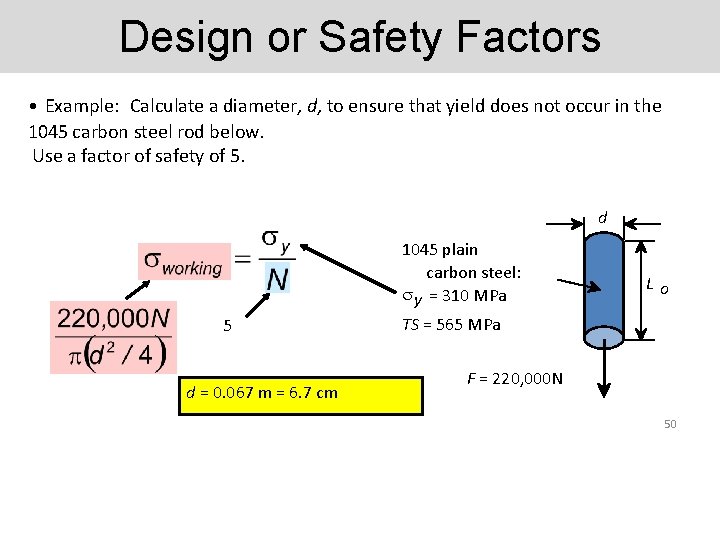
Design or Safety Factors • Example: Calculate a diameter, d, to ensure that yield does not occur in the 1045 carbon steel rod below. Use a factor of safety of 5. d 5 d = 0. 067 m = 6. 7 cm 1045 plain carbon steel: y = 310 MPa TS = 565 MPa Lo F = 220, 000 N 50
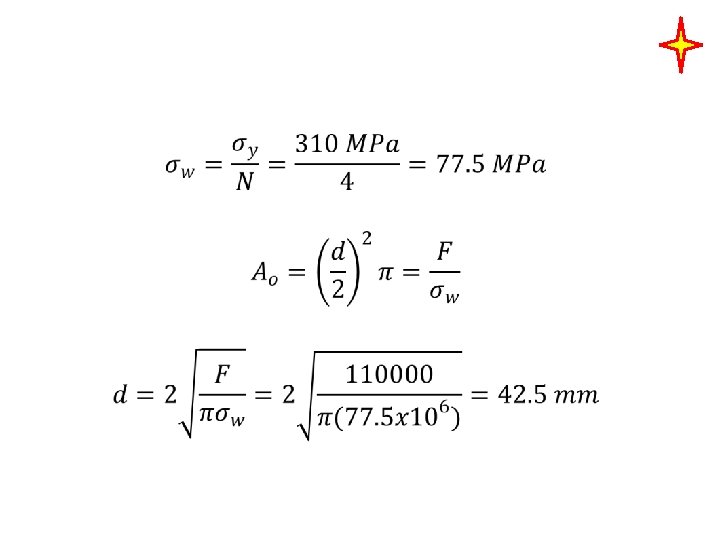
EXERCISE 5 • A tensile testing is to be constructed that must withstand a maximum load of 110 k. N. The design calls for two cylindrical support posts, each which is to half of the maximum load. Furthermore, plain-carbon steel ground and polished shafting rounds are to be used: the minimum yield of this alloy are 310 MPa respectively. Specify a suitable diameter for these support posts. Use a suitable safety factor.
Summary • Stress and strain: These are size-independent measures of load and displacement, respectively. • Elastic behavior: This reversible behavior often shows a linear relation between stress and strain. To minimize deformation, select a material with a large elastic modulus (E or G). • Plastic behavior: This permanent deformation behavior occurs when the tensile (or compressive) uniaxial stress reaches y. • Toughness: The energy needed to break a unit volume of material. • Ductility: The plastic strain at failure. 53
- Slides: 53