1 Calculation Flow 1Raw data from TMD Daily


 <Historical Data, three month rainfall from 1970")
 <Historical Data, three month rainfall from 1990")
 <TRUNCATE Process> 381005")

 Severe Drought")
 Severe Drought")
 Severe Drought once in")


 from TMD Using")

 1/7/2022 17")
 1/7/2022 18")
- Slides: 18
1. Calculation Flow <1>Raw data from TMD, Daily Rainfall We count the number of missing data for each three month as “three_ERROR (i, l), i : year, l : Station ID” and sum the daily rainfall into “three_month (i, l)”. If “three_ERROR (i , l)” is greater than 10, then we consider three_month (i, l) as missing. <2> Three Month Rainfall (July to Sep) We calculate the AVERAGE and STDEV for each observation points, however, if the number of “three_month (i, l)” is less than 10 years, then we do not use these weather stations as the target for developing products. Based on the AVERAGE and STDEV for each weather stations, we hypothesize that the precipitation on each weather stations follows the normal distribution. We adjust the distribution for some weather stations which have a possibility under 0 mm on rainfall, -TRUNCATE Process- <3> Normal Distribution We set the threshold value for Drought as the 20% possibility. We set the threshold value for Severe Drought as the 4% possibility and 5% possibility. 1/7/2022 <4> Threshold set up 3
<2> Three Month Rainfall (July to Sep) <Historical Data, three month rainfall from 1970 -1989> 1/7/2022 4
<2> Three Month Rainfall (July to Sep) <Historical Data, three month rainfall from 1990 -2009> 1/7/2022 5
<3> Normal Distribution 381001 Distribution of index rainfall during July-September (381001) <TRUNCATE Process> 381005 Some distribution has the possibility less than “ 0(zero)” 1/7/2022 “Count” is the number of observed value in 38 years Negative rainfall shall not be adopted. 6
<4> Threshold set up –Rating Concept. The concept of Rating <1>Probability of payout : P(A) Expected Value of Payout : <2>Payout : B P(A)×B <3>Expected Loss Ratio : C% α(%)={P(A)×B}/C(%) <4>Premium Rate : α% <1> How to caluculate the Probability of payout AVE Probability of payout : P(A) STDEV Historical Data Average 1/7/2022 STDEV 7
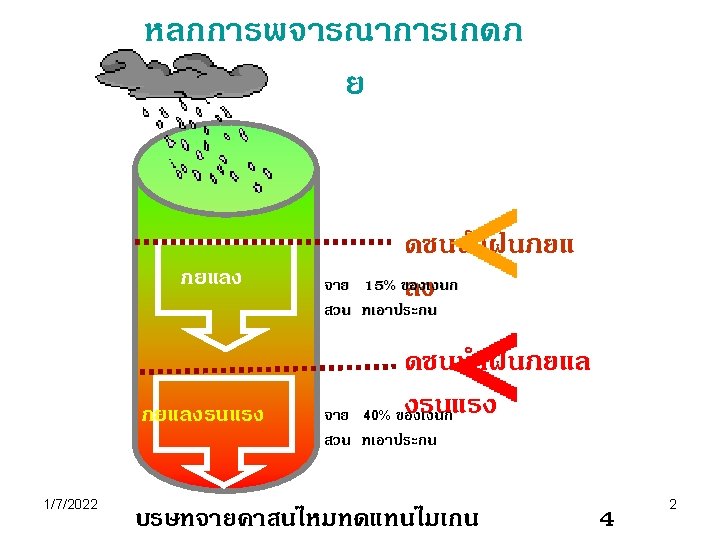
<4> Threshold set up -Plan 1 Drought once in 5 years (20%) Severe Drought once in 33 years (3%) Feedback from farmers Based on Hydrogy Feedback from farmers 3% : Drought once in 33 years Calculated as follow, , , Caluculated as follow; {α (%) x 40. 00 (%) + (20(%)- α (%)) x 15. 00 (%) } / 4. 64 (%) = 80 (%) α (%) = {80 (%) x 4. 64 (%) – 20 (%) x 15. 00(%) } / 25. 00 (%) α (%) = 2. 84 (%) ≒ 3% ⇒ Probability for Severe Drought (Drought once in 33 years) 1/7/2022 8
<4> Threshold set up -Plan 2 Drought once in 5 years (20%) Severe Drought once in 20 years (5%) Feedback from farmers Based on Hydrogy Feedback from farmers 5% : Drought once in 20 years Calculated as follow, , , Caluculated as follow; {α (%) x 30. 00 (%) + (20(%)- α (%)) x 15. 00 (%) } / 4. 64 (%) = 80 (%) α (%) = {80 (%) x 4. 64 (%) – 20 (%) x 15. 00(%) } / 15. 00 (%) α (%) = 4. 74 (%) ≒ 5% ⇒ Probability for Severe Drought (Drought once in 20 years) 1/7/2022 9
<4> Threshold set up Drought once in 5 years (20%) Severe Drought once in 20 years (5%) Probability of Severe Drought 5% 1/7/2022 Probability of Drought 15%(=20 -5)% 10
350. 18 381002 184. 64 1/7/2022 381003 11
217. 23 381006 312. 63 1/7/2022 381009 12
385. 83 381201 1/7/2022 13
<4> Threshold set up ③ 1/7/2022 14
2. Corresponds between observation points and Amphuer <1>Geographic data (Longitude, Latitude) from TMD Using Google Earth, we identify the location of observation points. Some Amphure do not have enough length data, then we set the adjoining observation points. Som Amphuer do not have the observation points, then we set the adjoining observation points. <2> Set the observation point for each Amphuer 381011 381007 381025 381017 381010 381008 381004 381023 381003 381012 381015 381027 381301 381016 381201 381005 381024 381022 381006 381001 381014 1/7/2022 381013 381002 381009 381026 15
1/7/2022 Corresponds between observation points and Amphuer 16
<2> Three Month Rainfall (July to Sep : 1970 -1989) 1/7/2022 17
<2> Three Month Rainfall (July to Sep : 1990 -2009) 1/7/2022 18