
1 Ali Hussain Layla Al Khabbaz Nawal Kaiser
1 Ali Hussain Layla Al. Khabbaz Nawal Kaiser Ameera Mohammed Faisal Al. Ahmed
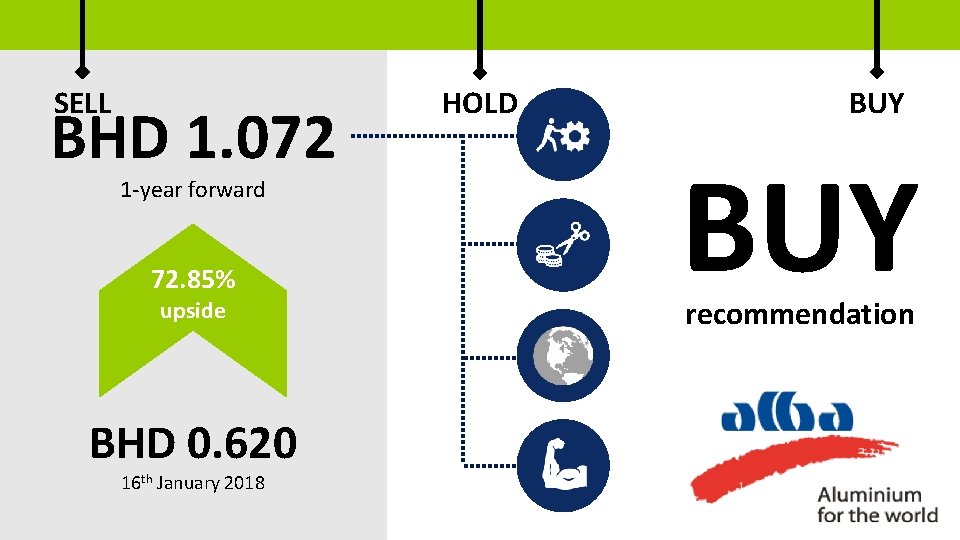
2 SELL BHD 1. 072 1 -year forward 72. 85% upside BHD 0. 620 16 th January 2018 HOLD BUY recommendation

3 COMPANY DESCRIPTION
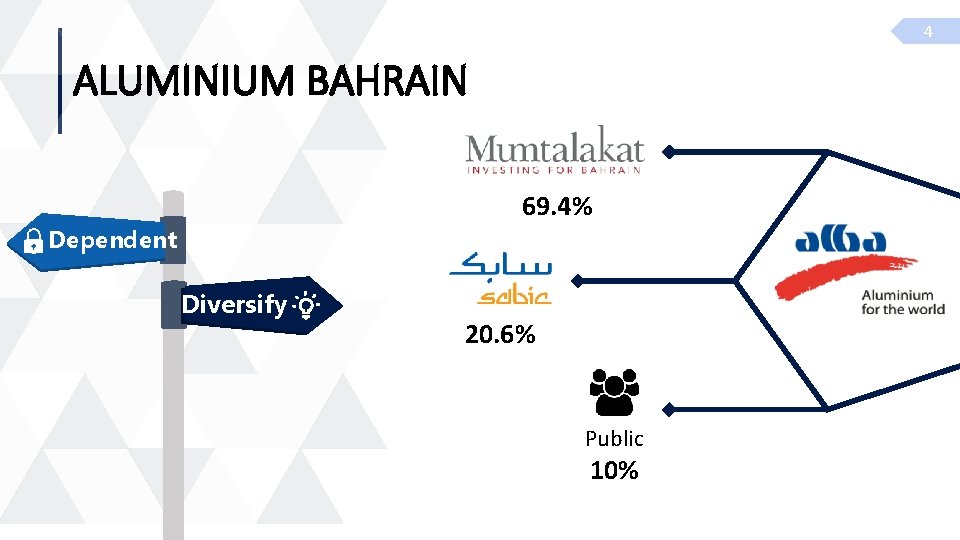
4 ALUMINIUM BAHRAIN 69. 4% Dependent Diversify 20. 6% Public 10%
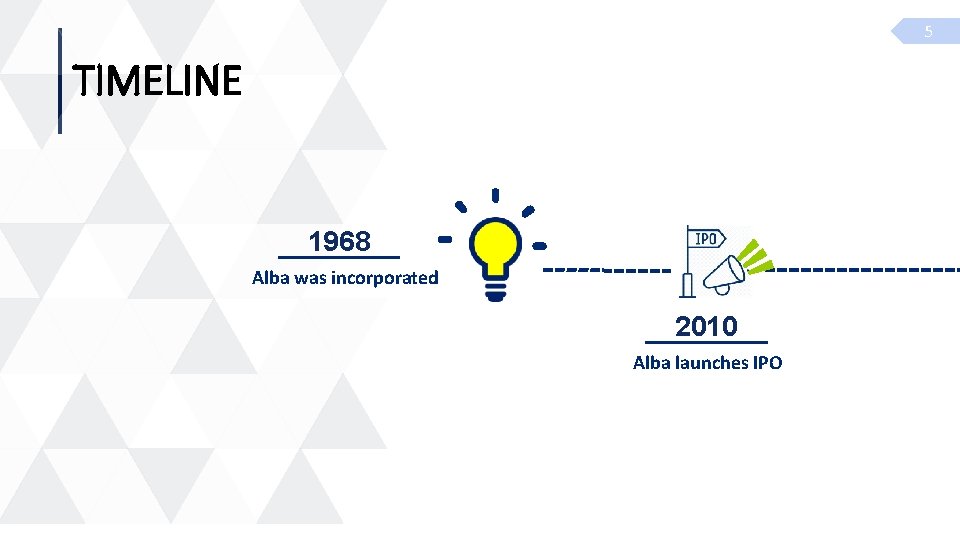
5 TIMELINE 1968 Alba was incorporated 2010 Alba launches IPO
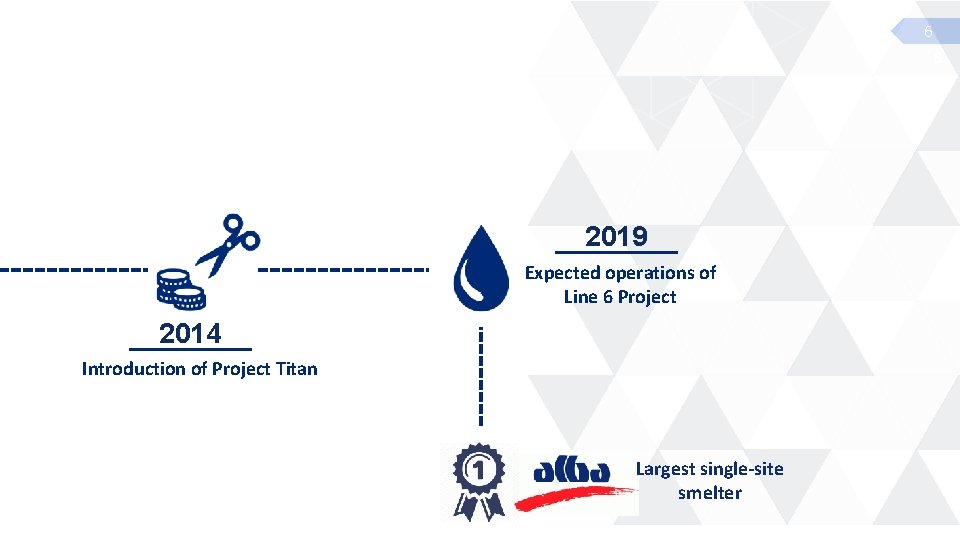
6 6 2019 Expected operations of Line 6 Project 2014 Introduction of Project Titan Largest single-site smelter
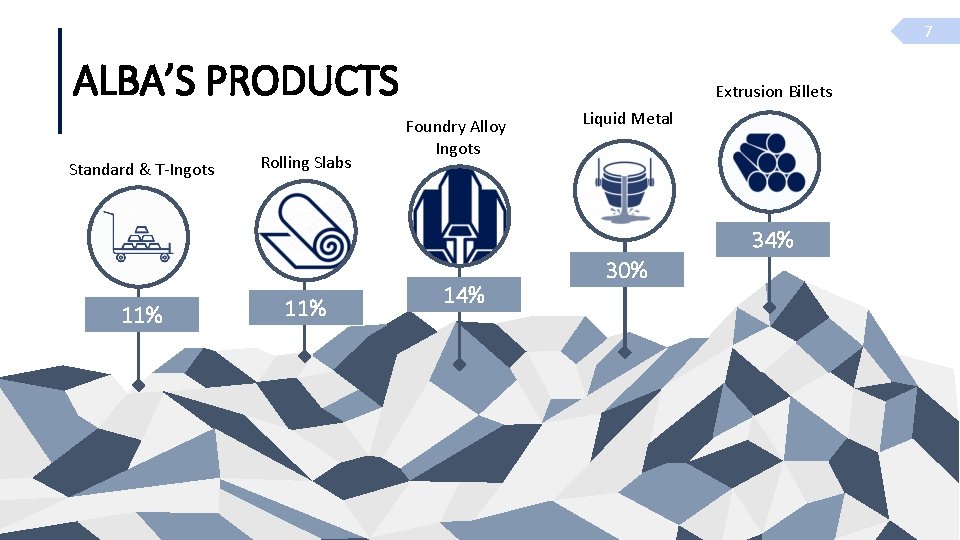
7 ALBA’S PRODUCTS Standard & T-Ingots Rolling Slabs Extrusion Billets Foundry Alloy Ingots Liquid Metal 34% 11% 14% 30%
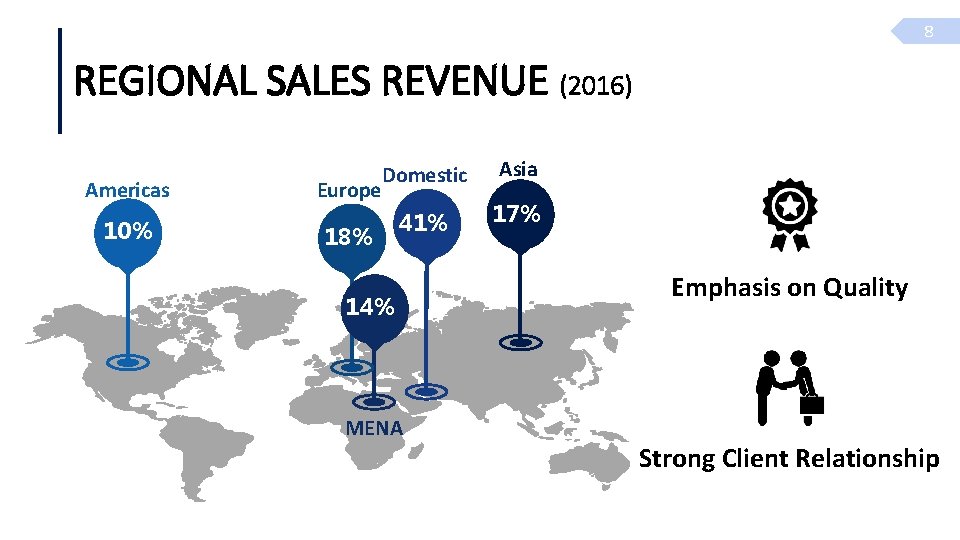
8 REGIONAL SALES REVENUE (2016) Americas 10% Europe Domestic 18% 41% 14% MENA Asia 17% Market Position Secure Emphasis on Quality Strong Client Relationship
10 INDUSTRY ANALYSIS
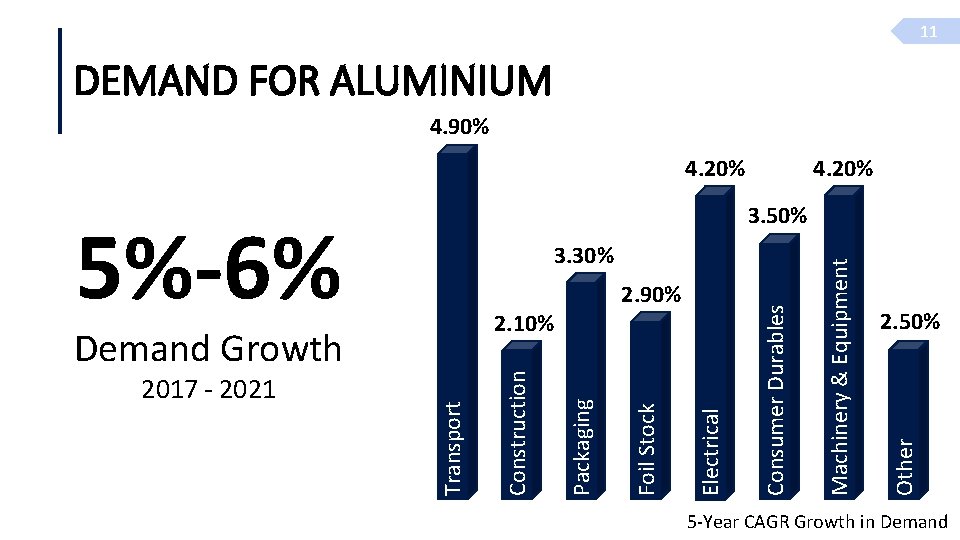
11 DEMAND FOR ALUMINIUM 4. 90% 4. 20% 2. 50% Other Machinery & Equipment Electrical Transport Foil Stock 2. 10% Consumer Durables 3. 30% 2. 90% Demand Growth 2017 - 2021 3. 50% Extrusion Billets Packaging 5%-6% Foundry Alloy Ingots Construction Standard Ingots 4. 20% 5 -Year CAGR Growth in Demand
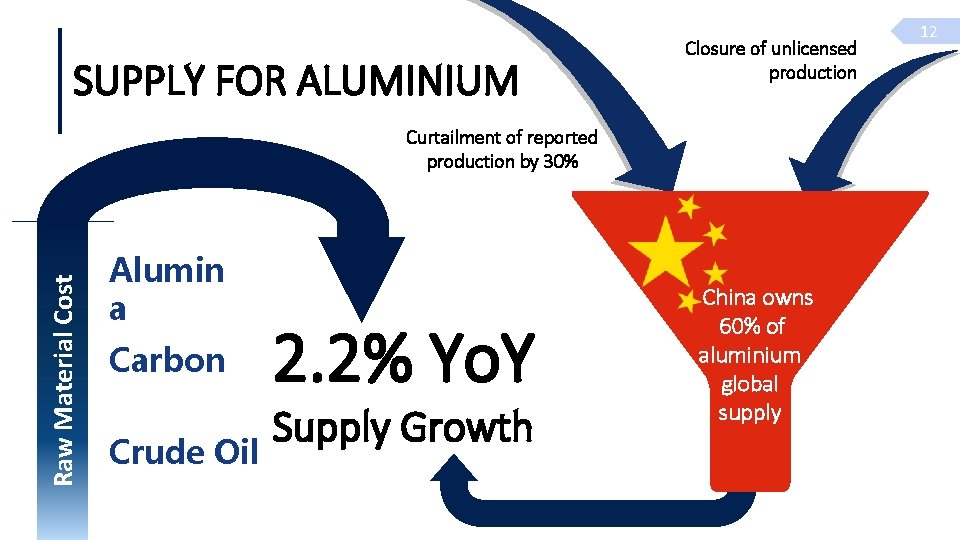
SUPPLY FOR ALUMINIUM Closure of unlicensed production Raw Material Cost Curtailment of reported production by 30% Alumin a Carbon Crude Oil 2. 2% Yo. Y Supply Growth China owns 60% of aluminium global supply 12
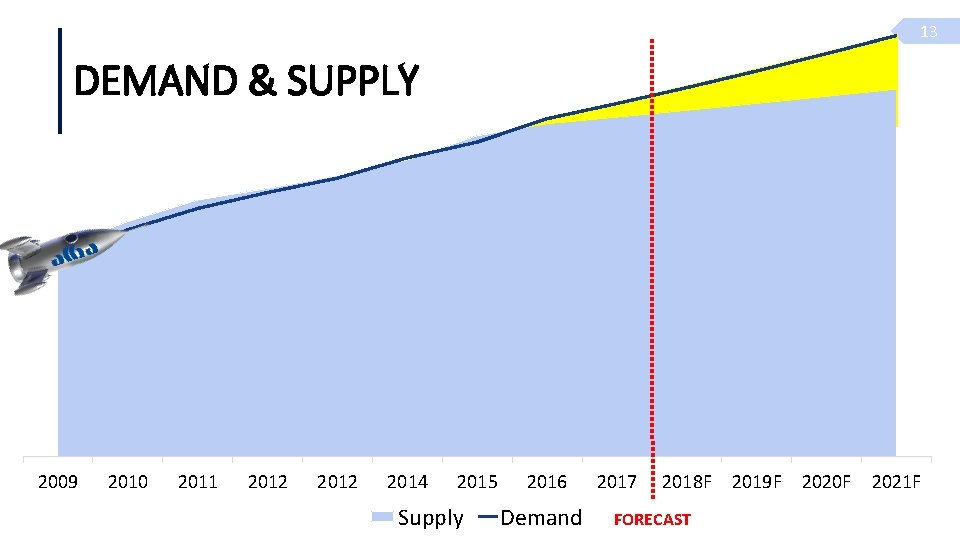
13 DEMAND & SUPPLY 2009 2010 2011 2012 2014 2015 Supply 2016 Demand 2017 2018 F FORECAST 2019 F 2020 F 2021 F
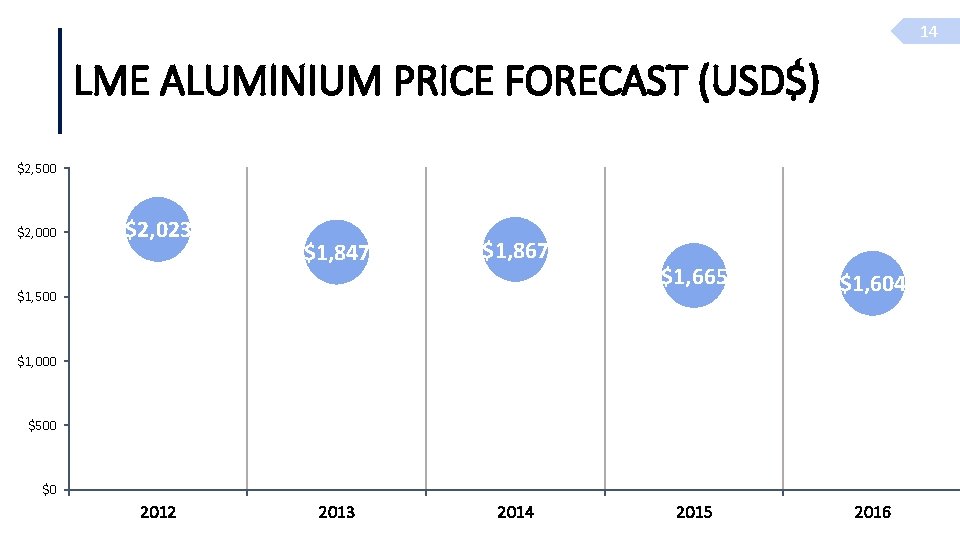
14 LME ALUMINIUM PRICE FORECAST (USD$) $2, 500 $2, 023 $1, 847 $1, 867 $1, 500 $1, 665 $1, 604 2015 2016 $1, 000 $500 $0 2012 2013 2014
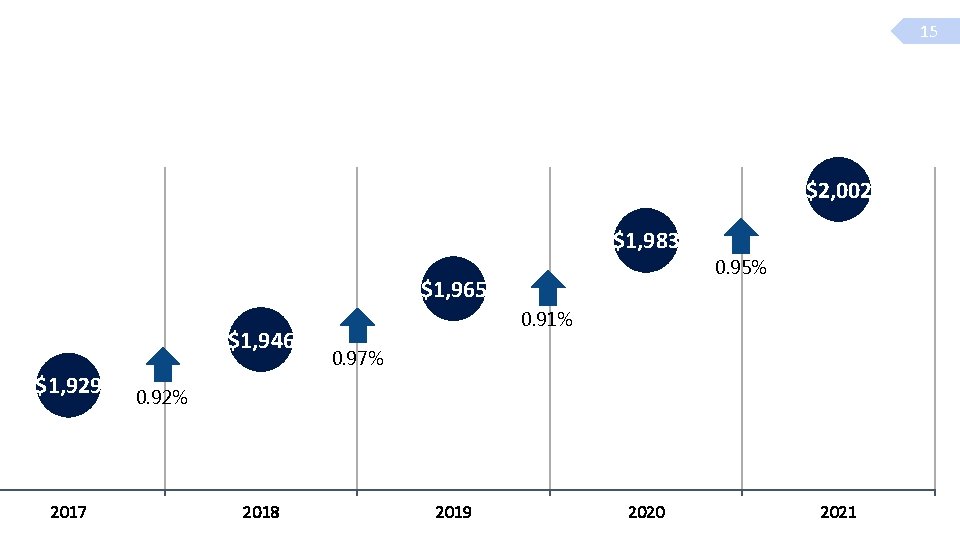
15 $2, 002 $1, 983 0. 95% $1, 965 $1, 946 $1, 929 2017 0. 91% 0. 97% 0. 92% 2018 2019 2020 2021
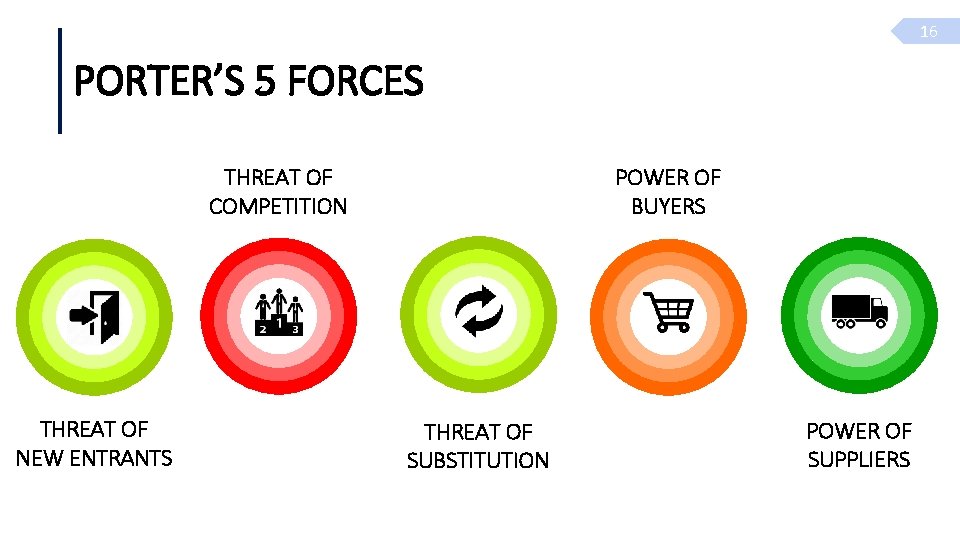
16 PORTER’S 5 FORCES POWER OF BUYERS THREAT OF COMPETITION THREAT OF NEW ENTRANTS THREAT OF SUBSTITUTION POWER OF SUPPLIERS
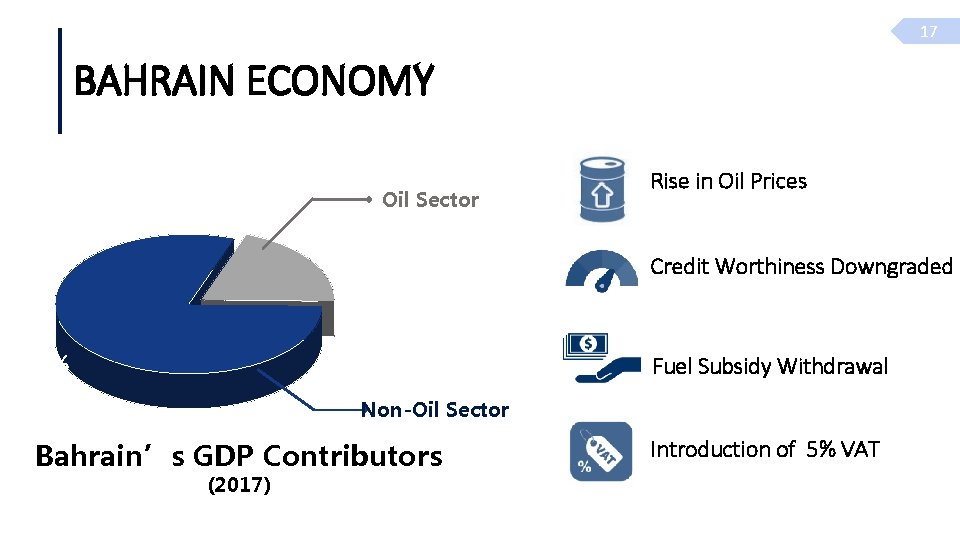
17 BAHRAIN ECONOMY Oil Sector 20% Rise in Oil Prices Credit Worthiness Downgraded 80% Fuel Subsidy Withdrawal Non-Oil Sector Bahrain’s GDP Contributors (2017) Introduction of 5% VAT
18 FINANCIAL ANALYSIS
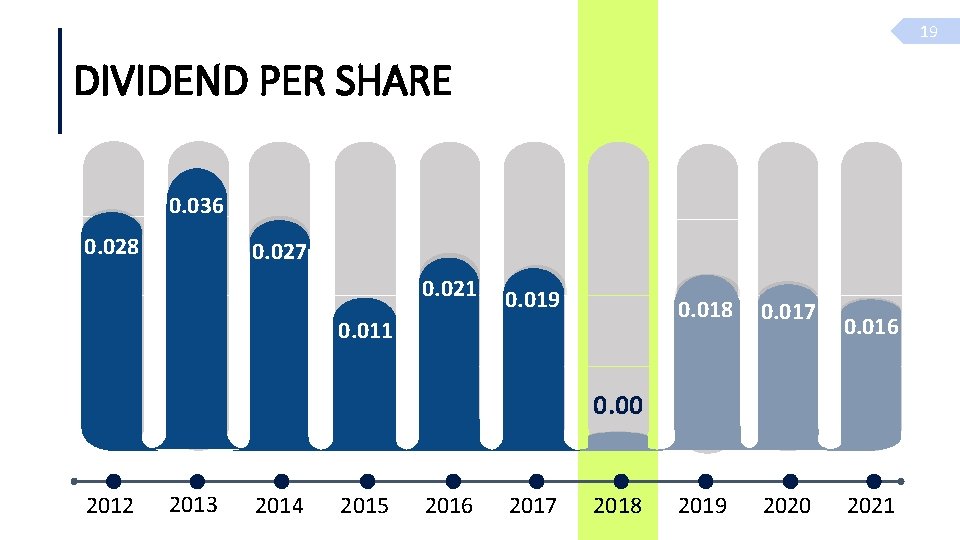
19 DIVIDEND PER SHARE 0. 036 0. 028 0. 027 0. 021 0. 019 0. 011 0. 018 0. 017 2019 2020 0. 016 0. 00 2012 2013 2014 2015 2016 2017 2018 2021
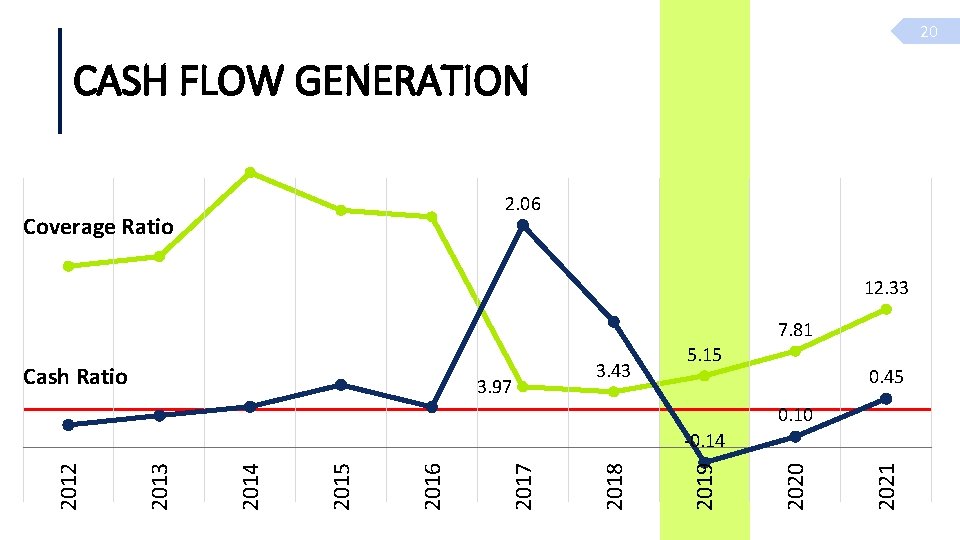
20 CASH FLOW GENERATION 2. 06 Coverage Ratio 12. 33 7. 81 Cash Ratio 3. 97 3. 43 5. 15 0. 45 0. 10 2021 2020 2019 2018 2017 2016 2015 2014 2013 2012 -0. 14
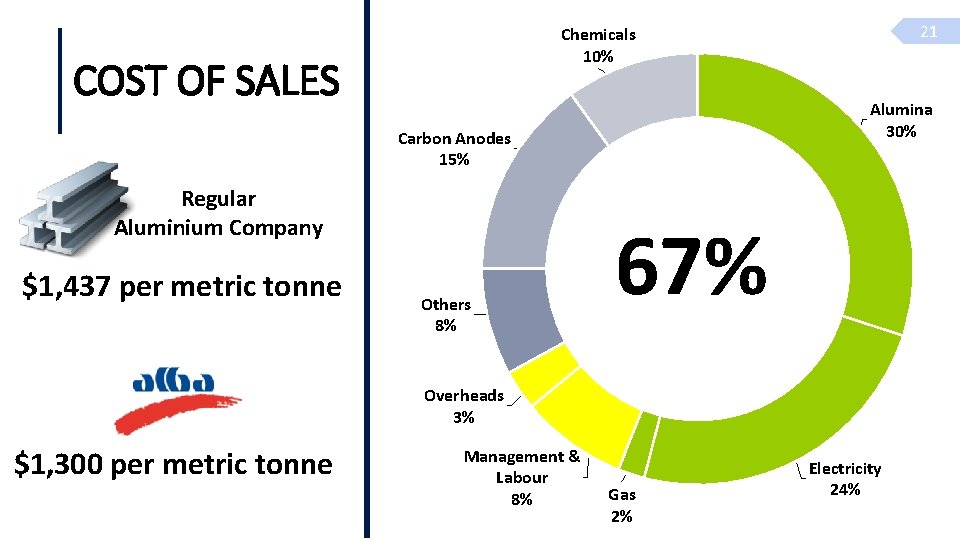
COST OF SALES Alumina 30% Carbon Anodes 15% Regular Aluminium Company $1, 437 per metric tonne 21 Chemicals 10% Others 8% 67% Overheads 3% $1, 300 per metric tonne Management & Labour 8% Gas 2% Electricity 24%
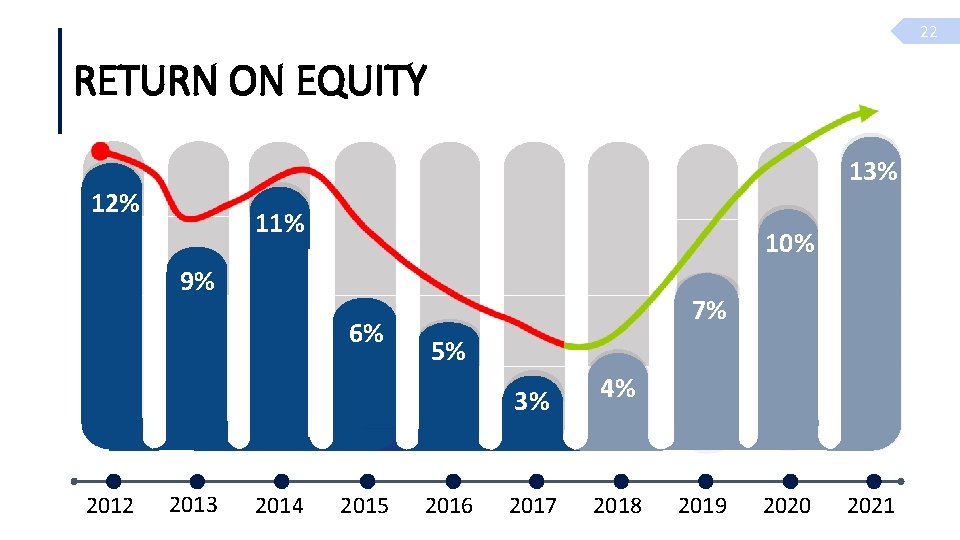
22 RETURN ON EQUITY 13% 12% 11% 10% 9% 6% 7% 5% 3% 2012 2013 2014 2015 2016 2017 4% 2018 2019 2020 2021
23 VALUATION
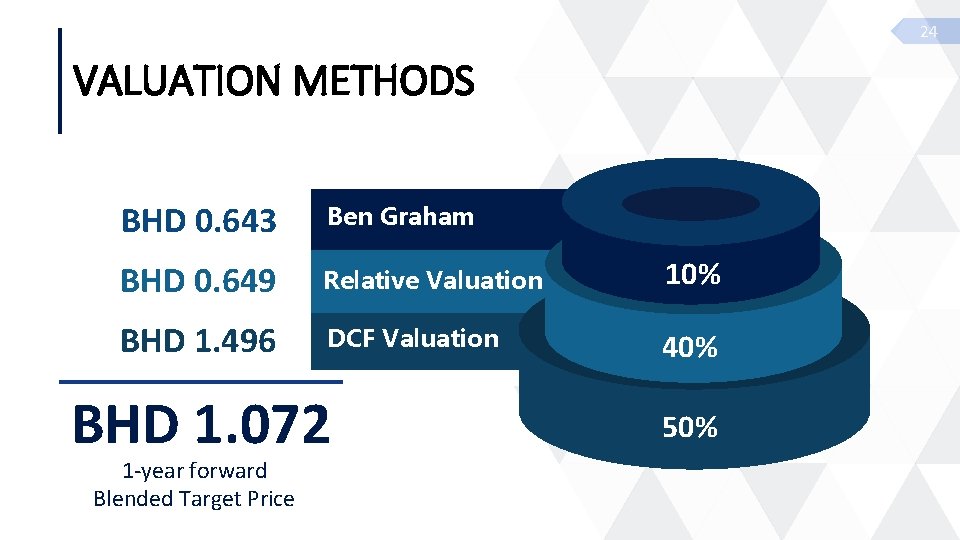
24 VALUATION METHODS BHD 0. 643 Ben Graham BHD 0. 649 Relative Valuation 10% BHD 1. 496 DCF Valuation 40% BHD 1. 072 1 -year forward Blended Target Price 50%
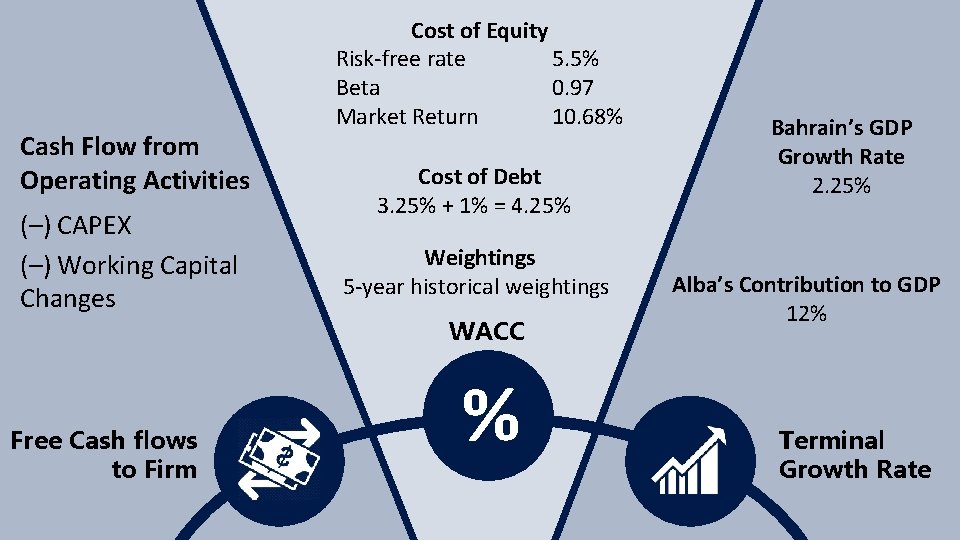
Cash Flow from Operating Activities (–) CAPEX (–) Working Capital Changes Free Cash flows to Firm Cost of Equity Risk-free rate 5. 5% Beta 0. 97 Market Return 10. 68% Cost of Debt 3. 25% + 1% = 4. 25% Weightings 5 -year historical weightings WACC % 25 Bahrain’s GDP Growth Rate 2. 25% Alba’s Contribution to GDP 12% Terminal Growth Rate
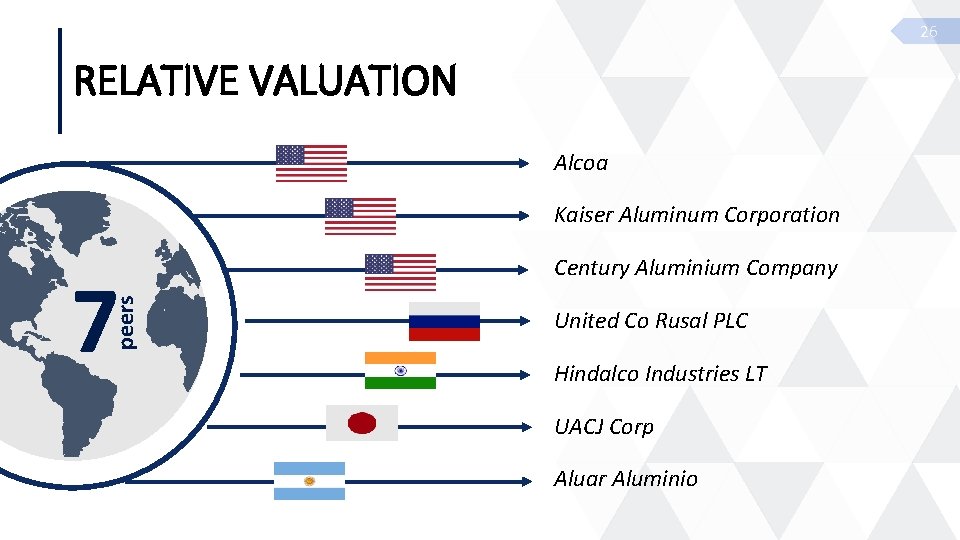
26 RELATIVE VALUATION Alcoa Kaiser Aluminum Corporation peers 7 Century Aluminium Company United Co Rusal PLC Hindalco Industries LT UACJ Corp Aluar Aluminio
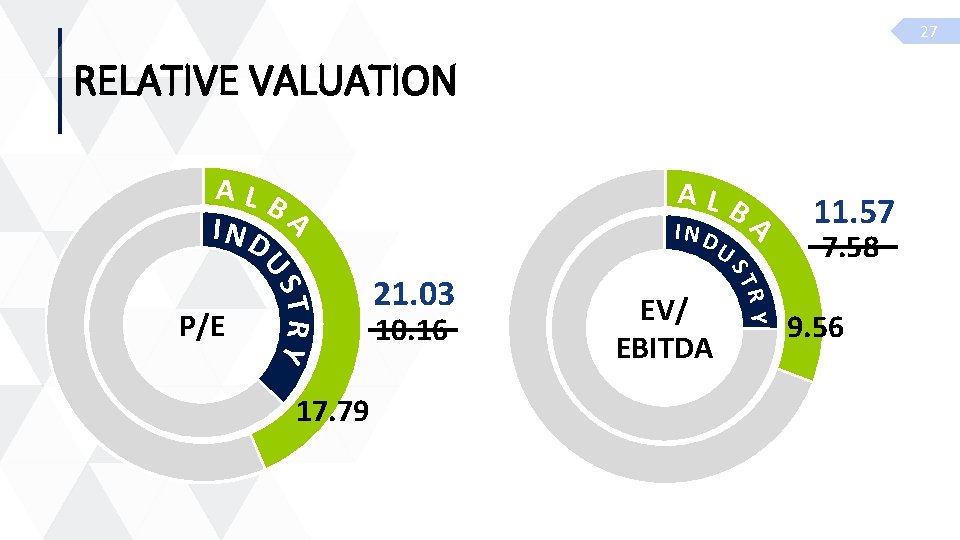
27 RELATIVE VALUATION ALB IND ALB RY TR Y 17. 79 10. 16 EV/ EBITDA ST US P/E 21. 03 U A A I ND 11. 57 7. 58 9. 56
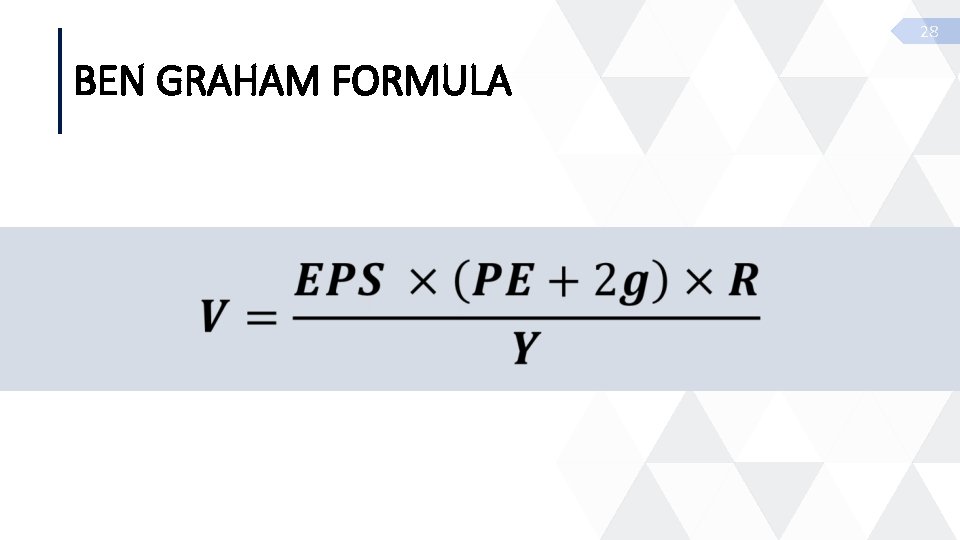
28 BEN GRAHAM FORMULA
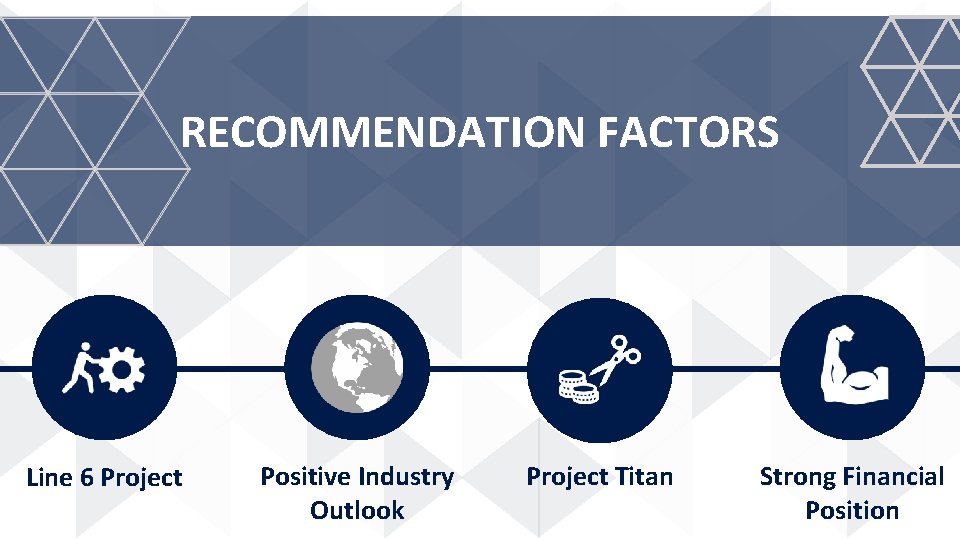
29 RECOMMENDATION FACTORS Line 6 Project Positive Industry Outlook Project Titan Strong Financial Position
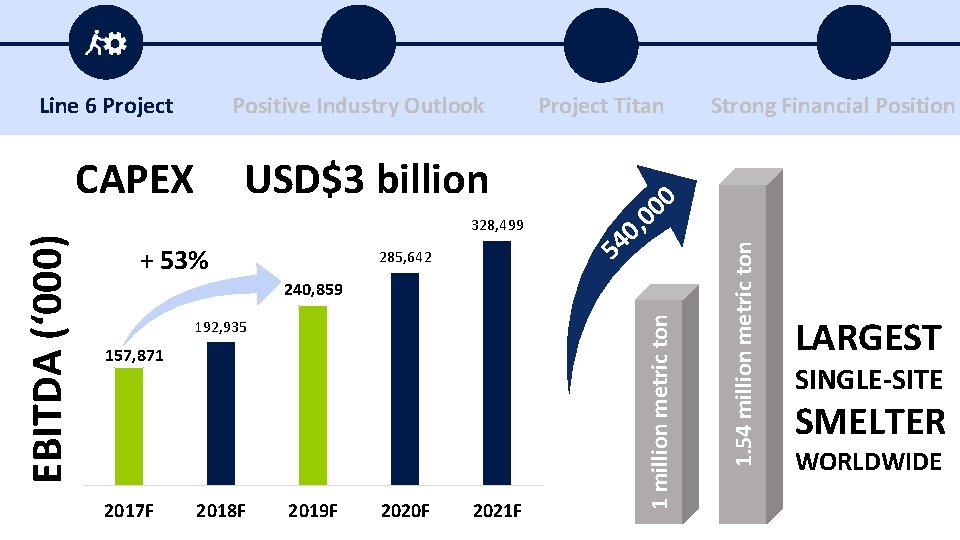
30 Positive Industry Outlook USD$3 billion 328, 499 + 53% 285, 642 0 0 0 , 0 54 240, 859 192, 935 157, 871 2017 F 2018 F 2019 F 2020 F 2021 F 1 million metric ton EBITDA (‘ 000) CAPEX Project Titan Strong Financial Position [VAL 15% UE]% 1. 54 million metric ton Line 6 Project 2019 Alba’s Contribution to GDP LARGEST SINGLE-SITE SMELTER WORLDWIDE
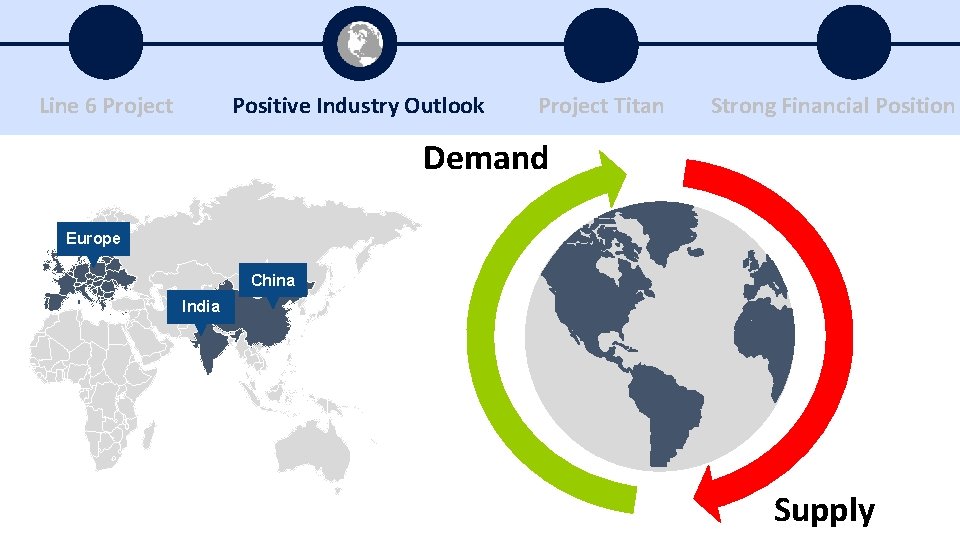
31 Line 6 Project Positive Industry Outlook Project Titan Strong Financial Position Demand Europe China India Supply
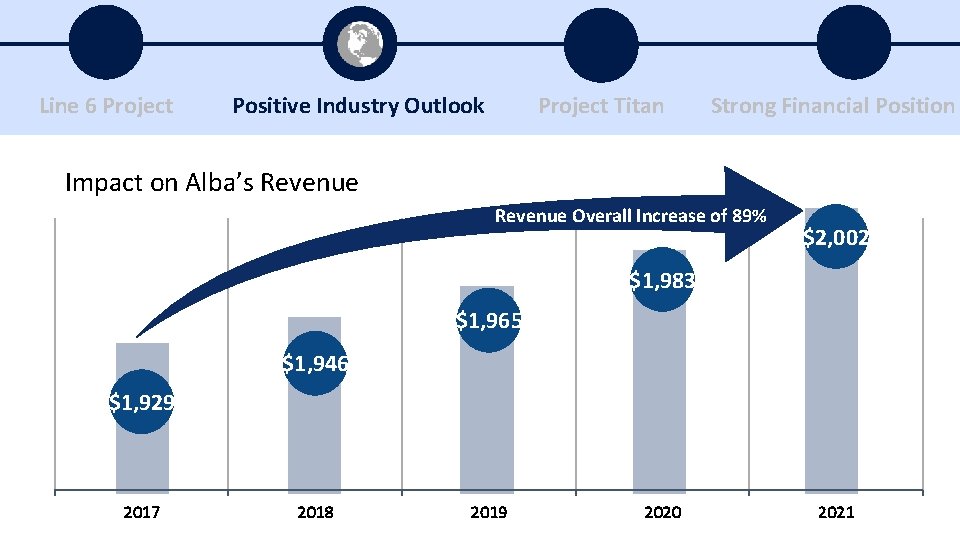
32 Line 6 Project Positive Industry Outlook Project Titan Strong Financial Position Impact on Alba’s Revenue LME Aluminium Price Forecast (USD$) Revenue Overall Increase of 89% $2, 002 $1, 983 $1, 965 $1, 946 $1, 929 2017 2018 2019 2020 2021
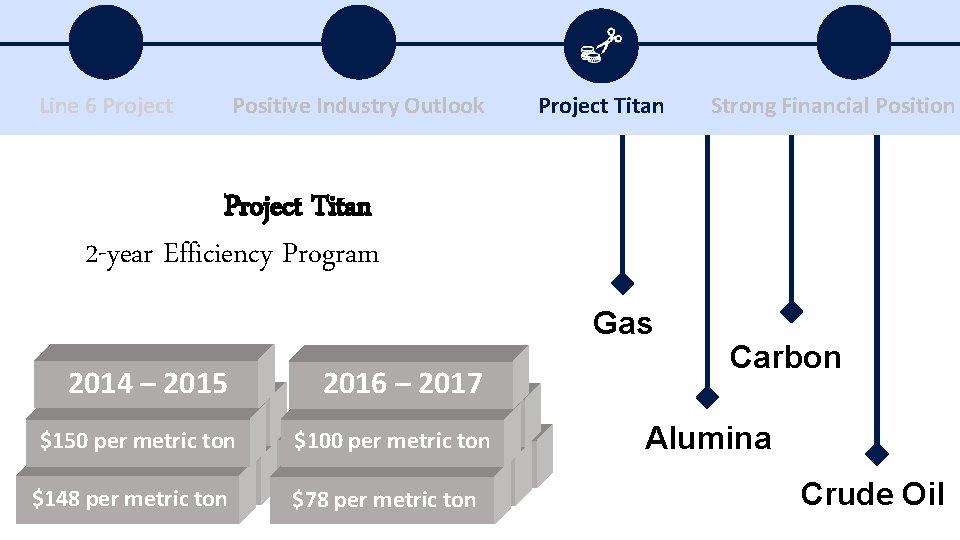
33 Line 6 Project Positive Industry Outlook Project Titan Strong Financial Position Project Titan 2 -year Efficiency Program Gas 2014 – 2015 $150 per metric ton $148 per metric ton 2016 – 2017 $100 per metric ton $78 per metric ton Carbon Alumina Crude Oil
34 Line 6 Project Positive Industry Outlook Project Titan Strong Financial Position Profitability Liquidity
35 KEY RISKS
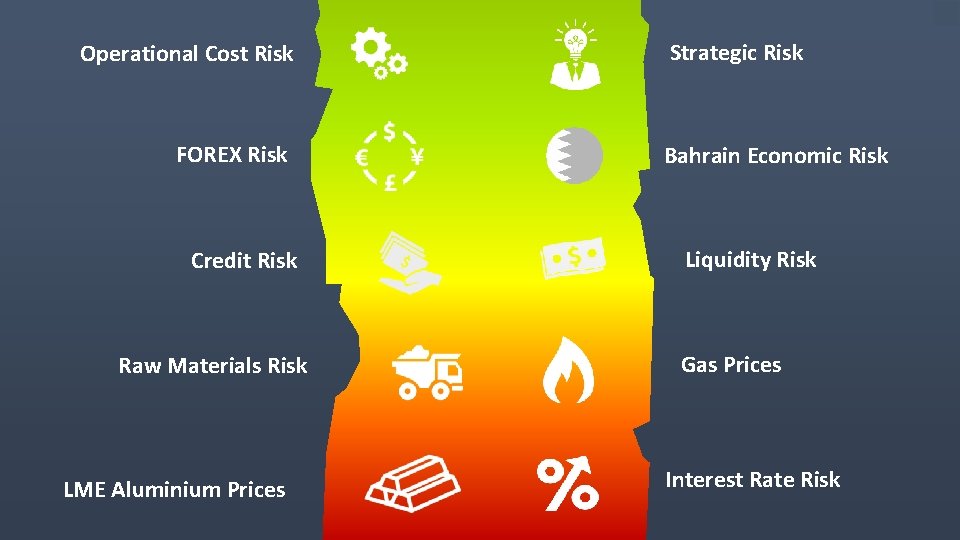
Operational Cost Risk FOREX Risk Credit Risk Raw Materials Risk LME Aluminium Prices Strategic Risk Bahrain Economic Risk Liquidity Risk Gas Prices Interest Rate Risk 36
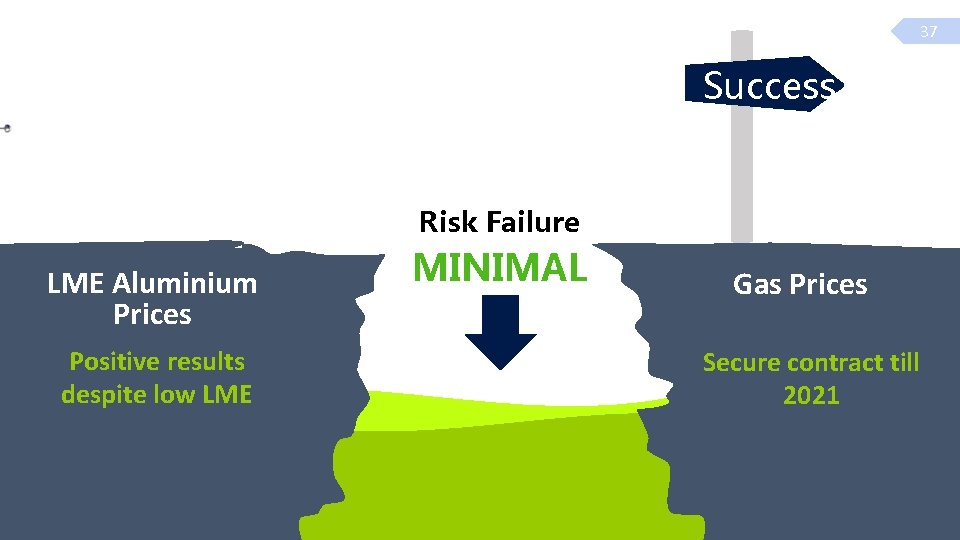
37 Success Risk Failure LME Aluminium Prices Positive results despite low LME MINIMAL Gas Prices Secure contract till 2021
38 Positive Industry Outlook Solid Company Analysis CONCLUSION
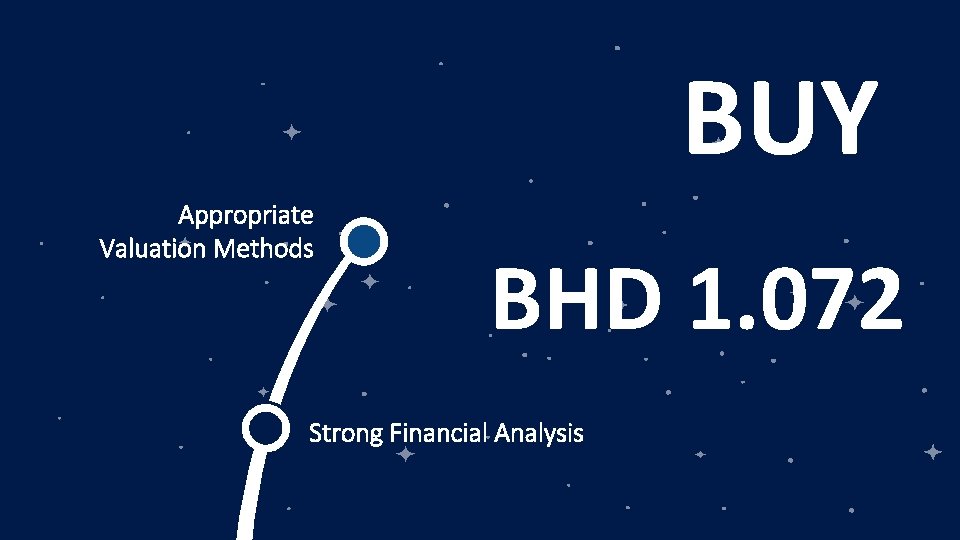
39 BUY Appropriate Valuation Methods BHD 1. 072 Strong Financial Analysis
Company Analysis Aluminium Bahrain Timeline Alba’s Products Regional Sales Revenue (2016) Market Profile Industry Analysis Demand for Aluminium Supply for Aluminium Demand & Supply LME Aluminium Price Forecast (USD$) Porter’s 5 Forces Bahrain Economy Financial Analysis Dividend Per Share Cash Flow Generation Cost of Sales Return on Equity Valuation Methods Discounted Cash Flow Valuation Model Relative Valuation Ben Graham Formula Recommendation Factors Line 6 Project Positive Industry Outlook Project Titan Strong Financial Position Key Risks Risk Grid Appendix Historical Stock Price Alba Production Levels Rising Raw Material Costs Return on equity Bahrain Real GDP Growth Rate Financial Statements Balance Sheet Cash Flow Statement of Changes in Equity Financial Ratios Discounted Cash Flow Valuation Relative Valuation Ben Graham Formula Line 6 DCF Valuation Piotriski F-Score Beniesh M-Score Altman Z-Score Aluminium Demand by Sectors Alba’s Products Alba’s clients Porter’s 5 forces & pestl analysis Alba's Upside & Downside 40
- Slides: 39