1 a What are 3 ways that an


- Slides: 12
1. a. What are 3 ways that an object can accelerate? Speeding up, slowing down, or changing direction
1. b. Describe how a baseball player accelerates as he runs around the bases after hitting a home run. Initially, the player accelerates away from home plate. Upon reaching each base, the player accelerates by changing direction. The player accelerates again when slowing down after touching home plate.
1. c. An ice skater glides around a rink at a constant speed of 2 m/s. Is the skater accelerating? Explain your answer. • Yes. The skater is accelerating by continually changing direction.
2. a. What is the formula used to calculate the acceleration of an object moving in a straight line? • Acceleration = Final Velocity – Initial Velocity Time
2. b. A cyclist’s speed changes from 0 m/s to 15 m/s in 10 seconds. What is the cyclist’s average acceleration? • Acceleration = Final Speed – Initial Speed Time • Acceleration = 15 m/s – 0 m/s 10 sec • Acceleration = 1. 5 m/s 2
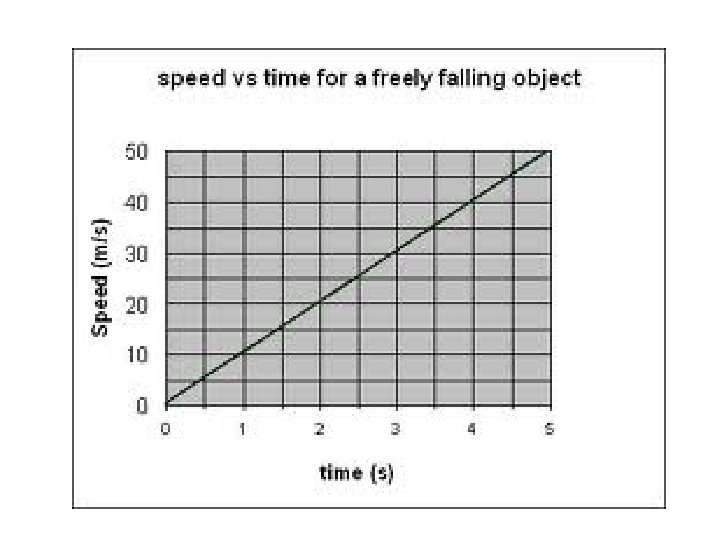
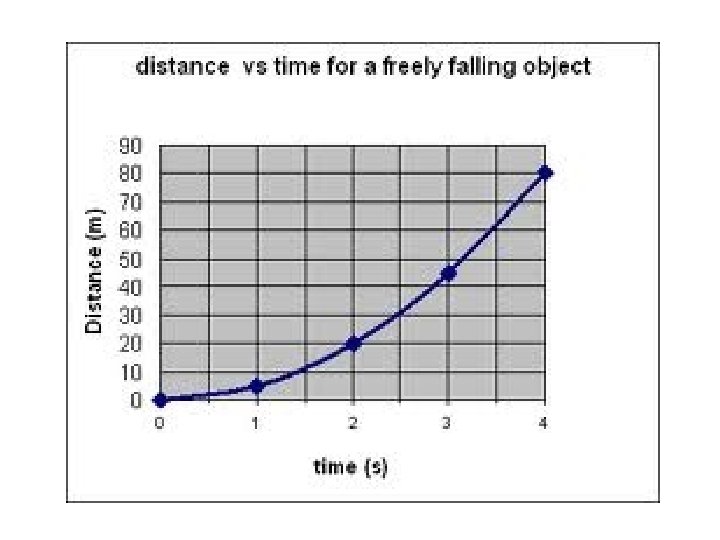
3. a. What types of graphs can you use to analyze the acceleration of an object? • A speed-versus-time graph or a distance-versus-time graph to analyze an object’s acceleration.
3. b. How is an object moving if a slanted, straight line on a speed-versus-time graph represents its motion? • Such a graph means that the object is either accelerating (line slanted upward) or decelerating (line slanted downward) at a constant rate.
3. c. What would a distance-versus-time graph look like for the moving object in part (b)? • A distance-versus-time graph for the moving object would curve upward for acceleration and curve downward for deceleration.
4. A downhill skier reaches the steepest part of a trail. Her speed increases from 9 m/s to 18 m/s in 3 seconds. What is her average acceleration? • Acceleration = Final Speed – Initial Speed Time (18 m/s-9 m/s) / 3 s = 3 m/s 2
5. What is a race car’s average acceleration if its speed changes from 0 m/s to 40 m/s in 4 seconds? Acceleration = Final Speed – Initial Speed Time (40 m/s – 0 m/s) / 4 s = 10 m/s 2