
1 7 Photosynthesis Energy Fixation z Photosynthesis is
- Slides: 34
1. 7 Photosynthesis
Energy Fixation z. Photosynthesis is the process by which green plants make their own food using light energy z. The light energy is captured by the green pigment chlorophyll which is found in chloroplasts z. Light energy is converted into chemical energy in the form of ATP.
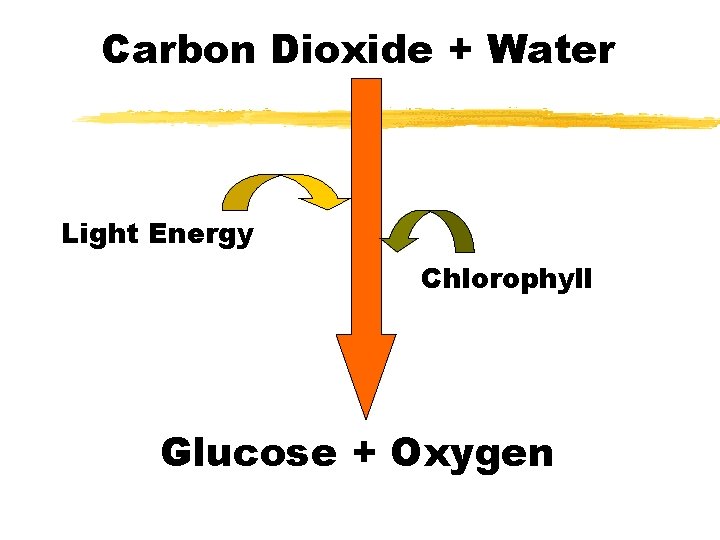
Photosynthesis z Carbohydrates such as glucose are formed during photosynthesis from the raw materials carbon dioxide and water z Light energy and chlorophyll are also required but are not used up therefore are not raw materials z Oxygen is produced as a by-product from the splitting of water (H 2 O) into hydrogen and oxygen
Importance to Animals z. Photosynthesis is needed by a plant to manufacture its own food. v. Why is it important to animals? v[Think about the products]
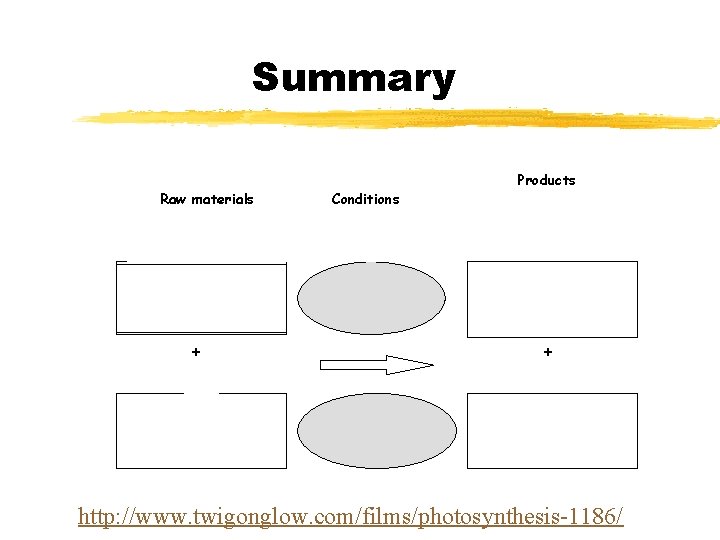
Carbon Dioxide + Water Light Energy Chlorophyll Glucose + Oxygen
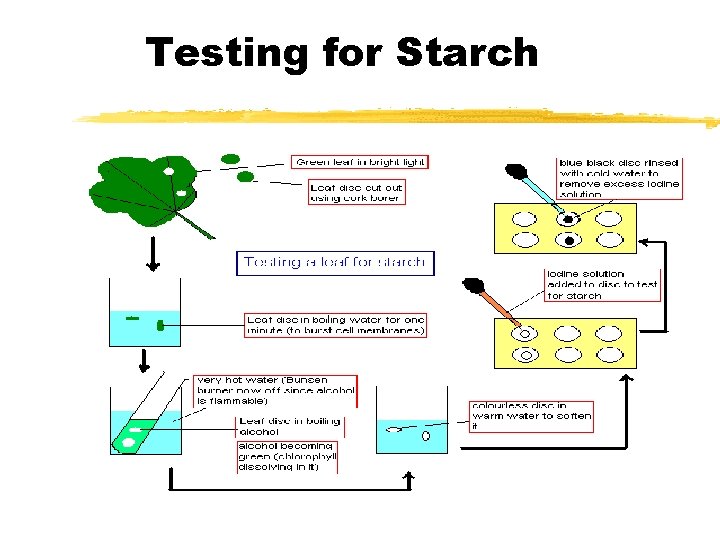
Testing for Starch
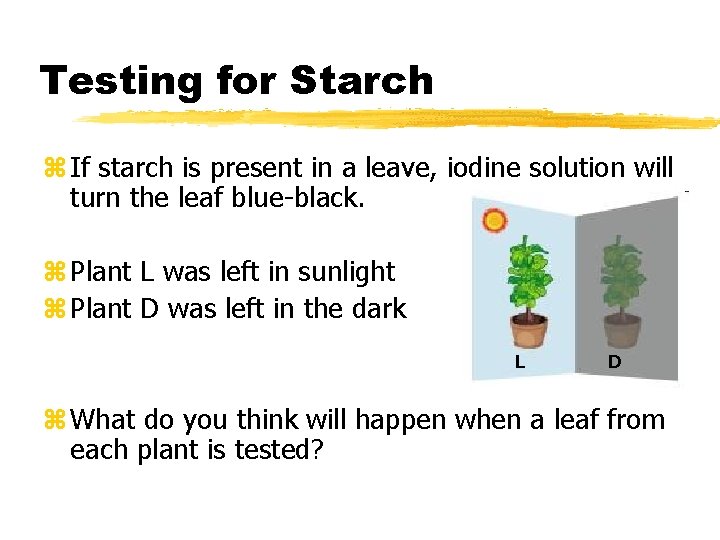
Testing for Starch z If starch is present in a leave, iodine solution will turn the leaf blue-black. z Plant L was left in sunlight z Plant D was left in the dark L D z What do you think will happen when a leaf from each plant is tested?
Animation of method z. Watch this clip if you need extra help with the method. z. Starch testing animation
Photosynthesis z. Glucose formed during photosynthesis is used by the plant cells to carry out respiration to provide energy for all the cells reactions z. Some glucose is converted to starch for storage z. Some glucose is converted to cellulose to build cell walls
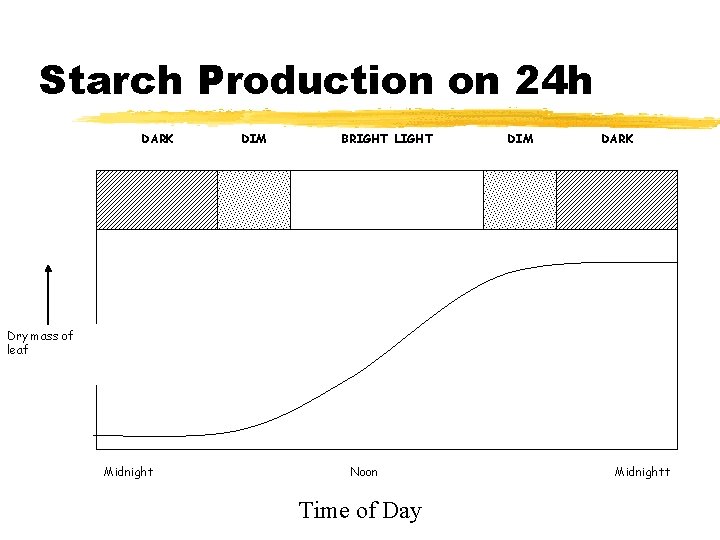
Starch Production on 24 h DARK DIM BRIGHT LIGHT DIM DARK Dry mass of leaf Midnight Noon Time of Day Midnightt
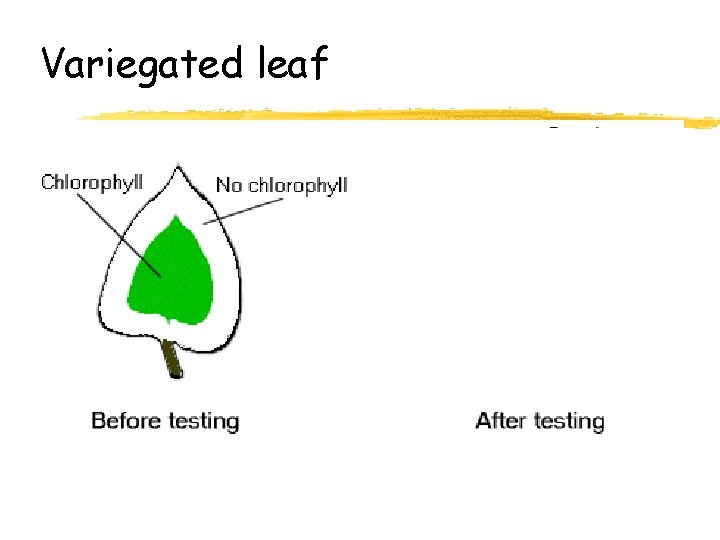
Variegated leaf
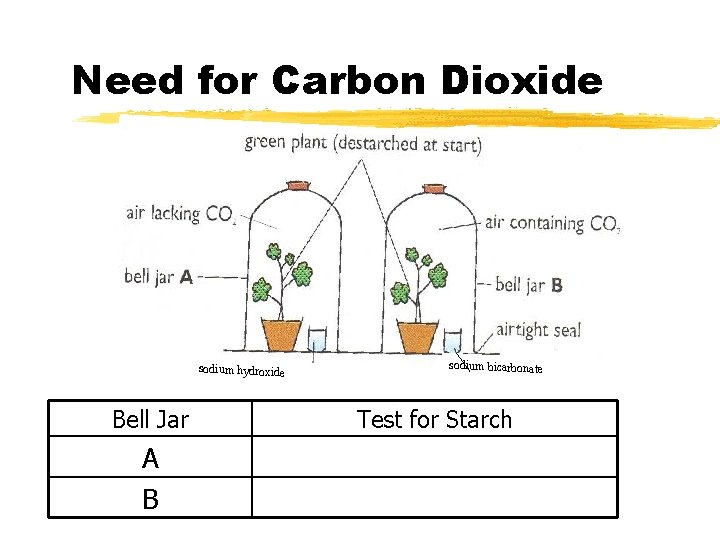
Need for Carbon Dioxide sodium hydroxide Bell Jar A B sodium bicarbonate Test for Starch
Summary Raw materials + Conditions Products + http: //www. twigonglow. com/films/photosynthesis-1186/
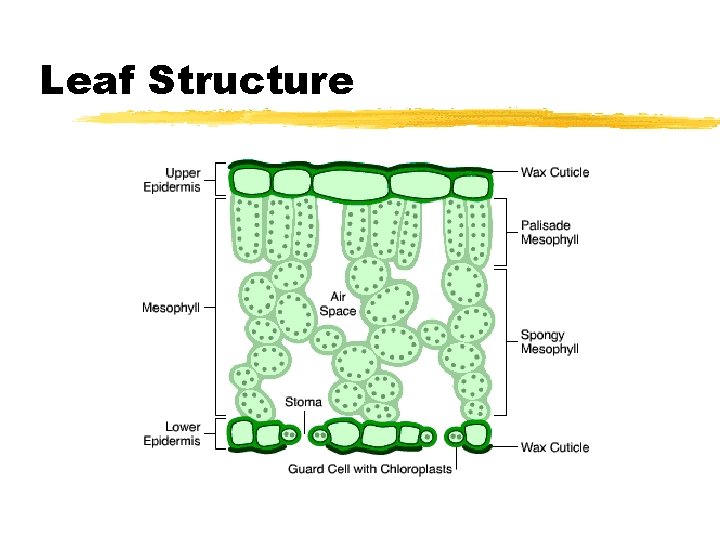
Leaf Structure
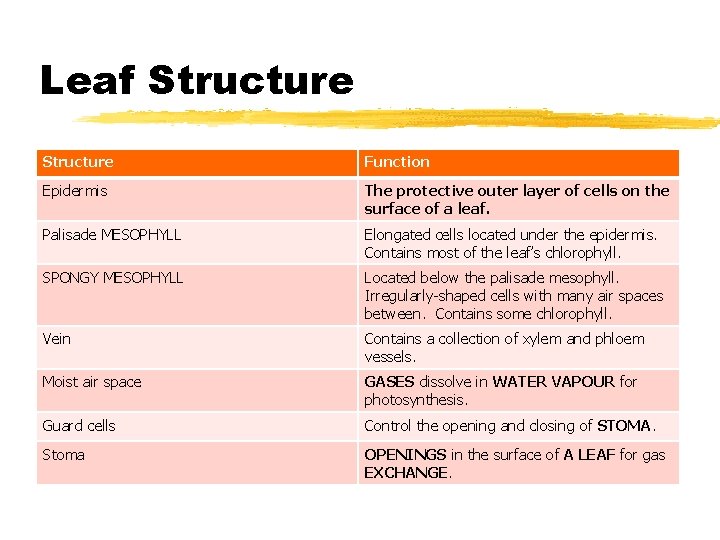
Leaf Structure Function Epidermis The protective outer layer of cells on the surface of a leaf. Palisade MESOPHYLL Elongated cells located under the epidermis. Contains most of the leaf’s chlorophyll. SPONGY MESOPHYLL Located below the palisade mesophyll. Irregularly-shaped cells with many air spaces between. Contains some chlorophyll. Vein Contains a collection of xylem and phloem vessels. Moist air space GASES dissolve in WATER VAPOUR for photosynthesis. Guard cells Control the opening and closing of STOMA. Stoma OPENINGS in the surface of A LEAF for gas EXCHANGE.
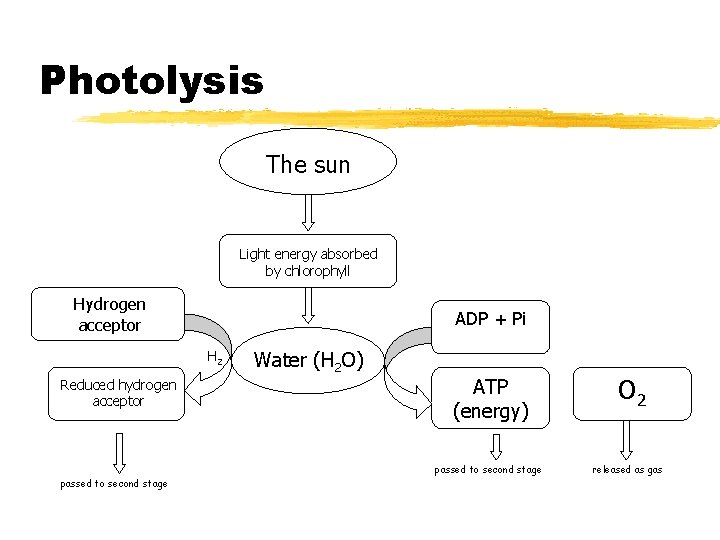
Photolysis zhttp: //www. twigonglow. com/films/photos ynthesis-1186/ z. The first stage of photosynthesis is photolysis - the splitting of water z. Light energy is captured by the chlorophyll in chloroplasts and used to split water into oxygen gas and hydrogen z. The oxygen diffuses out of the cell.
Photolysis The sun Light energy absorbed by chlorophyll Hydrogen acceptor ADP + Pi H 2 Reduced hydrogen acceptor Water (H 2 O) ATP (energy) passed to second stage O 2 released as gas
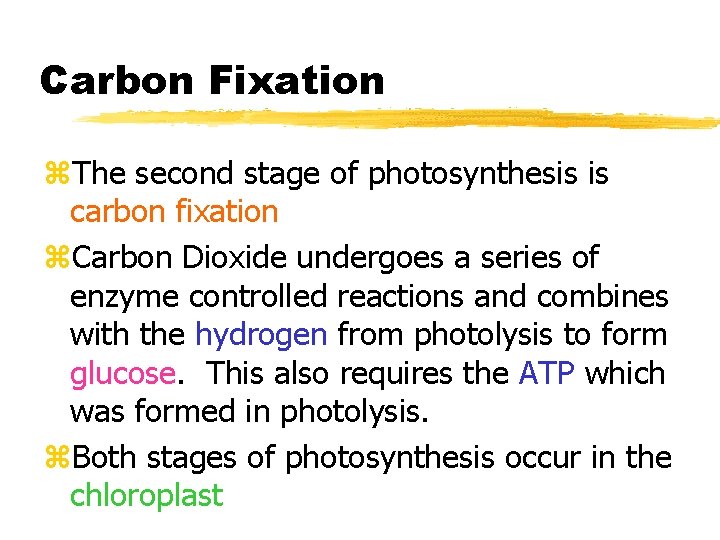
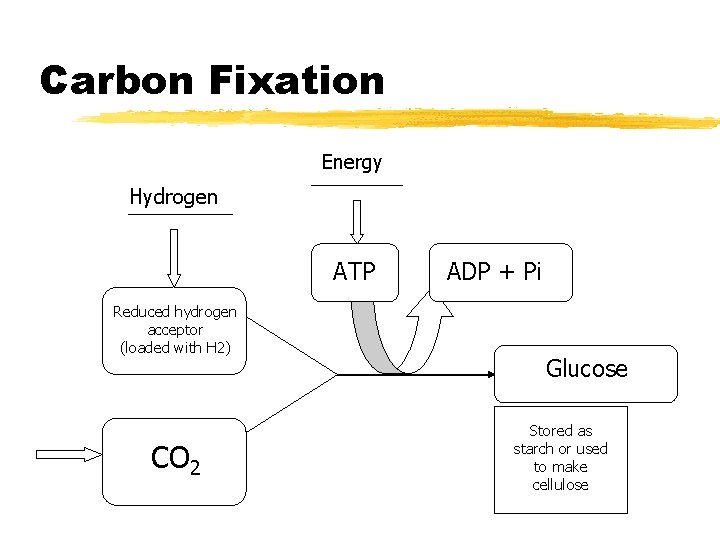
Carbon Fixation z. The second stage of photosynthesis is carbon fixation z. Carbon Dioxide undergoes a series of enzyme controlled reactions and combines with the hydrogen from photolysis to form glucose. This also requires the ATP which was formed in photolysis. z. Both stages of photosynthesis occur in the chloroplast
Carbon Fixation Energy Hydrogen ATP Reduced hydrogen acceptor (loaded with H 2) CO 2 ADP + Pi Glucose Stored as starch or used to make cellulose
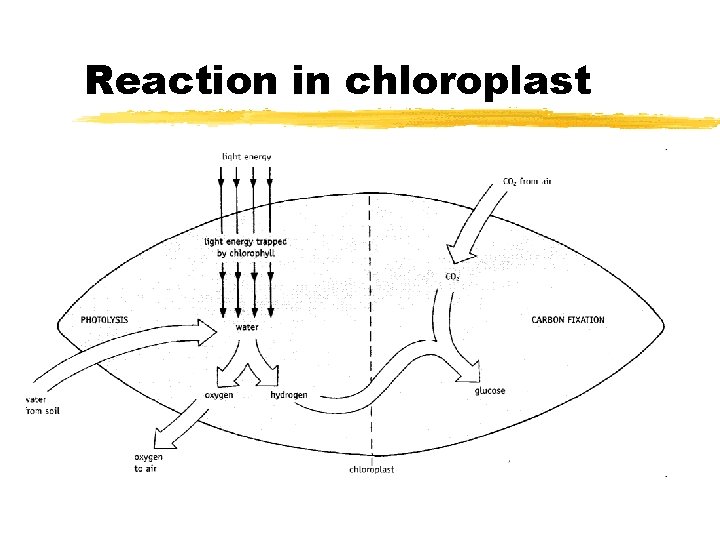
Reaction in chloroplast
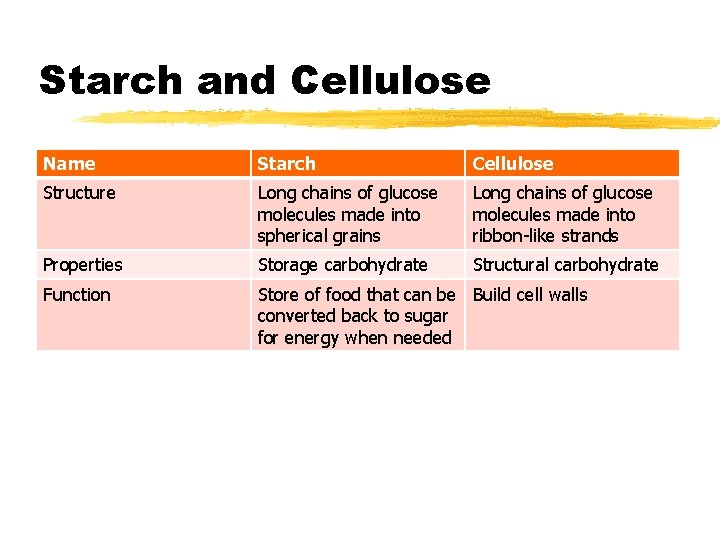
Starch and Cellulose Name Starch Cellulose Structure Long chains of glucose molecules made into spherical grains Long chains of glucose molecules made into ribbon-like strands Properties Storage carbohydrate Structural carbohydrate Function Store of food that can be Build cell walls converted back to sugar for energy when needed
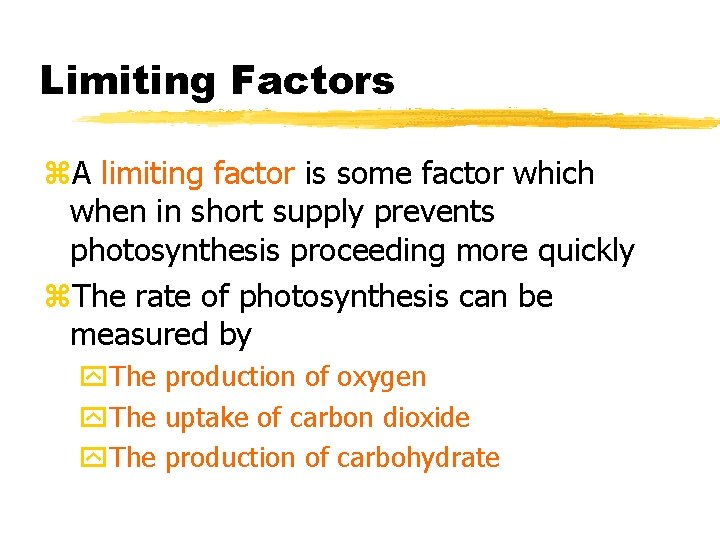
Limiting Factors z. A limiting factor is some factor which when in short supply prevents photosynthesis proceeding more quickly z. The rate of photosynthesis can be measured by y. The production of oxygen y. The uptake of carbon dioxide y. The production of carbohydrate
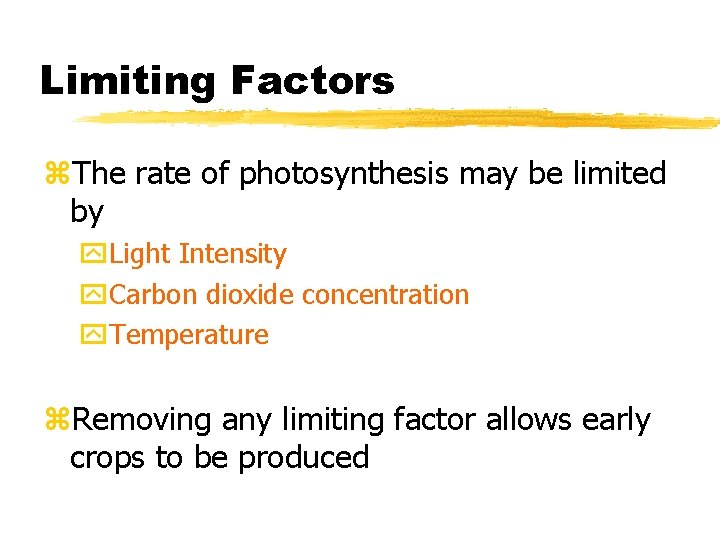
Limiting Factors z. The rate of photosynthesis may be limited by y. Light Intensity y. Carbon dioxide concentration y. Temperature z. Removing any limiting factor allows early crops to be produced
The Elodea Bubbler z Elodea is a type of pondweed. z It is a good plant to use to study the effects that limiting light has on photosynthesis z Use this link to perform a virtual version of this experiment or look at the demo set up to answer the questions. z Use Multimedia Science to collect data
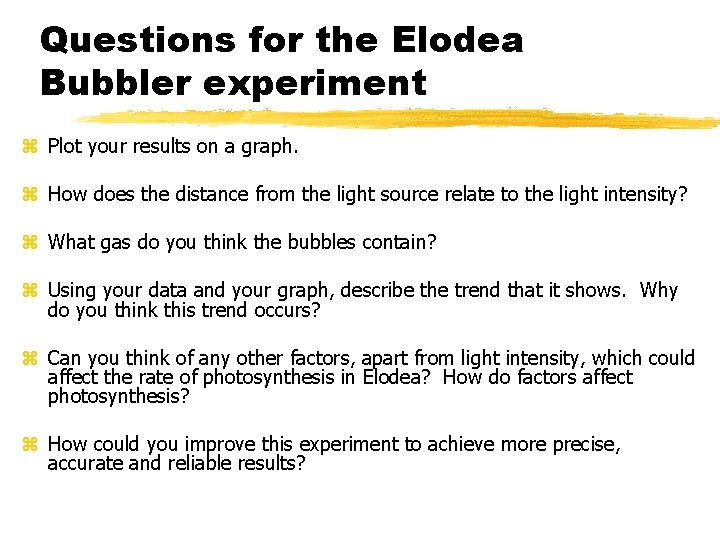
Questions for the Elodea Bubbler experiment z Plot your results on a graph. z How does the distance from the light source relate to the light intensity? z What gas do you think the bubbles contain? z Using your data and your graph, describe the trend that it shows. Why do you think this trend occurs? z Can you think of any other factors, apart from light intensity, which could affect the rate of photosynthesis in Elodea? How do factors affect photosynthesis? z How could you improve this experiment to achieve more precise, accurate and reliable results?
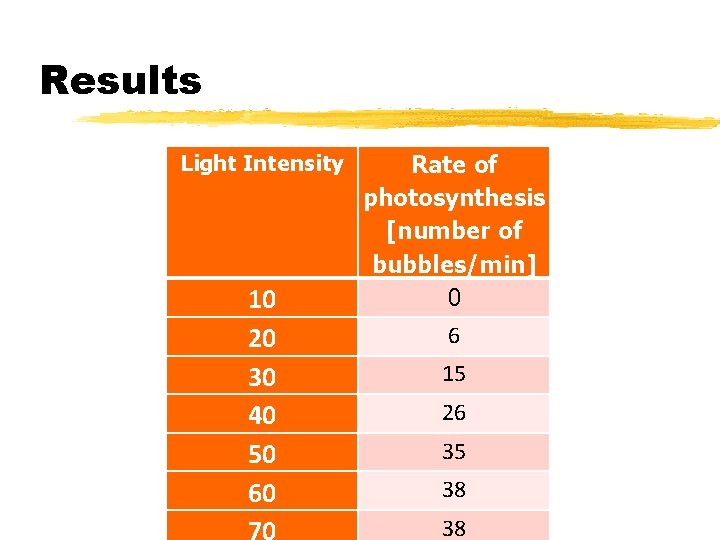
Results Light Intensity 10 20 30 40 50 60 Rate of photosynthesis [number of bubbles/min] 0 6 15 26 35 38 38
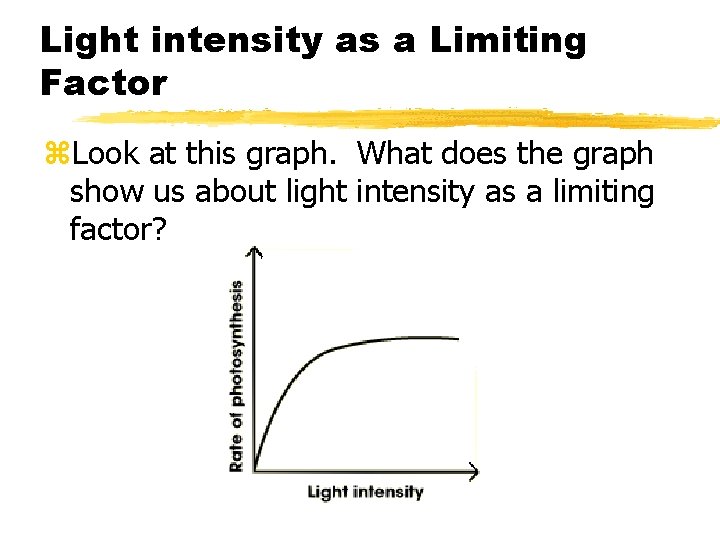
Light intensity as a Limiting Factor z. Look at this graph. What does the graph show us about light intensity as a limiting factor?
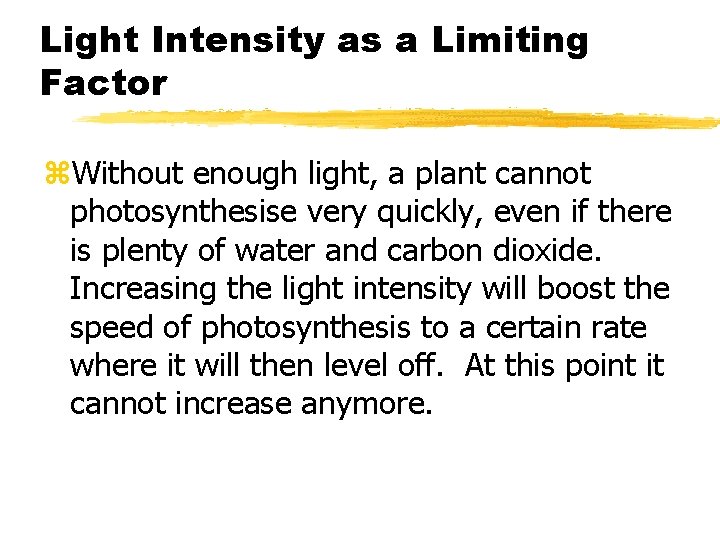
Light Intensity as a Limiting Factor z. Without enough light, a plant cannot photosynthesise very quickly, even if there is plenty of water and carbon dioxide. Increasing the light intensity will boost the speed of photosynthesis to a certain rate where it will then level off. At this point it cannot increase anymore.
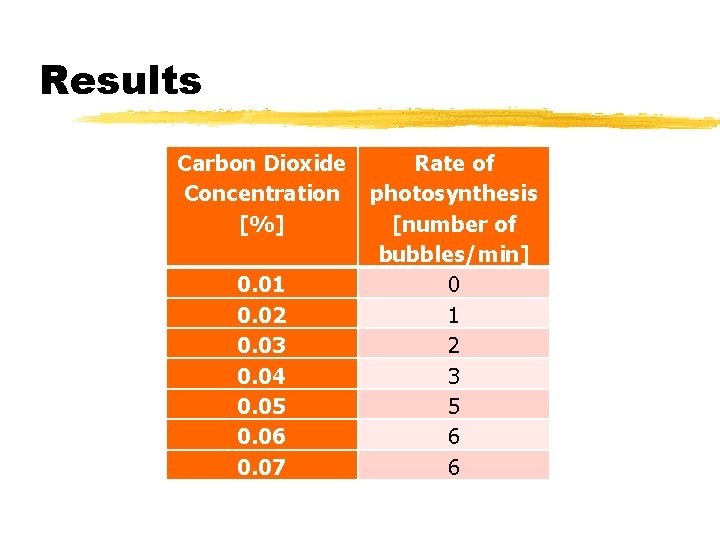
Results Carbon Dioxide Concentration [%] 0. 01 0. 02 0. 03 0. 04 0. 05 0. 06 0. 07 Rate of photosynthesis [number of bubbles/min] 0 1 2 3 5 6 6
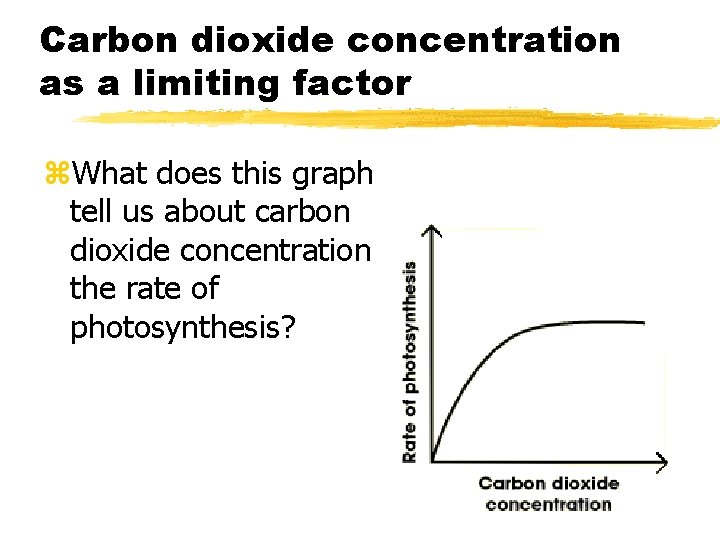
Carbon dioxide concentration as a limiting factor z. What does this graph tell us about carbon dioxide concentration on the rate of photosynthesis?
Carbon dioxide concentration as a limiting factor z. Sometimes photosynthesis is limited by the concentration of carbon dioxide in the air. Even if there is plenty of light, a plant cannot photosynthesise if there is not enough carbon dioxide available.
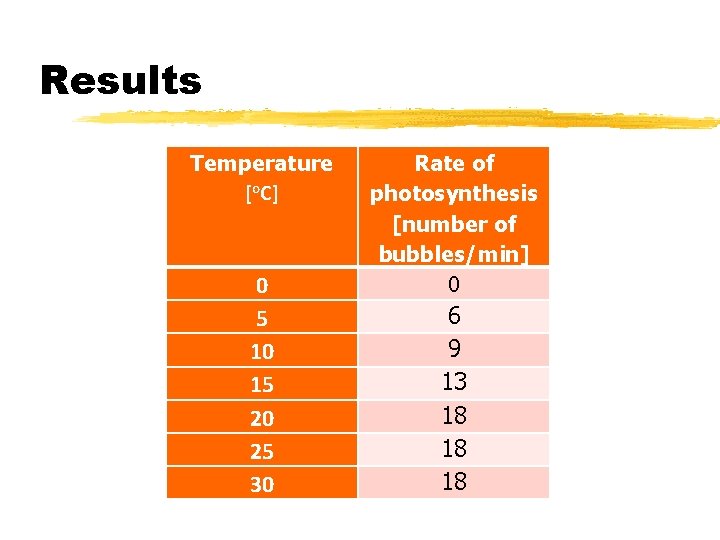
Results Temperature [o. C] 0 5 10 15 20 25 30 Rate of photosynthesis [number of bubbles/min] 0 6 9 13 18 18 18
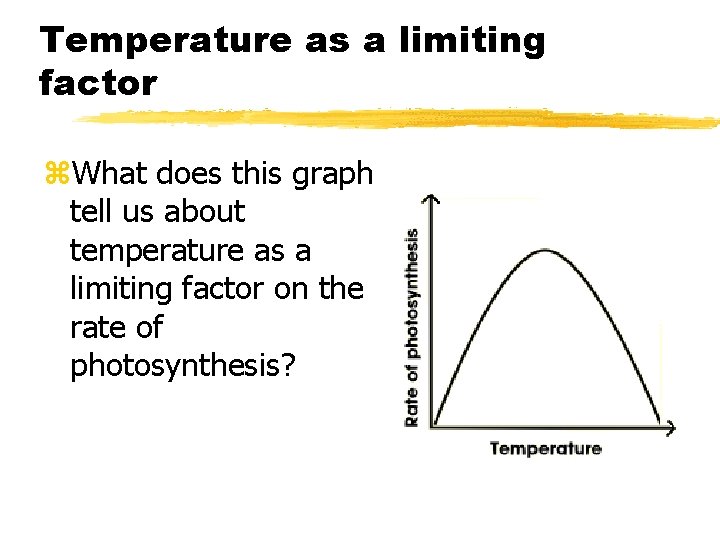
Temperature as a limiting factor z. What does this graph tell us about temperature as a limiting factor on the rate of photosynthesis?
Temperature as a limiting factor z. If it gets too cold, the rate of photosynthesis will decrease. Plants cannot photosynthesise if it gets too hot.