1 5 Graphs of Sine and Cosine Functions


 it takes")


")


- Slides: 21
1. 5 Graphs of Sine and Cosine Functions Part 1
Periodic Graphs • Graphs that repeat infinitely in intervals are called periodic • The most common periodic graphs are the graphs of the trigonometric functions • Sine, cosine, tangent, cosecant, and cotangent
The Graph of y = sin x x Find Points by Plugging in x values for the equation and solving for y x y y
The Sine Graph Oscillation-one complete “cycle” of the graph Period-”time” (horizontal distance) it takes the graph to complete one oscillation Amplitude-the furthest vertical distance from the center
The Sine Graph • We think of the sine graph as starting at an x-value of zero • It begins at a y-value of zero • It then moves up the distance of its amplitude • Next it moves back down to the x-axis • Then it moves down the distance of its amplitude • The it completes an oscillation by moving back up the x-axis
The Sine Graph • The period of the sine graph is… 2Π • So the horizontal length of each “piece” of the sine graph is… 2Π • The amplitude of the sine graph is…(think about the values of sine) 1
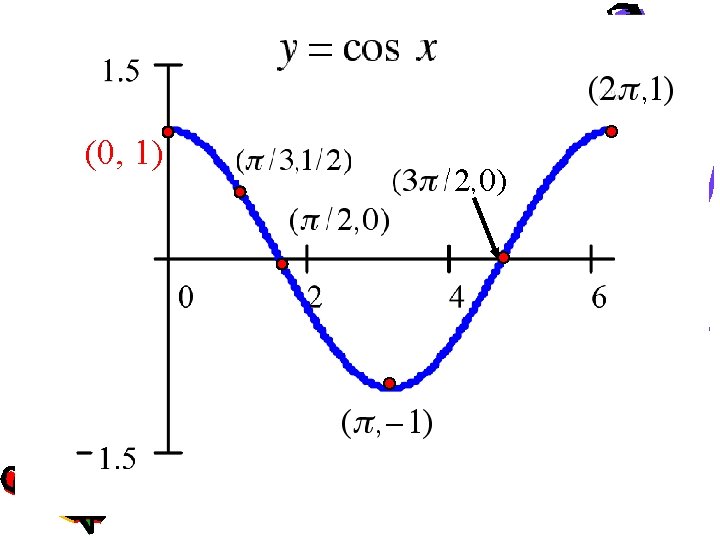
The Graph of y = cos x x Find Points by Plugging in x values for the equation and solving for y x yy
The Cosine Graph • The cosine graph is the same as the sine graph, only it has been shifted horizontally • Same period • Same amplitude
The Cosine Graph • Same period • Same amplitude • The “starting point” is still an x-value of zero, but is now a y-value of 1
Properties of Sine and Cosine Functions The graphs of y = sin x and y = cos x have similar properties: 1. The domain is the set of real numbers. 2. The range is the set of y values such that . 3. The maximum value is 1 and the minimum value is – 1. 4. The graph is a smooth curve. 5. Each function cycles through all the values of the range over an x-interval of. 6. The cycle repeats itself indefinitely in both directions of the x-axis.
Sine and Cosine Graphs • We have thus far only looked at basic versions. • We will get into transformations soon.
Graph of the Sine Function by hand: To sketch the graph of y = sin x by hand, it helps to first locate the FIVE key points. These are the maximum points, the minimum points, and the intercepts. x 0 sin x 0 1 0 -1 0 Then, connect the points with a smooth curve that extends in both directions beyond the five points. A single cycle is called a period. y Maximum Intercept y = sin x Intercept Minimum x
Graph of the Cosine Function To sketch the graph of y = cos x first locate the FIVE key points. These are the maximum points, the minimum points, and the intercepts. x 0 cos x 1 0 -1 0 1 Then, connect the points with a smooth curve that extends in both directions. A single cycle is called a period. y = cos x y Maximum x Intercept Minimum
Example: Sketch the graph of y = 3 cos x on the interval [– , 4 ]. Note: this indicates that the y-values will have 3 times the magnitude of y = cos x. Divide the interval [0, 2 ] into four equal parts to get the five key points. Graph one cycle, then repeat the cycle over the interval. x y = 3 cos x (0, 3) 0 3 -3 0 0 2 3 max x-int min x-int max y ( , 3) x ( ( , 0) ( , – 3) , 0)
Now…. . • TRANSFORMATIONS
The effect of changing the value of a, b, c, or d in equations of the form: y = a sin(bx – c) + d y = a cos(bx – c) + d The constant a acts as a scaling factor (a vertical stretch or shrink)
The amplitude of y = a sin x (or y = a cos x) is half the distance between the maximum and minimum values of the function. amplitude = |a| If |a| > 1, the amplitude stretches the graph vertically. If 0 < |a| < 1, the amplitude shrinks the graph vertically. If a < 0, the graph is reflected in the x-axis. y The range of the graph will be: –a ≤ y ≤ a y = 2 sin x x y= sin x y = – 4 sin x reflection of y = 4 sin x
The period of a function is the x interval needed for the function to complete one cycle. For b 0, the period of y = a sin bx is. For b < 0, the period of y = a cos bx is also . If b > 1, the graph of the function is shrunk horizontally. y period: 2 period: x If 0 < b < 1, the graph of the function is stretched horizontally. y period: 2 x period: 4
Homework: • Pg 166 • Exercises 1 - 14