1 3 Continuity End Behavior and Limits Limits

1. 3 – Continuity, End Behavior, and Limits

Limits: - Approaching a value without necessarily ever reaching it.
 of the function increases or decreases")
Non-removable Discontinuities Infinite Discontinuity: when the limit (y-value) of the function increases or decreases without bound as x approaches c from the left and right.
 of the function as x approaches c")
Non-removable Discontinuities Jump Discontinuity: the limits (y-values) of the function as x approaches c from the right and left approach two DIFFERENT values.

Removable Discontinuities the function is continuous everywhere except for at x = c.

***Note: - A limit can exist even if the value of the function at c is undefined. - The limit does not have to be the same as value of the function at c.
 is continuous at x = c if it")
Testing for Continuity: A function f(x) is continuous at x = c if it satisfies ALL the following 3 conditions: 1) f(x) is defined at c. So f(c) exists. 2) f(x) approaches the same value from both sides of c. So exists.
 The value that f(x) approaches from both sides of c")
Testing for Continuity: 3) The value that f(x) approaches from both sides of c is f(c). So.

Example 1: Determine whether continuous at continuity test. 1. Does exist? is. Justify using the

Example 1: 2. Does 3. Does exist ? ?

Example 2: Determine whether the function is continuous at x = 1. Justify using the continuity test. If discontinuous, identify the type of discontinuity as infinite, jump, or removable.

Example 3: Determine whether the function is continuous at x = 2. Justify using the continuity test. If discontinuous, identify the type of discontinuity as infinite, jump, or removable.

Example 4:

Intermediate Value Theorem

Intermediate Value Theorem Real-life example: When Bobby turned 6, he was 3 ft tall. When he turned 7, he was 3 1/2 ft tall. The IVT says that there had to be an age in between 6 and 7 that he was 3. 25 ft. He couldn’t skip any height in between 3 ft and 3 1/2 ft.

Example 5: Determine between which consecutive integers the real zeros of are located on the interval [– 2, 2]. Can use graph or table.

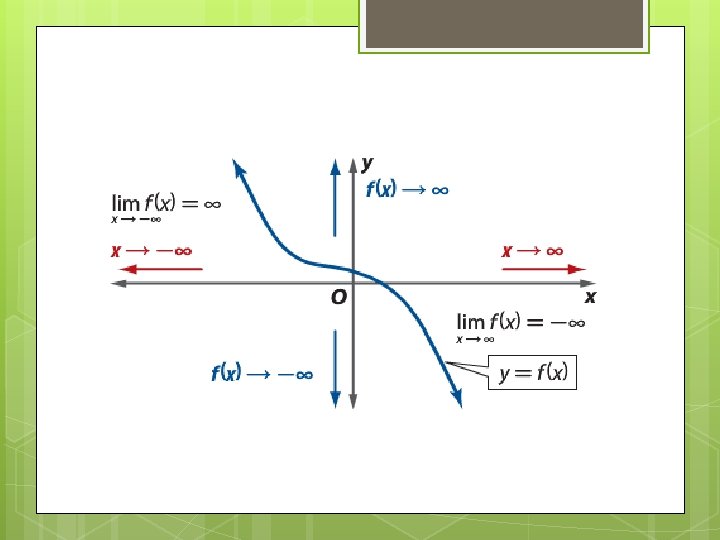
End Behavior: Left-End Behavior Right-End Behavior
 = x 3 – x 2 –")
Example 6: Use the graph of f(x) = x 3 – x 2 – 4 x + 4 to describe its end behavior.

Example 7: Use the graph of to describe its end behavior.
- Slides: 20