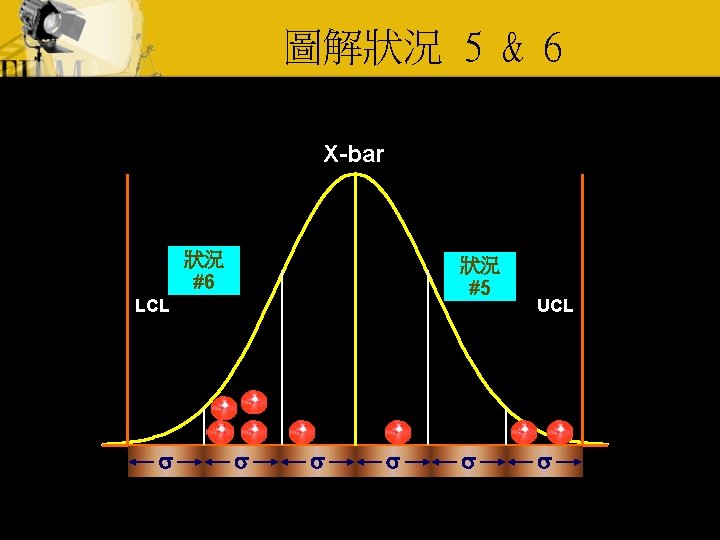
1 2 Xbar LCL 2 UCL 1 s

=0.")
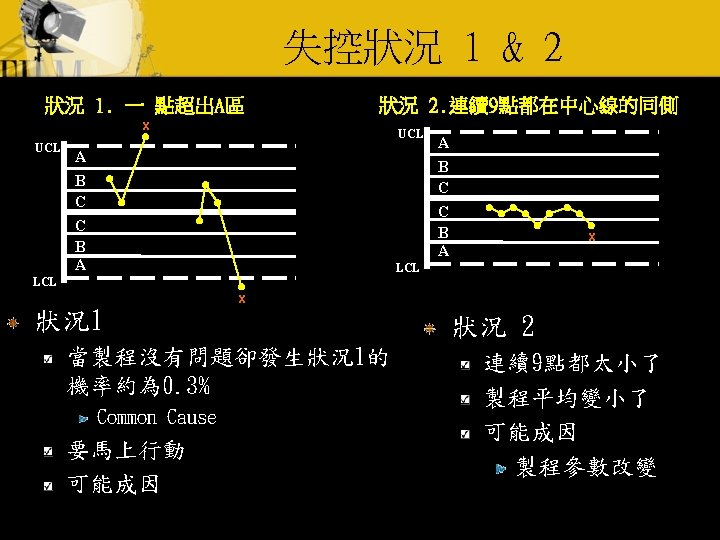
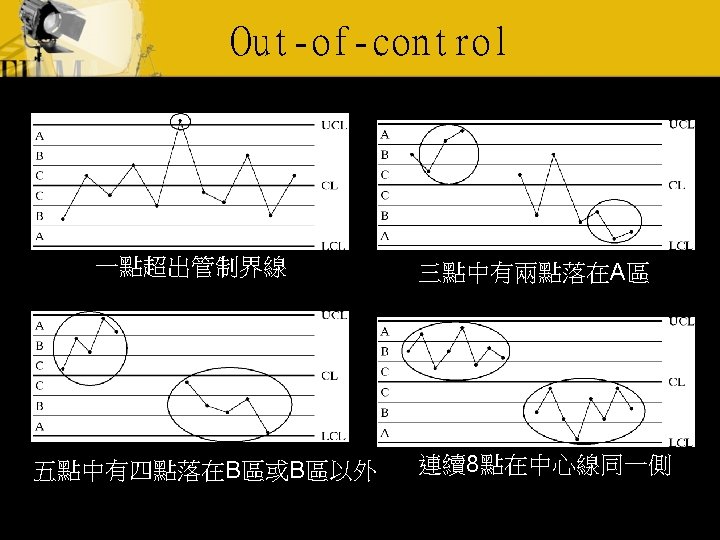
圖解失控狀況1及 2 X-bar LCL 狀況 #2 UCL 狀況 #1 s s Prob(All 9 Xi<Mean)=0. 59=0. 001953 s s Prob(Z>3)=0. 00135
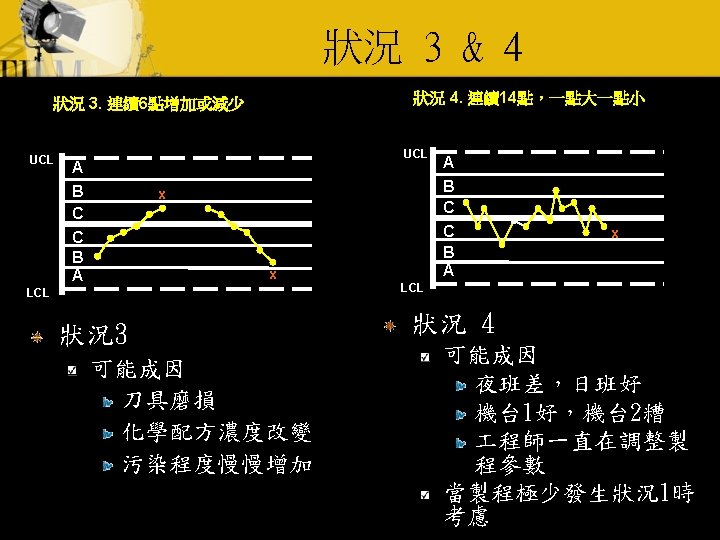

圖解狀況 3 X-bar 狀況 #3 LCL s UCL s s s

圖解狀況 4 X-bar 狀況 #4 LCL s UCL s s s

Example – Constructing Charts In Minitab, open sample worksheet CCVar. mtw From the menu select Stat > Control Charts > Xbar-R… Select data columns C 1 -C 5

Perform Control Chart Tests…

X-bar & R Chart – Minitab Output

Recalculating Control Limits After identifying the cause for the out-of-control points they can be removed from the control limit calculations In the previous example points 9, 11, & 24 can be removed from the control limit calculations Press the Estimate button on the X-bar & R chart form and enter the offending data ?

Modified Minitab Output Notice the small changes in the control limits:

Existing Limits Minitab can also plot and evaluate the data if historical data is known and verified to be accurate Enter the historical data in the main form:

Historical Data When analyzed with historical limits, notice the number of out of control points, now:
- Slides: 21