1 2 Geographers Tools Big Idea Geographers use

1. 2 Geographer’s Tools Big Idea: Geographer’s use a multitude of different maps and graphs to organize our world.

Section 2 Discussion Questions • How do geographers and mapmakers organize our world? • What kinds of special maps do geographers use? • How do geographers use climate graphs and population pyramids?

Organizing the Globe vs. Map – map- is a flat drawing of the earth or a place and shows its different features. – globe- is a three-dimensional (3 D) scale model of Earth. • *There are seven continents *There are five oceans •

The Earth Divided • The Globes and Maps are divided by three major lines going across and updown • *The equator is across and at 0° • *The Prime Meridian is up-down 0° • *International Date Line is up and down 180° • *Northern, Eastern, Southern & Western hemispheres Eastern Hemisphere Western Hemisphere Equator P r i m e Northern Hemisphere m e Equator r i d i Southern Hemisphere a n International Date Line

Types of Map Projection • Map projections-how globes are transferred to a flat surface • Most common – cylindrical, – conic – flat-plane.

Cylindrical • Most Common: Mercator map • Image a piece of paper wrapped around the equator. • Land shape is accurate • Land size is inaccurate: larger near the high latitudes (north pole Greenland)/ smaller near the lower latitudes (south pole). • Navigators use it because it shows correct direction and shape of landforms

Conic • Imagine a paper has been wrapped around a globe like a cone hat. • Where the paper touches the globe are the most accurate depictions shapes and sizes of landmasses: United States and Russia • Useful when studying a location that is far spanning in terms of east to west.

Flat-Plane • Imagine a paper only touching the globe at one point. • True size, but distorts shapes • True directions for airplane pilots and ship navigators.

Review of Map Projections D. Cylindrical-landmasses larger toward north pole…Mercator…true direction and shape E. Conic-accurate where lines touch the cone…almost true shape and size F. Flat-plane- true size… poor shapes G. Great Circle Route-shortest distance between two places…confusing

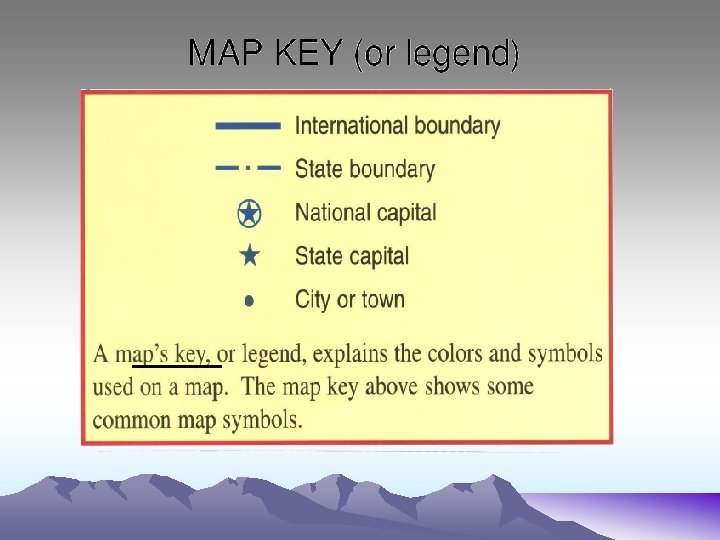
Map Components Title Insert maps Grid Compass Key or Legend Scale Kinds of Borders

Title The title of a map indicates what the map is about. This is always the first part of the map you should look at. What is this map about?

Compass Rose Tells you directions when you are lost. The needle of a compass must always point north to work right. Cardinal Directions. These are the four primary directions of the compass. Intermediate Directions - These are your secondary directions of the compass. They are made up from a combination of the primary directions. Northwest Southwest Northeast Southeast

Insert maps • Insert maps are a mini map placed in the corner of a page to show a location that would not be able to be seen. Insert map examples

Scale By using maps we can also tell the distance from one place to another. Maps are made in a way so that we can see an entire area. When drawn the drawings are smaller then they actually are in real life. This mean if you need to measure distance you will use a scale that tells you how many miles away something is. Now lets learn about scales.

Grids • A grid is a pattern of lines that can help you find a location on a map. – – Latitude (parallels run E-W & measures N or S of the Equator) longitude (meridians run N-S & measure E-W of the Prime Meridian )

Borders Are what you use to divide land areas on a map. They can be made from physical features or man-made lines agreed on by humans. Physical Borders – Mountains – Grasslands – Desserts – Bodies of water • Lakes • Rivers • Oceans • Gulfs Man-made borders - State line borders - Lines dividing countries - City borders -County borders

How are different types of maps distinguished?

Physical Maps • Physical maps show the physical features of the Earth. • Physical maps do not contain made features. • For example, a physical map would be a map of what you would see if you were looking down on Earth from space.

When you look at this map, what do you see? Notice you do not see state borders or city markings. These divisions are created by people. What you do see though are physical feature landmarks like mountains, plains, desserts, beaches, lakes, oceans and rivers

Political Maps Unlike physical maps, political maps show humans interaction with the landscape. For example, city names, roads, country borders, etc. are all part of political maps. Political maps change frequently and must be redrawn often. A political map of the world that is 50 years old is no longer accurate.

Topographic/ Contour Maps • Topographic Maps - include contour lines to show the shape and elevation of an area. Lines that are close together show steep terrain, and lines that are far apart show flat terrain. Many hikers use topographic maps, especially in areas where there are no roads with signs. Geologists depend on topographic maps to record the types of rocks. Engineers use topographic maps when they are planning roads, buildings or other human–made structures.

Climate Map • The climate of a place is the weather it has season by season, year after year • Rainfall and temperature are climate’s main ingredients • Climate is affected by elevation, distance from the ocean, and latitude

World Climate Map

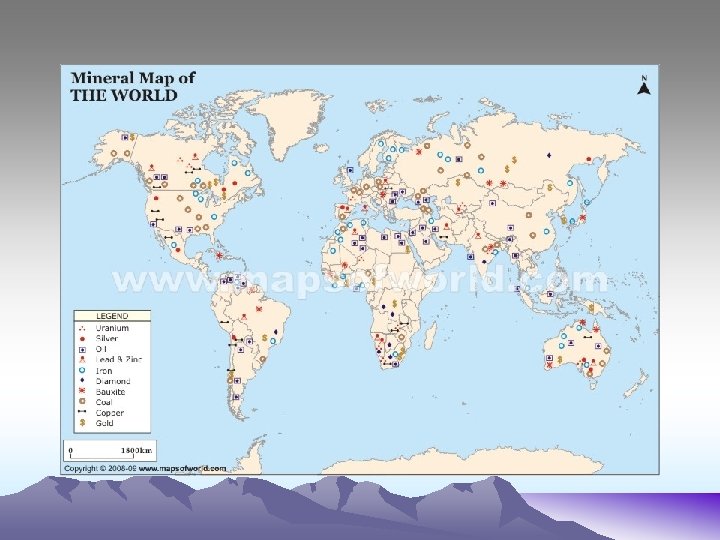
Thematic Maps • • • These maps show land is being used. This might refer to: vegetation crops being grown forest vs. Agriculture mines and wells city zoning.

Elevation Maps that show elevation change by using color or shading.

How Maps Show History • All maps show history in some way shape or form. They can show land moves and changes over time, how populations change, or how a nation grows.

Types of Maps 1. 2. 3. 4. 5. 6. This map represents a small area with lots of detail. It has contour lines as well as natural and man-made features. ________ This map uses colors to show height above sea level. ______________ These colorful maps show lines that people use to divide countries and states. They also show major cities. ___________ These maps show physical features on the Earth like rivers, mountains, and deserts. ______________ These maps show land is being used. For example, they might show which crops are being grown or what animals are being raised. ____________ These maps show climate regions. __________ Political Elevation Topographic/ Contour Thematic Climate Physical
 • Computer system used by geographers • Displays locations and")
GIS (Geographic Information Systems) • Computer system used by geographers • Displays locations and their features • Saves data of an area in layers ( population information, buildings, and streets)

V. Climate Graphs and Population Pyramids-Page 19 Climate Graphs • • Average temp & precipitation One side temp One side rainfall Bottom months Population pyramid • • • Pop of males and females Left side male Right side female Percentage of pop on the bottom Age of pop along the side – Bottom is the youth – Top is elderly
- Slides: 31