1 2 FUNCTIONS AND THEIR PROPERTIES DAY 1
")


- Slides: 15
1. 2 – FUNCTIONS AND THEIR PROPERTIES (DAY 1)
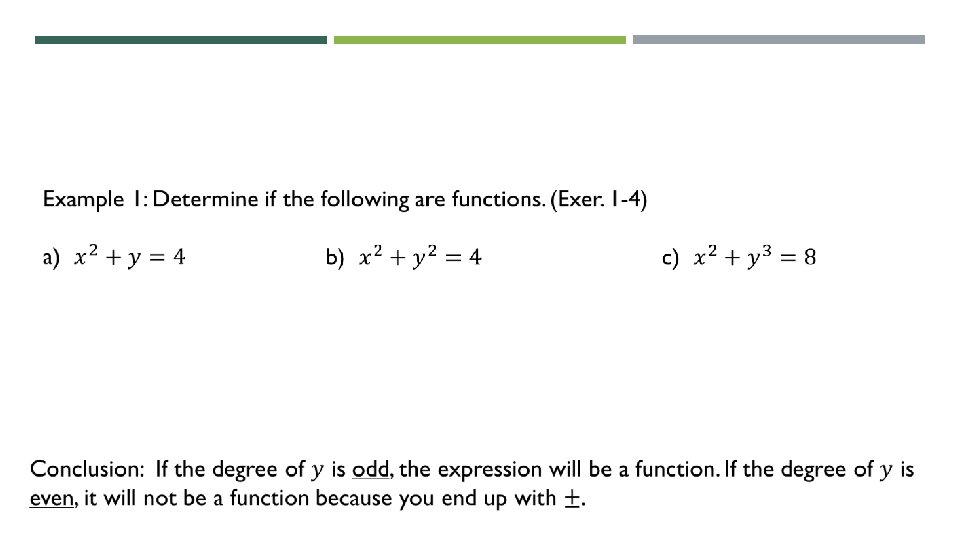
I. Definitions A. B. C. D. Domain – set of first elements in a relation; input values; x-values. Range – set of second elements in a relation; output values; y-values. Relation – set of ordered pairs Function – a relation where for each domain value, there is a unique y-value (domain does not repeat.
You can also look at the graph to see if it’s a function using the vertical line test. If the graph crosses any vertical line more than once, it is not a function. Example 2: Use the vertical line test to determine whether the curve is the graph of a function (Exer. 5 -8) a) b) c)
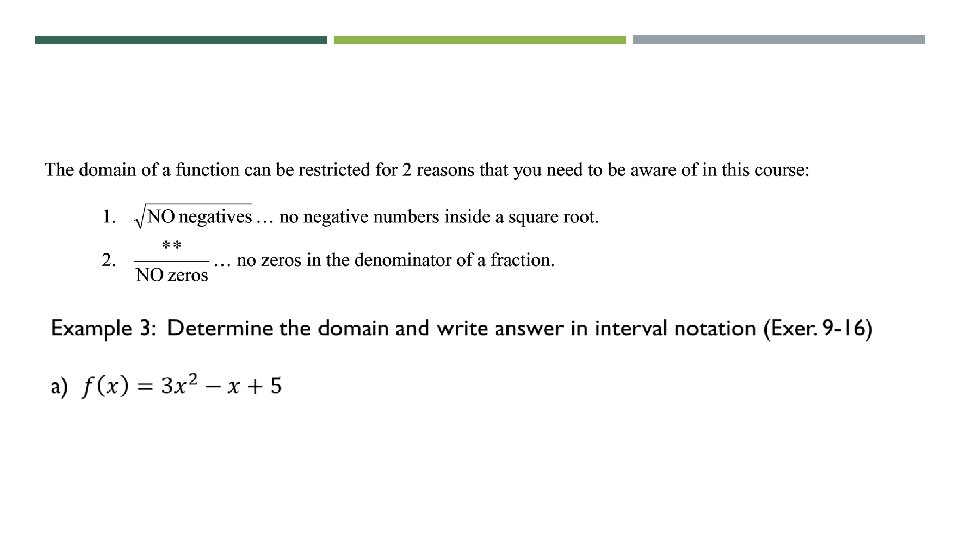
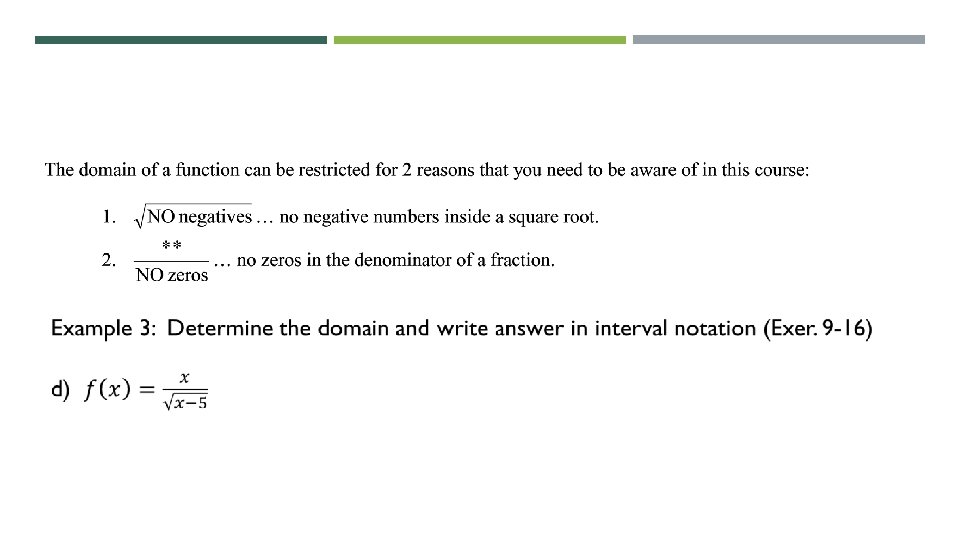
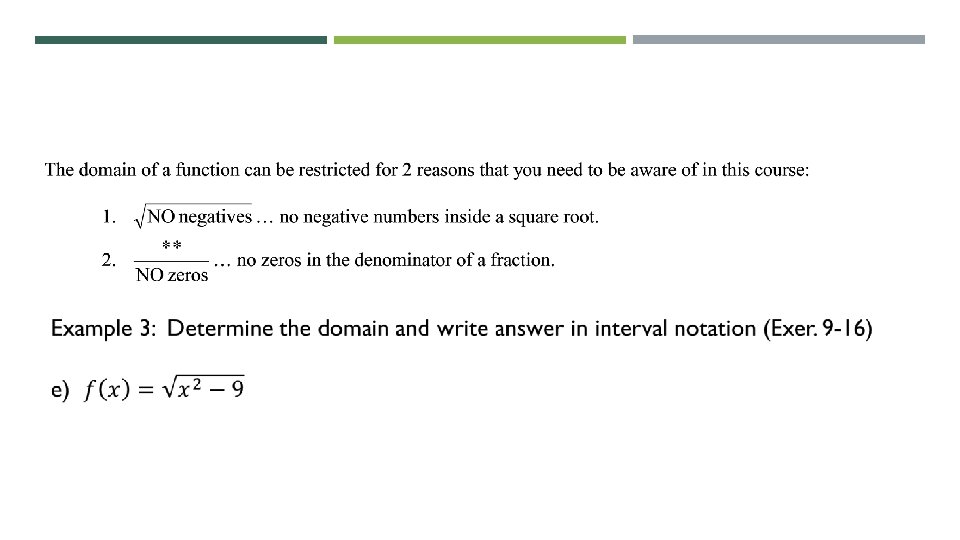
To find the range, look at the graph of the function. Look at the y-values.
To find the range, look at the graph of the function. Look at the y-values.
Continuity A function is continuous at a point if the graph does not come apart at that point. non-removable discontinuity
Increasing/Decreasing Functions Read the graph from LEFT to RIGHT. Make sure you are looking at x-values!!! Example 5: Identify where the graph is increasing, decreasing, or constant. (Exer. 25 -3 a) b)
Identifying Local Extrema Maximum: occurs when function changes from increasing to decreasing. Minimum: occurs when function changes from decreasing to increasing. Example 6: State whether each labeled point is a local min, local max, or neither. a) b)
Homework: Pg. 102 problems 1 -34