1 1 Discretionary and Essential Expenses1 OBJECTIVES Identify

1 -1 Discretionary and Essential Expenses-1 OBJECTIVES Identify the difference between essential and discretionary expenses. Determine the mean, median, and mode of a data set. Use sigma notation to represent and determine the mean of a data set. Slide 1

1 -1 Discretionary and Essential Expenses-2 OBJECTIVES Create and interpret a frequency distribution table. Determine the mean, median, and mode of a data set presented in a frequency distribution table. Slide 2

Key Terms • • gross income disposable income essential expense discretionary expense • statistics • data • measures of central tendency • • mean median mode subscript index outlier skewed data set frequency distribution Slide 3

What do you need? What do you want? • What are the costs associated with items you need to make a living? • What are the costs associated with items you want to have but don’t need? • How do you budget for each? Slide 4

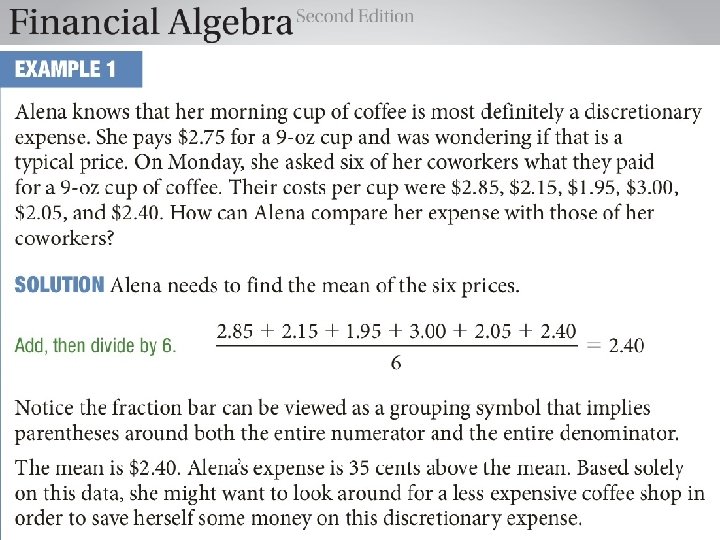

Example 2 Use the information about coffee prices in Example 1 to represent the formula for the mean price using a compact notation. Slide 7

Example 2 Use the information about coffee prices in Example 1 to represent the formula for the mean price using a compact notation. Slide 8

Example 3 Anthony wants to make a discretionary purchase of a basic laptop computer. He checks the prices of a particular make and model listed by seven different vendors on a shopping comparison website. He found these prices: $850, $798, $2, 400, $790, $836, $700, $780. He computes the mean as $1, 022. This number doesn’t seem to be a good representation of the data. How can he find a better representation? Slide 9

Example 3 CHECK YOUR UNDERSTANDING Construct a set of data for a different discretionary expense containing an odd number of scores with the same median as found in Example 3. Identify the type of expense you chose. Explain how the median is the same as the median in Example 3, although the rest of the data are different. Slide 10

Example 4 Suppose that in Example 3, Anthony had only found the first six laptop prices when he conducted his online search. Determine the median of those prices. Slide 11

Example 4 Suppose that in Example 3, Anthony had only found the first six laptop prices when he conducted his online search. Determine the median of those prices. Slide 12

Example 5 A survey was conducted of 880 college students attending the same university. They were offered a list of 10 different Internet service providers and were asked to select the one they prefer. Can a service provider receiving only 89 votes come out on top? Slide 13

Example 5 A survey was conducted of 880 college students attending the same university. They were offered a list of 10 different Internet service providers and were asked to select the one they prefer. Can a service provider receiving only 89 votes come out on top? Slide 14

Example 6 Transportation expenses to and from work are considered essential expenses. Charlie Jane would like to reduce this essential expense by biking to work rather than taking her car. She found 30 different ads both online and in print for the make and model of bicycle she wants to purchase. She made a list of the prices in ascending order. 250, 275, 280, 290, 310, 315, 315, 320, 325, 330, 335, 340, 350, 350 She wants to analyze the prices but is having trouble because there are so many numbers. How can she organize these prices in a helpful format? Slide 15

Example 6 She can create a frequency distribution or a frequency table. Simply create 2 columns, one for price and one for frequency. Because there are 30 prices in the set, the sum of the frequencies is 30. Slide 16

Example 7 Find the mean of the bicycle prices from Example 6. Slide 17

Example 7 Find the mean of the bicycle prices from Example 6. Just create another column that finds the product of the first two columns. Then divide by 30 to find the avg. 9250/30 = 308. 33 The mean bicycle price is $308. 33. Slide 18
- Slides: 18